Three-Story Office Building with
For Sale
Contact for pricing
7724 Raeford Road, Fayetteville, NC 28304
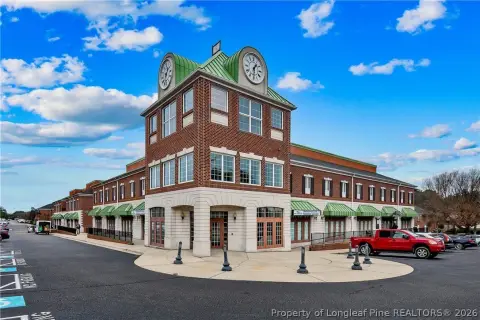
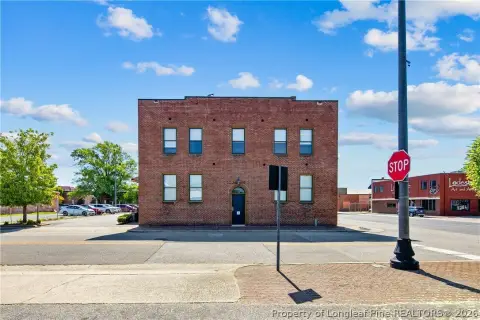
Three-story office property with monument and building signage, ample parking, and site plan approval for a second building.
Property Size20,193 SF
Lot Size3.39 Acres
Days on Market102
Property Features for 7724 Raeford Road
General Information
Standard status
Active
Size
20,193 SF
Total Parking Spaces
96
Lot size
3.39 Acres
Property subtype
Other
Occupancy
33%
Site & Location
Highway Access
Yes
Road Access
Yes
Building Details
Building Size
20,193 SF
Stories
3
Listing Agency:
Avison Young
Listed By:
Janet Clayton
(919) 785-0802
Source:
Commercialcafe
Added: Jun 22
Changed: Oct 1
Last Checked: Oct 1 at 8:41AM
Displayed information is deemed reliable but is not guaranteed and should be independently verified. All listing content including descriptions, pricing, images are the copyrighted material of Avison Young
Investment Insights
Based on property information with market context.
7724 & 7734 Raeford Rd offers a three-story office building totaling 20,193 square feet on 3.39 acres. The property includes monument and building signage along Raeford Road and provides a parking ratio of 4.77 spaces per 1,000 square feet. Site plan approval is in place for a second building of the same size, 20,193 square feet, allowing for an additional development phase on the property.
The asset is located just off U.S. 401/S Raeford Rd in Fayetteville, NC, in a corridor with abundant retailers, restaurants, and services nearby, and offers convenient access to regional destinations. The property is less than four miles from Cape Fear Valley Hoke Hospital and six miles from FirstHealth Moore Regional Hospital – Hoke. Cape Fear Valley Medical Center in Fayetteville is less than nine miles away, and I-295 is located less than two miles from the property.
Currently, the property is 33% leased to a well-established medical practice, with a remaining lease term of 3+ years and three 10-year renewal options. The building and approved expansion support a range of office and healthcare-adjacent uses, including general office, healthcare clinics, and mental and behavioral health, with visibility from Raeford Road signage and parking that can accommodate varied tenant needs.
The asset is located just off U.S. 401/S Raeford Rd in Fayetteville, NC, in a corridor with abundant retailers, restaurants, and services nearby, and offers convenient access to regional destinations. The property is less than four miles from Cape Fear Valley Hoke Hospital and six miles from FirstHealth Moore Regional Hospital – Hoke. Cape Fear Valley Medical Center in Fayetteville is less than nine miles away, and I-295 is located less than two miles from the property.
Currently, the property is 33% leased to a well-established medical practice, with a remaining lease term of 3+ years and three 10-year renewal options. The building and approved expansion support a range of office and healthcare-adjacent uses, including general office, healthcare clinics, and mental and behavioral health, with visibility from Raeford Road signage and parking that can accommodate varied tenant needs.
Key Highlights
- Three‑story office building built in 2016 totaling 120,193 SF on 3.39 acres
- Site plan approved for a second 120,193 SF building
- Currently 33% leased to a medical practice with 3+ years remaining and three 10‑year renewal options
Property Analytics
Unlock full access to Insights
Subscribe to Realmo Intelligence
Open Analytics
Current Use
Lease Details
33%
Occupancy
Yes
Highway access
Yes
Paved road access
Location Intelligence
Trade Area within ½ mile
354
Businesses Nearby
Explore this area
Business Placement
Demographics for 28304, NC
37,120
Population
16,424
Households
2.3
Avg Household Size
37
Median Age
25%
College-Educated
92%
High-School Grad
17.4 sq mi
ZIP Area
2,133
Density / Sq Mi
$57,867
Median Household Income
$35,907
Median Earnings
$1,218
Median Rent
$154,300
Median Home Value
Check the figures for this property
Cap Rate, Value Estimation, Potential NOI and more
View Realmo Analytics
Market
Vacancy Rate% for Office in South region

Questions? Ask Rey
Realmo’s AI knows this listing — price, zoning, demand, history. Ask anything.







Frequently Asked Questions
What type of property is this?
Office building - Three-story office property with monument and building signage, ample parking, and site plan approval for a second building.
Where is this office building located?
The property is located at 7724 Raeford Road Fayetteville, NC.
What are key features of this property?
This property features: Three‑story office building built in 2016 totaling 120,193 SF on 3.39 acres; Site plan approved for a second 120,193 SF building; Currently 33% leased to a medical practice with 3+ years remaining and three 10‑year renewal options