Three-Bedroom Residential Income
For Sale
$525,000
72 Bakersfield St, Boston, MA 02125
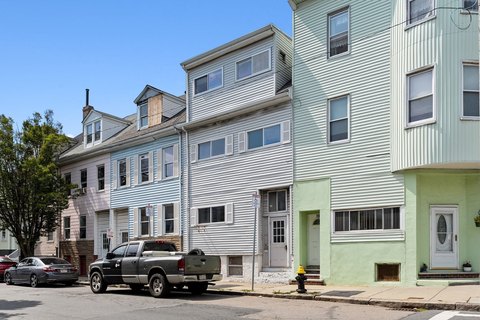
Condo residence with hardwood floors, flexible room use, an updated kitchen, and two full baths.
Property Size1,465 SF
Price / SF$358.36
Days on Market91
Property Features for 72 Bakersfield St
General Information
Standard status
Active
Size
1,465 SF
Property subtype
Apartment
Units
Unit Mix
1 x 3BR/2BA
Multifamily Units
1
Amenities
Range
Dishwasher
Disposal
Microwave
Refrigerator
Washer
Dryer
1 Fireplace
Wood
Tile
Hardwood
Hot Water, Natural Gas
2.0 Stories
$6,564 Taxes
Public
Built in 1905
Building Details
Year Built
1905
Listing Agency:
ERA Key Realty Services
(617) 932-7020
Listed By:
Jamie Iacoi
Source:
Donahuere
Added: Jul 23
Changed: Oct 21
Last Checked: Oct 20 at 5:02PM
Displayed information is deemed reliable but is not guaranteed and should be independently verified. All listing content including descriptions, pricing, images are the copyrighted material of ERA Key Realty Services

Ask AI about this property
Review the available facts, identify missing information and prepare questions for the agent.
Investment Insights
Based on property information with market context.
This condo residence provides 1,465 square feet with three bedrooms and two full bathrooms. The interior combines hardwood flooring and traditional trim with a layout that accommodates multiple living arrangements. A front room can function as dining space, an office, or an additional bedroom. The primary suite includes a sitting area or office, substantial closet storage, and a renovated private bathroom. A second full bath supports the remaining bedroom and common areas.
The kitchen has been updated with granite countertops. Built in 1905, the property is positioned along the Savin Hill and Uphams Corner line in Boston, at 72 Bakersfield St.
The kitchen has been updated with granite countertops. Built in 1905, the property is positioned along the Savin Hill and Uphams Corner line in Boston, at 72 Bakersfield St.
Key Highlights
- 1,465‑square‑foot condo residence with 3 bedrooms and 2 full bathrooms
- Flexible front room can serve as dining space, office, or third bedroom
- Primary suite includes sitting area or office, extensive closet space, and updated en‑suite bath
Financial Insights
Estimated NOI and Cap Rate
NOI / Yr
$34,416
Cap Rate
6.56%
Suggested Prices Based on Cap Rates
Cap Rate 5%
$688,320
$688.3K
Cap Rate 7%
$491,657
$491.7K
Cap Rate 9%
$382,400
$382.4K
Market Conditions
NOI Build-Up for 1,465 SF
Gross rent
$65.0K $44.40/SF
− Vacancy
−$2.5K −$1.69/SF
EGI
$62.6K $42.71/SF
− OpEx
−$28.2K −$19.22/SF
NOI
$34.4K $23.49/SF
Area
Boston, MA
Vacancy
3.80%
Lease Rate
$44.40 /SF/Yr
Expense Ratio
45.00%
Simulate Cap Rate and NOI
Suggested Prices Based on Cap Rates
Cap Rate 5%
$688,320
Cap Rate 7%
$491,657
Cap Rate 9%
$382,400
Alternative Uses
Best Use
Apartment 5plus
$491.7K
$430.2K – $573.6K
NOI $34,416 @ 7.0% cap · market cap 6.56%
Second Best
—
—
no second resolved use
Theoretical Best
Office A
$1.10M
$959.9K – $1.28M
NOI $76,789 @ 7.0% cap · market cap 14.63%
Zoning and permitted uses should be independently verified with authorities.
How Realmo checks its estimates
Property Analytics
Who owns this building?
See the owner, sales and loan history
Open Analytics
Lease Details
1
Residential units
Location Intelligence
Trade Area within ½ mile
1,674
Businesses Nearby
Explore this area
Business Placement
Demographics for 02125, MA
34,926
Population
14,999
Households
2.3
Avg Household Size
32
Median Age
42%
College-Educated
87%
High-School Grad
2.2 sq mi
ZIP Area
15,875
Density / Sq Mi
$71,810
Median Household Income
$52,106
Median Earnings
$1,897
Median Rent
$645,400
Median Home Value
Check the figures for this property
Cap Rate, Value Estimation, Potential NOI and more
View Realmo Analytics




Frequently Asked Questions
What type of property is this?
Residential income property - Condo residence with hardwood floors, flexible room use, an updated kitchen, and two full baths.
Where is this residential income property located?
The property is located at 72 Bakersfield St Boston, MA.
What is the asking price?
The asking price for this property is $525,000.
What are key features of this property?
This property features: 1,465‑square‑foot condo residence with 3 bedrooms and 2 full bathrooms; Flexible front room can serve as dining space, office, or third bedroom; Primary suite includes sitting area or office, extensive closet space, and updated en‑suite bath


