Two Adjoining Restaurant
For Sale
$2,350,000
704 E Brandon Boulevard BRANDON, Brandon, FL 33511
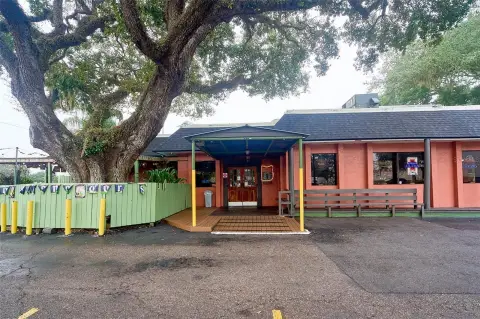
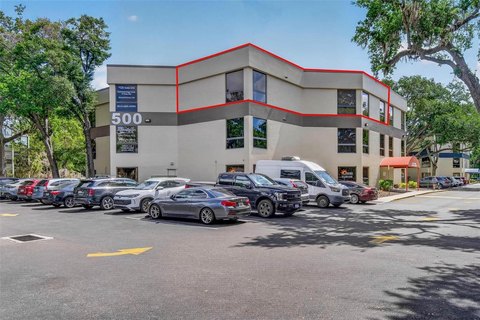
Two adjoining leased restaurant buildings with asphalt parking and shared access on a major Brandon boulevard.
Property Size5,409 SF
Lot Size1.10 Acres
Price / SF$231.98
Days on Market97
Property Features for 704 E Brandon Boulevard BRANDON
General Information
Standard status
Active
Size
5,409 SF
Lot size
1.10 Acres
Zoning
CG
Additional Details
Business Included
Yes
Taxes and HOA fees
Annual Taxes
$23,090
Amenities
Other
true
1
Public Records
Oak Trees
Central Business District,Curb and Gutters,Landscaped,Oversized Lot
Public
1.1582
1.16
2
false
Common
Paved,Asphalt
Slab
Street Paved,Business District,Divided Highway,Main Throrughfare,State Road
5409
Public Maintained Road
Building Details
Building Size
5,409 SF
Year Built
1980
Buildings
1
Stories
1
Listed By:
Erin Collins
(407) 656-7814
Source:
Therealestatecollection
Added: Jul 7
Changed: Oct 3
Last Checked: Oct 7 at 9:48AM
Displayed information is deemed reliable but is not guaranteed and should be independently verified. All listing content including descriptions, pricing, images are the copyrighted material of Erin Collins
Investment Insights
Based on property information with market context.
This offering includes two adjoining restaurant properties being sold together, with the price including the adjacent restaurant property at 706 E Brandon Boulevard. The sale is not available separately, and the restaurant property at 704 E Brandon Boulevard will only be conveyed as part of the combined package. The building has 5,409 gross square feet and 4,890 heated square feet per public record, and the restaurant is currently available with some owned furniture, fixtures, and equipment included. Seating is currently arranged for approximately 172 patrons. The property is leased on a month-to-month basis.
The combined restaurant locations sit with direct frontage on Brandon Boulevard (Highway 60) in the heart of Brandon and are positioned with practical everyday access. An extensive large asphalt parking lot supports easy arrival and departure. The property is located across the street from Nativity Catholic Church’s campus on Highway 60. The current common owner shares the parking lot with the property to the east (Sabor A Mexico), and there is direct access via Ridgewood Ave. through a lighted intersection at Ridgewood and Highway 60.
For operators, this configuration can support a multi-concept strategy or overflow dining need across two adjoining restaurant sites, while maintaining a single transaction for both addresses. Buyers benefit from the combination of frontage on a main corridor, on-site parking, and a current month-to-month lease structure. The included FF&E items provide a starting point for a new operator, subject to the existing lease terms.
The combined restaurant locations sit with direct frontage on Brandon Boulevard (Highway 60) in the heart of Brandon and are positioned with practical everyday access. An extensive large asphalt parking lot supports easy arrival and departure. The property is located across the street from Nativity Catholic Church’s campus on Highway 60. The current common owner shares the parking lot with the property to the east (Sabor A Mexico), and there is direct access via Ridgewood Ave. through a lighted intersection at Ridgewood and Highway 60.
For operators, this configuration can support a multi-concept strategy or overflow dining need across two adjoining restaurant sites, while maintaining a single transaction for both addresses. Buyers benefit from the combination of frontage on a main corridor, on-site parking, and a current month-to-month lease structure. The included FF&E items provide a starting point for a new operator, subject to the existing lease terms.
Key Highlights
- Two adjoining leased restaurant buildings (conveyed only together with 706 E Brandon Blvd)
- Direct frontage on Hwy 60/Brandon Blvd in the Central Business District
- Total lot size 1.16 acres (1.1582), with an oversized landscaped lot and oak trees
Financial Insights
Estimated NOI and Cap Rate
NOI / Yr
$168,004
Cap Rate
7.15%
Suggested Prices Based on Cap Rates
Cap Rate 5%
$3,360,080
$3.4M
Cap Rate 7%
$2,400,057
$2.4M
Cap Rate 9%
$1,866,711
$1.9M
Market Conditions
NOI Build-Up for 10,130 SF
Gross rent
$237.0K $23.40/SF
− Vacancy
−$13.0K −$1.29/SF
EGI
$224.0K $22.11/SF
− OpEx
−$56.0K −$5.53/SF
NOI
$168.0K $16.58/SF
Area
Brandon, FL
Vacancy
5.50%
Lease Rate
$23.40 /SF/Yr
Expense Ratio
25.00%
Simulate Cap Rate and NOI
Suggested Prices Based on Cap Rates
Cap Rate 5%
$3,360,080
Cap Rate 7%
$2,400,057
Cap Rate 9%
$1,866,711
Alternative Uses
Best Use
Specialty Retail
$2.40M
$2.10M – $2.80M
NOI $168,004 @ 7.0% cap · market cap 7.15%
Second Best
—
—
no second resolved use
Theoretical Best
Office A
$3.81M
$3.33M – $4.45M
NOI $266,751 @ 7.0% cap · market cap 11.35%
Zoning and permitted uses should be independently verified with authorities.
Property Analytics
Unlock full access to Insights
Subscribe to Realmo Intelligence
Open Analytics
Current Use
Lease Details
Turnkey business
Opportunity
Location Intelligence
Trade Area within ½ mile
3,514
Businesses Nearby
335k
Monthly Visits Nearby
Under-served
Demand for This Use
Explore this area
Business Placement
Foot Traffic Nearby
Shops & Services 34%
Dining 31%
Apparel 17%
Groceries 13%
Burlington
Apparel
55,949 visits/mo
0.4 miles
Publix
Groceries
43,819 visits/mo
0.3 miles
McDonald's
Dining
31,800 visits/mo
0.2 miles
7-Eleven
Shops & Services
19,557 visits/mo
0.1 miles
Wendy's
Dining
16,917 visits/mo
0.3 miles
Demographics for 33511, FL
56,627
Population
24,579
Households
2.3
Avg Household Size
38
Median Age
35%
College-Educated
91%
High-School Grad
16.0 sq mi
ZIP Area
3,539
Density / Sq Mi
$77,383
Median Household Income
$44,521
Median Earnings
$1,684
Median Rent
$324,900
Median Home Value
Check the figures for this property
Cap Rate, Value Estimation, Potential NOI and more
View Realmo Analytics
Market
Vacancy Rate% for Retail in South region

Questions? Ask Rey
Realmo’s AI knows this listing — price, zoning, demand, history. Ask anything.




Similar Off Market Nearby
- Umi Sushi & Seafood Buffet -Brandon FL — 1528 W Brandon Blvd, Brandon, FL 33510
Frequently Asked Questions
What type of property is this?
Conventional restaurant - Two adjoining leased restaurant buildings with asphalt parking and shared access on a major Brandon boulevard.
Where is this conventional restaurant located?
The property is located at 704 E Brandon Boulevard BRANDON Brandon, FL.
What is the asking price?
The asking price for this property is $2,350,000.
What are key features of this property?
This property features: Two adjoining leased restaurant buildings (conveyed only together with 706 E Brandon Blvd); Direct frontage on Hwy 60/Brandon Blvd in the Central Business District; Total lot size 1.16 acres (1.1582), with an oversized landscaped lot and oak trees