Remodeled Downtown Flex
For Sale
$690,000
Pending
701 SE 10TH Avenue, Amarillo, TX 79101
Commercial Sale, Amarillo, TX
Property Size10,300 SF
Days on Market121
Property Features for 701 SE 10TH Avenue
General Information
Property type
Commercial Sale
Property subtype
Other
Zoning description
0300 - NE Amarillo in City Limits
Directions
Heading down town from I-40 turn East on 10th to address.
Subdivision
0300 - Santa Fe Station
Standard status
Pending
APN
216244
Size
10,300 SF
Taxes and HOA fees
Tax Description
MIRROR'S ADDN LOTBLOCK 0401 6 LESS S 5FT ROW & S 50 FT OF 7
Legal Description
MIRROR'S ADDN LOTBLOCK 0401 6 LESS S 5FT ROW & S 50 FT OF 7
Amenities
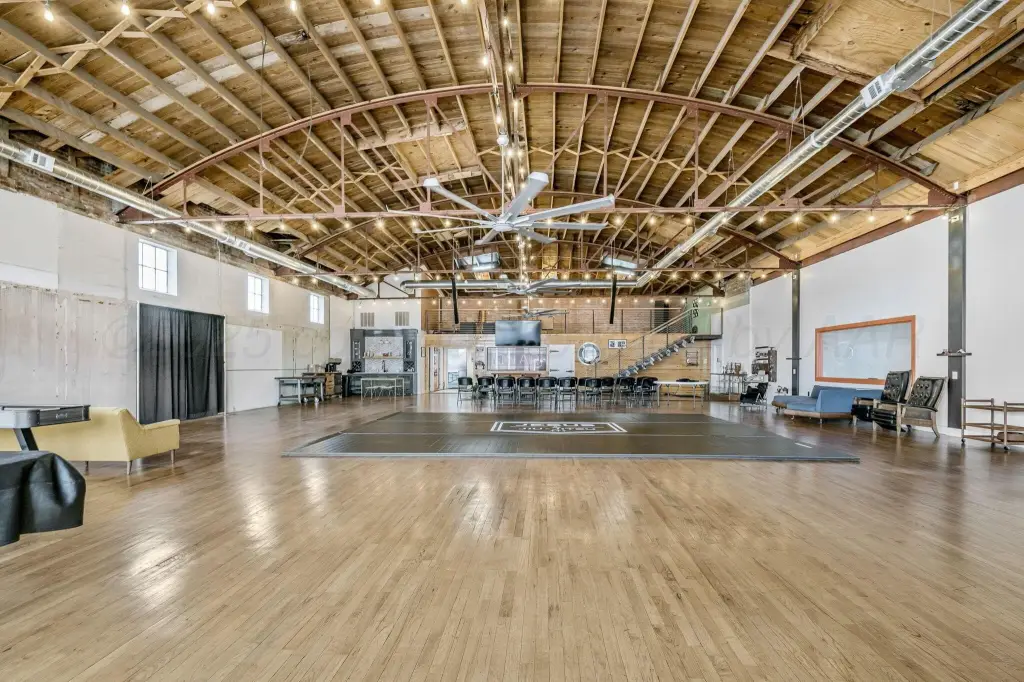
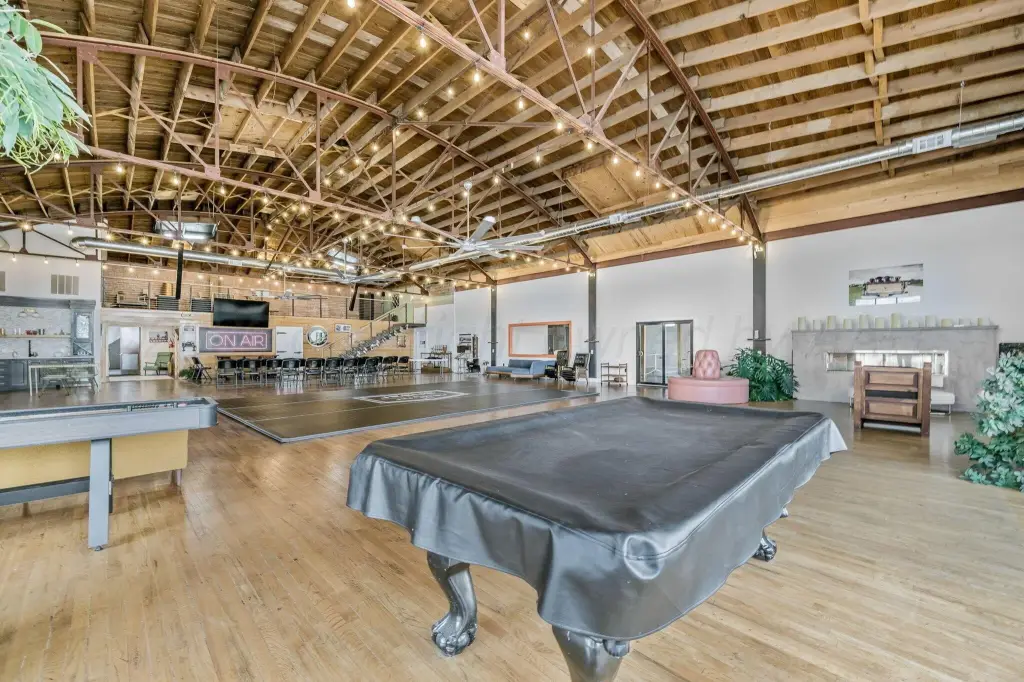
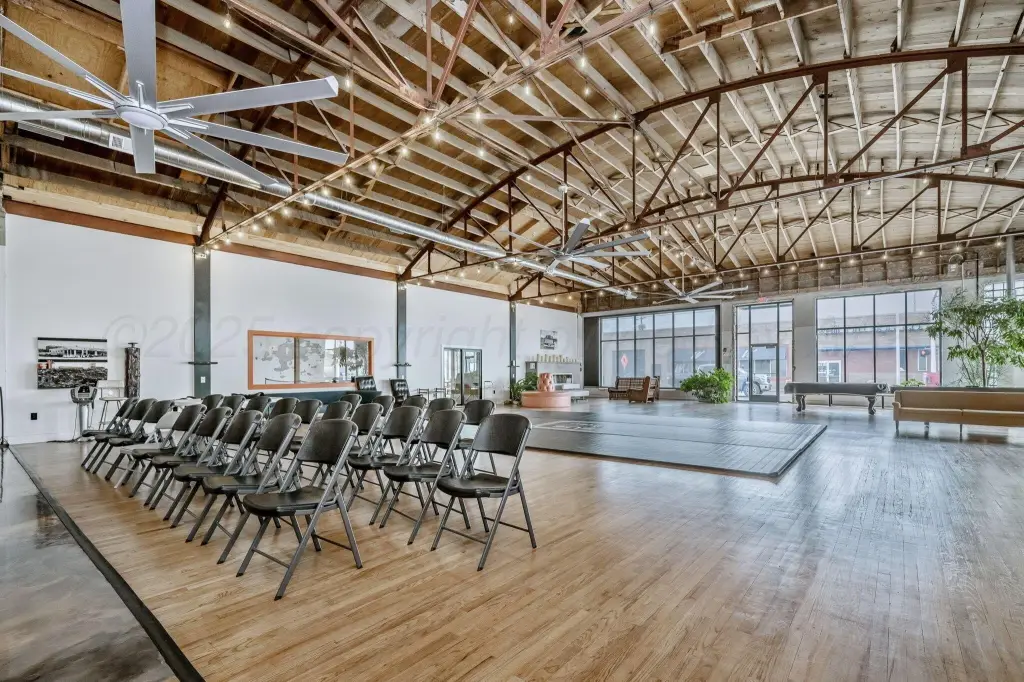
barrel ceiling
hardwood flooring
wet bar
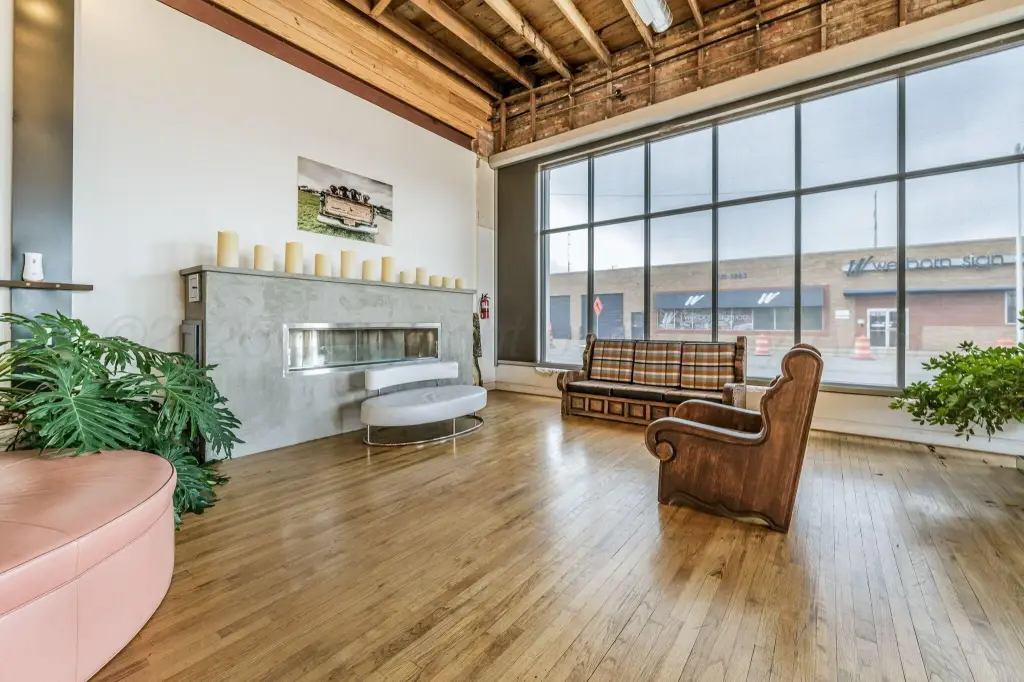
fireplace
open work spaces
basement
loft area
warehouse space
overhead doors
ADA bathrooms
awnings
Building Details
Year built
1925
Listing Agency:
Gaut Whittenburg Emerson Commercial Real Estate, LLC
(806) 373-3111
Listed By:
Miles Bonifield
(806) 584-7365
Added: Jun 25
Changed: Oct 19
Last Checked: Oct 23 at 10:06PM
MLS# 25-9131
Copyright © 2026 Amarillo Association of REALTORS. All rights reserved. All information provided by the listing agent/broker is deemed reliable but is not guaranteed and should be independently verified.

Ask AI about this property
Review the available facts, identify missing information and prepare questions for the agent.
Investment Insights
Based on property information with market context.
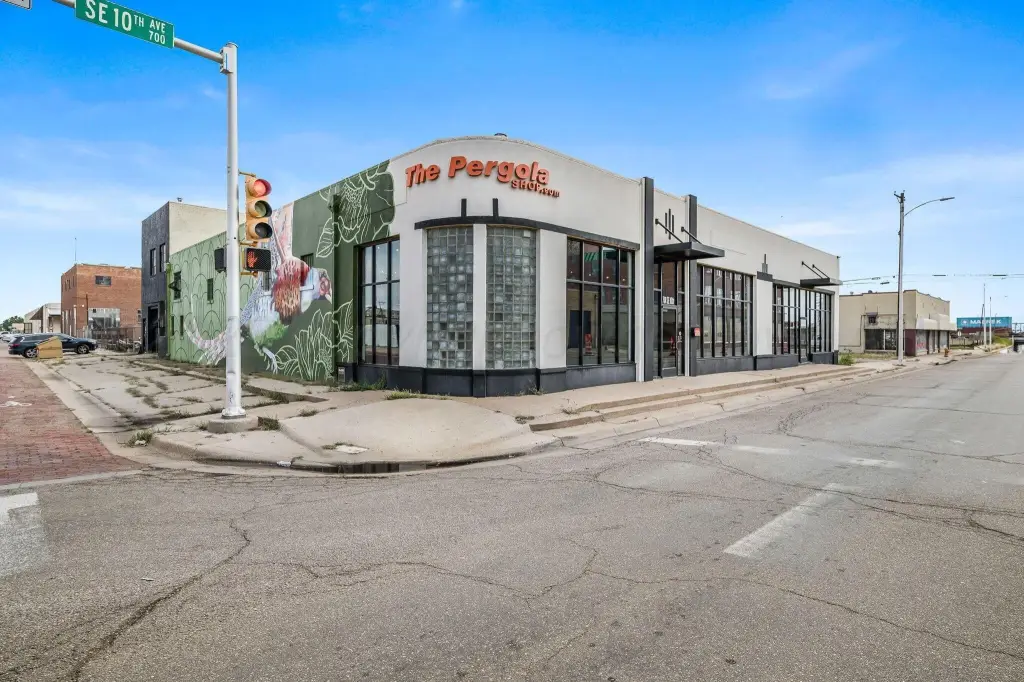
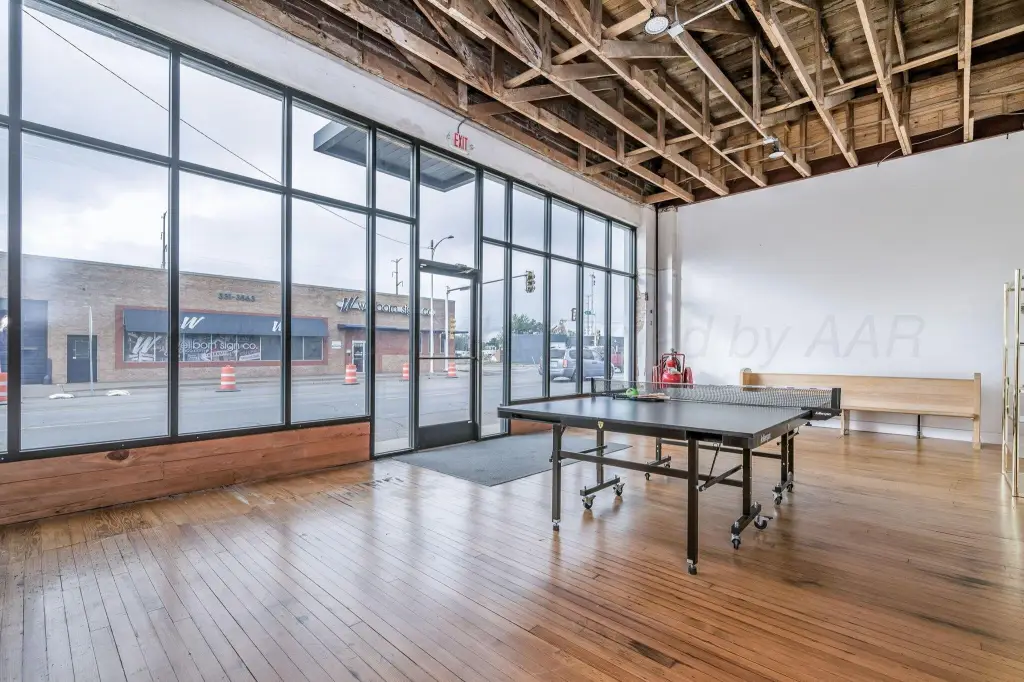
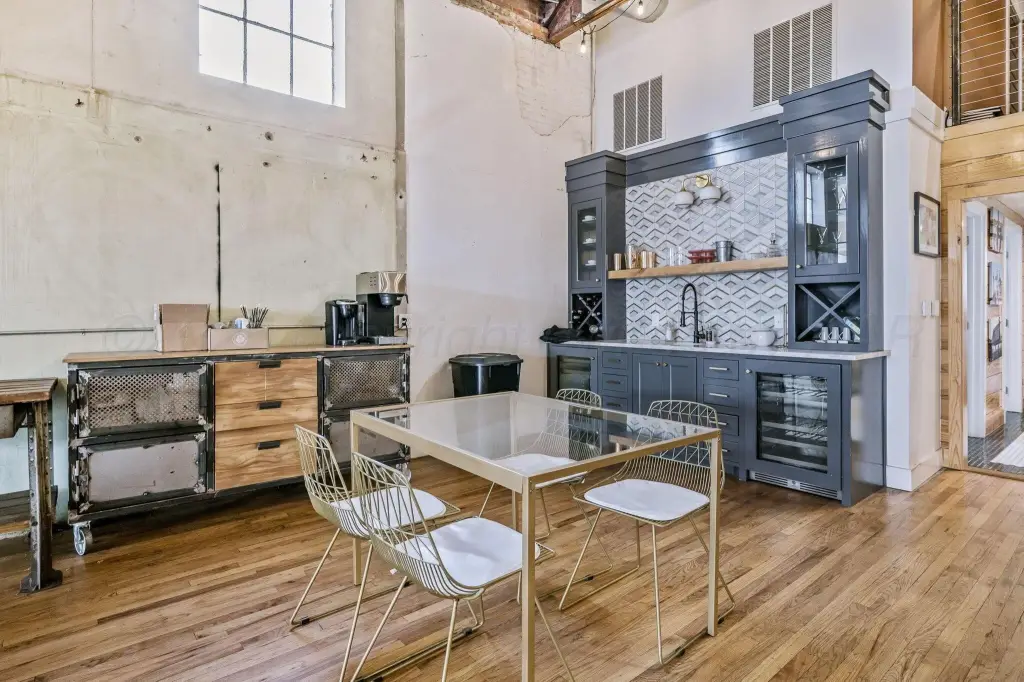
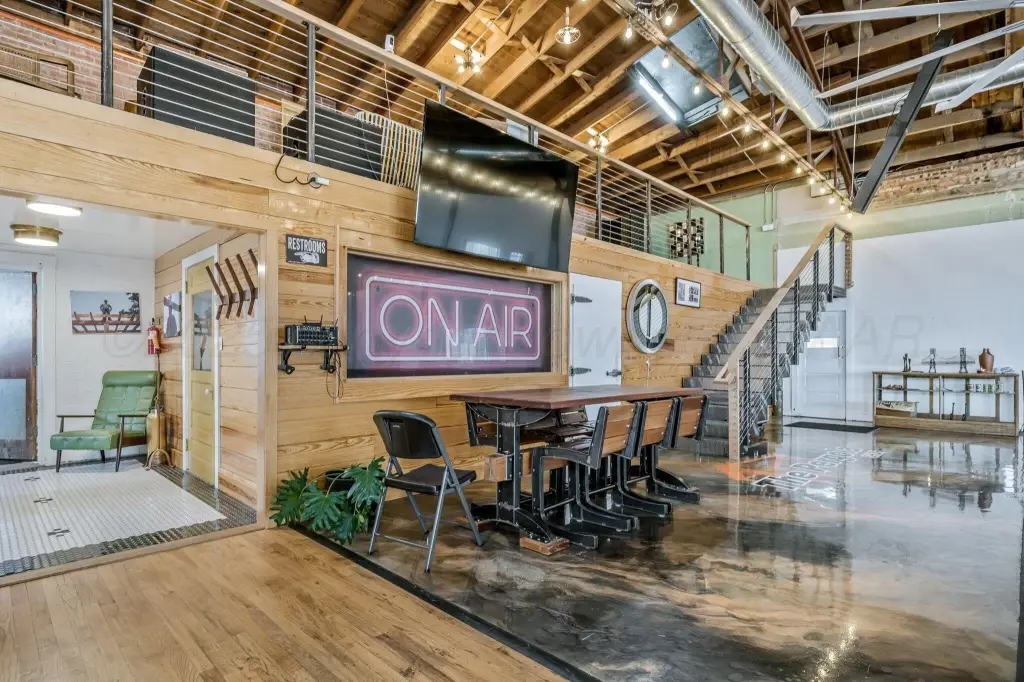
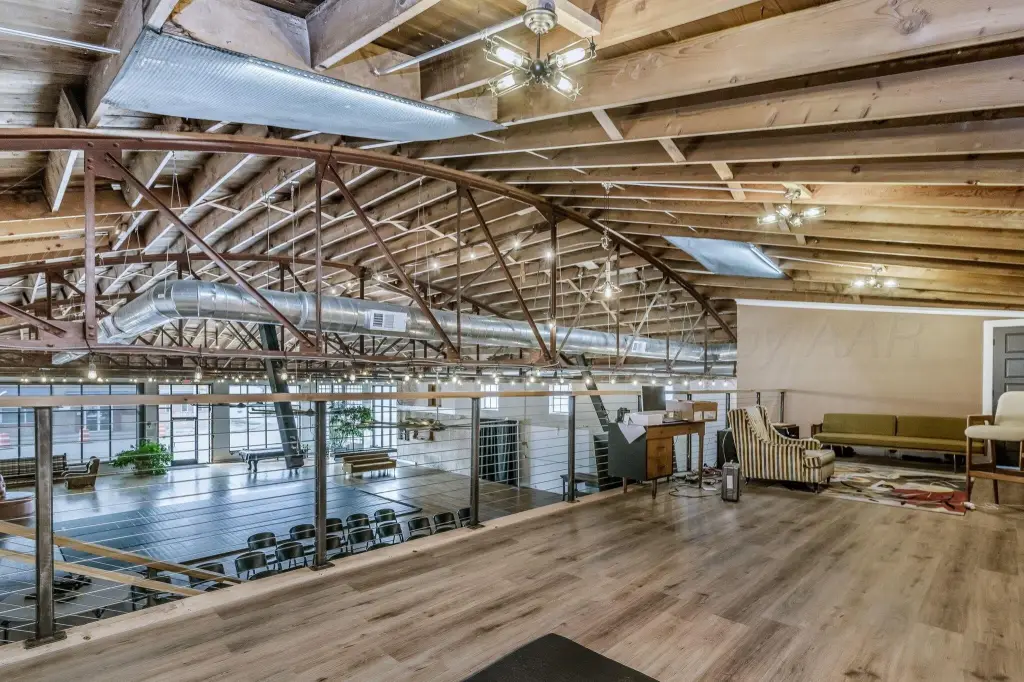
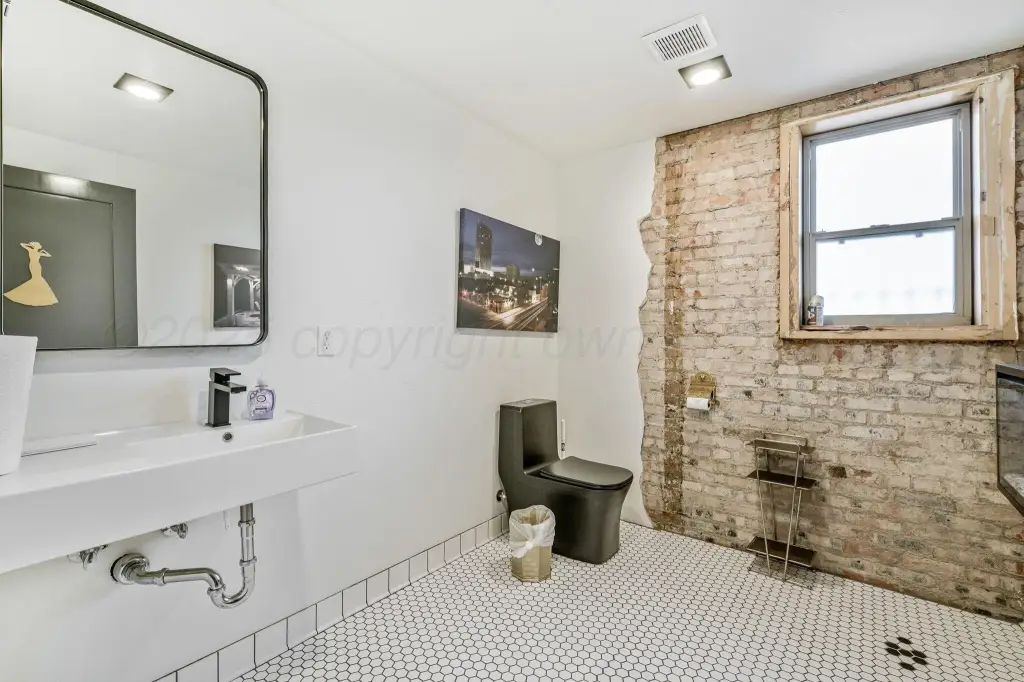
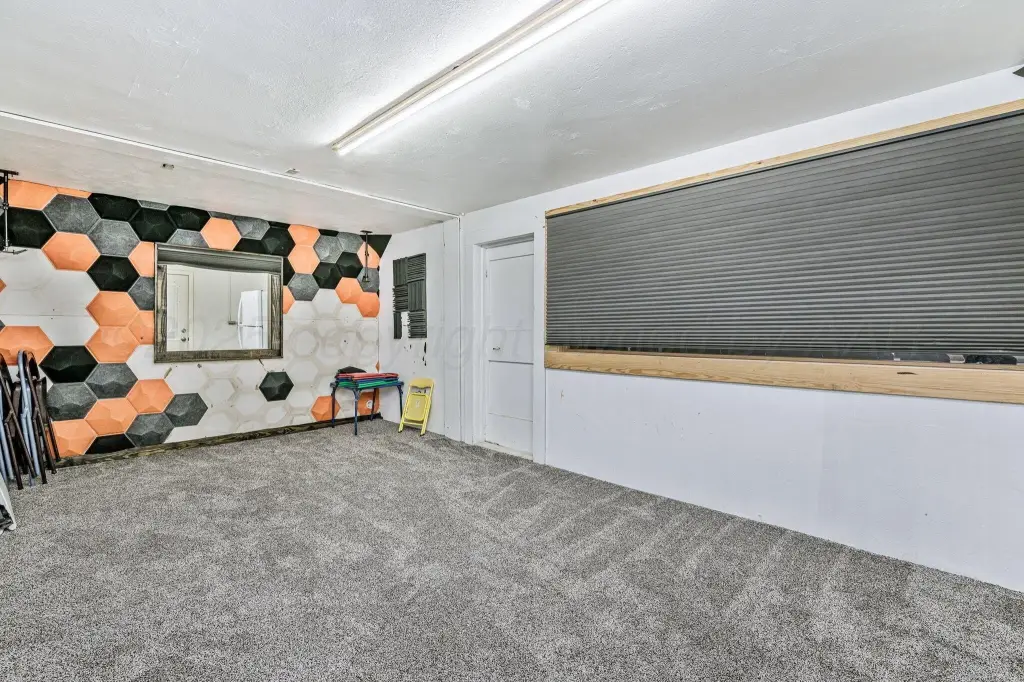
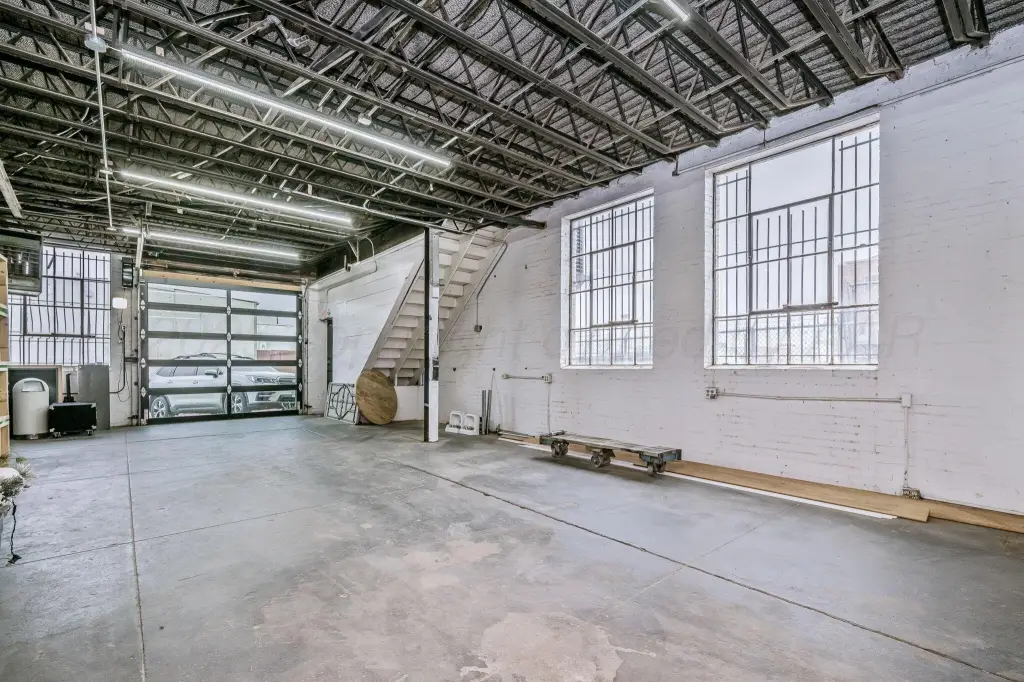
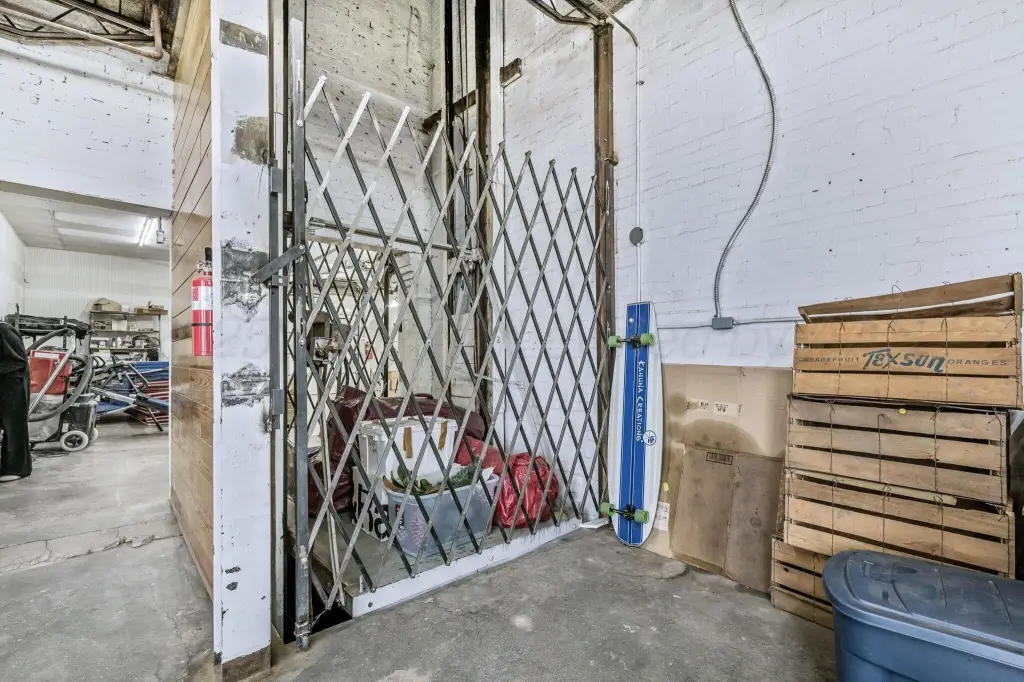
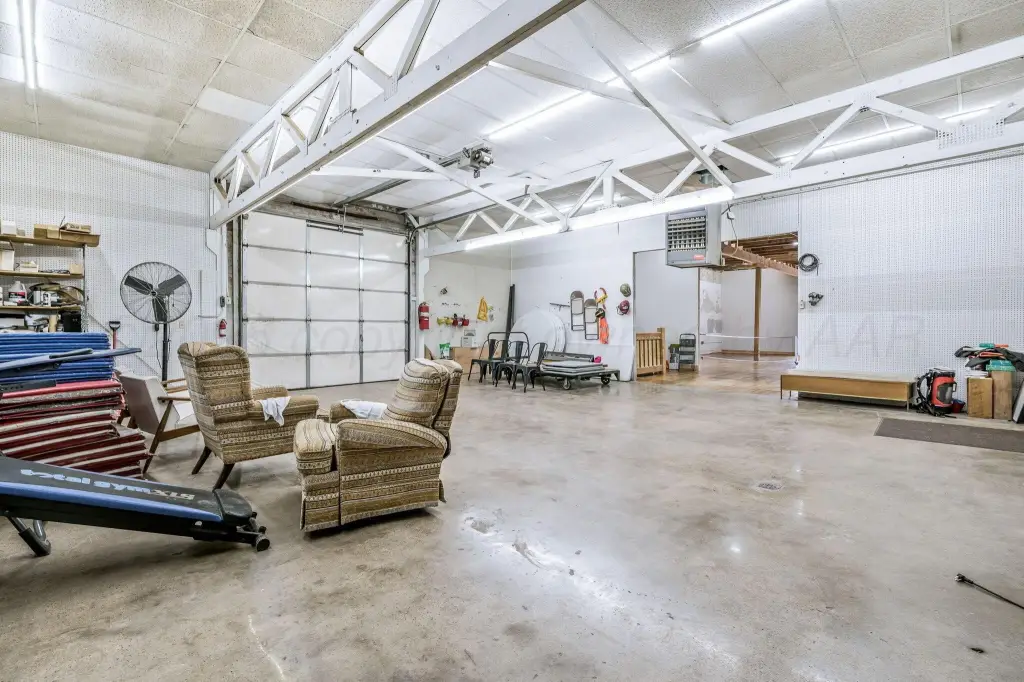
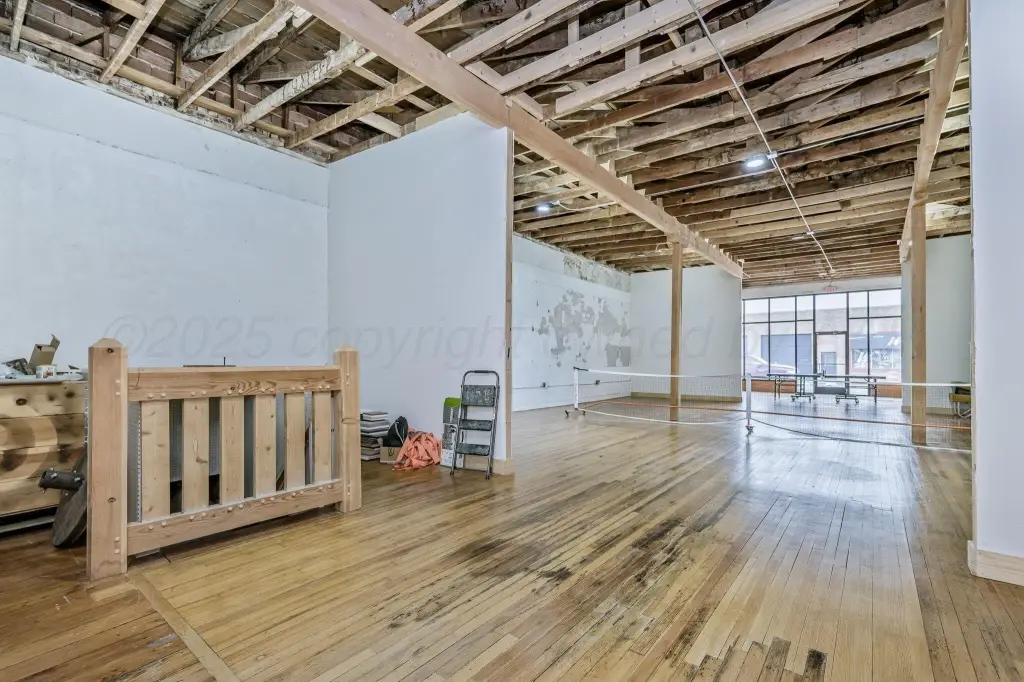
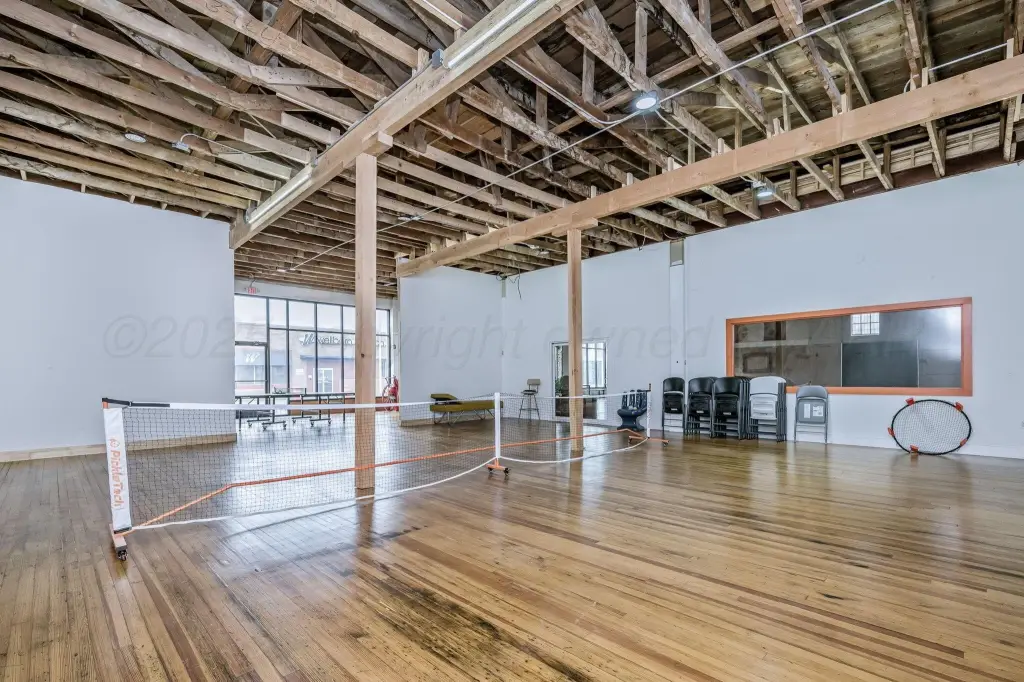
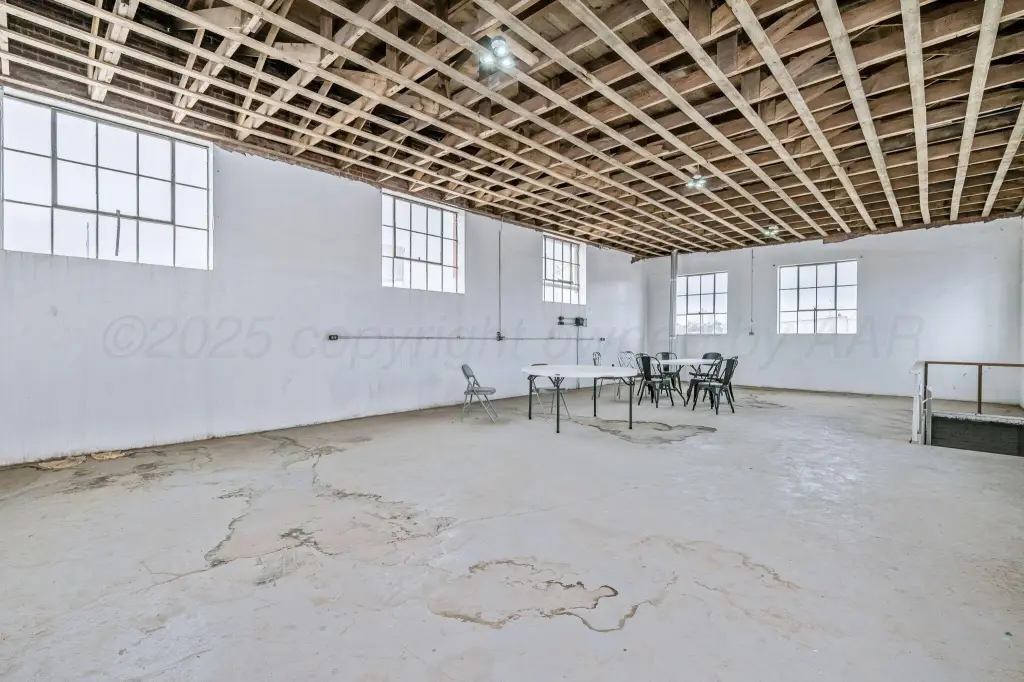
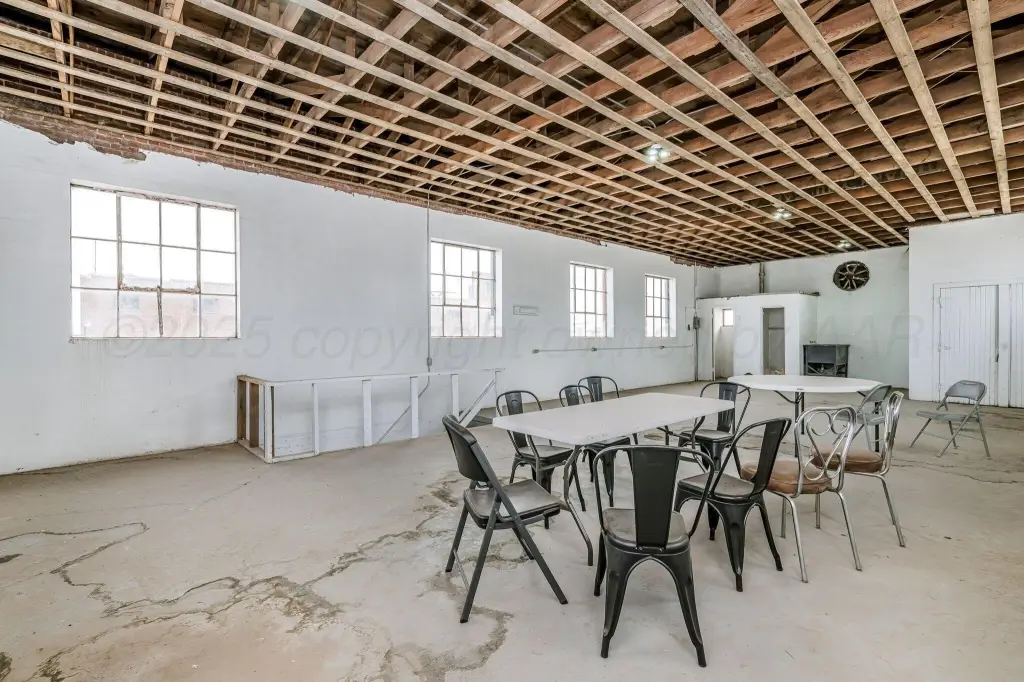
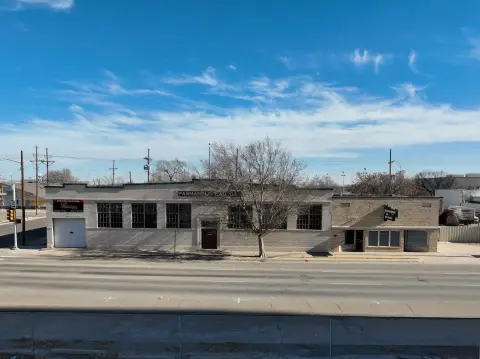
This 10,300-square-foot flex property, originally built in 1925, was remodeled in 2020 and combines retail, office, and warehouse components. The building includes two large showrooms, loft space, open work areas, a warehouse with two overhead doors and electric openers, three bathrooms—including two ADA bathrooms—and a basement. Interior features include a barrel ceiling, hardwood floors, wet bar, fireplace, and a showroom freight elevator.
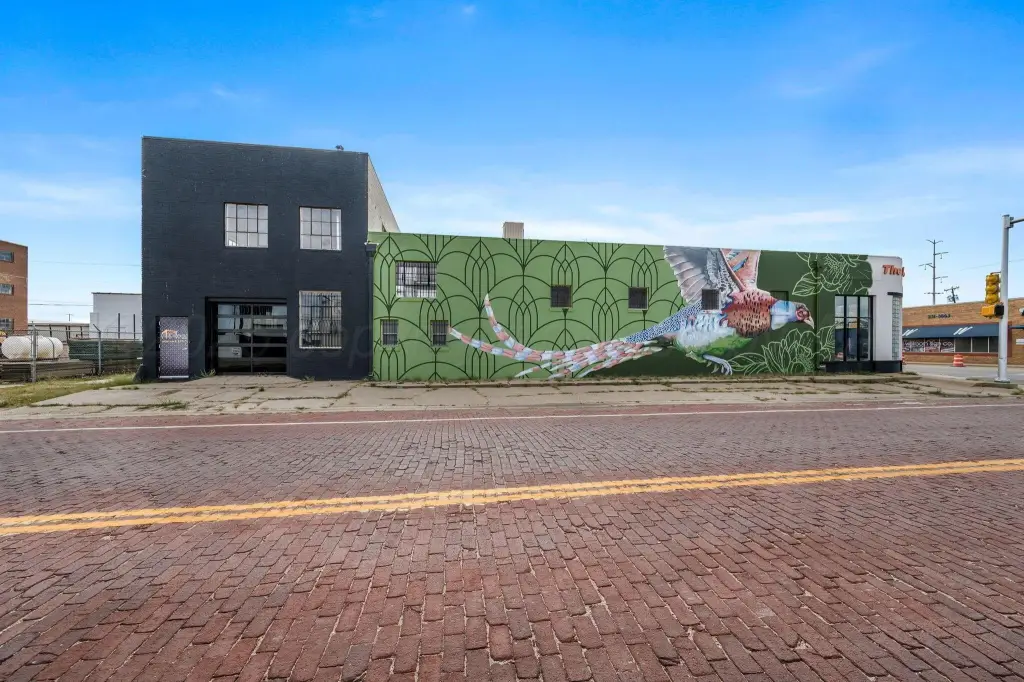
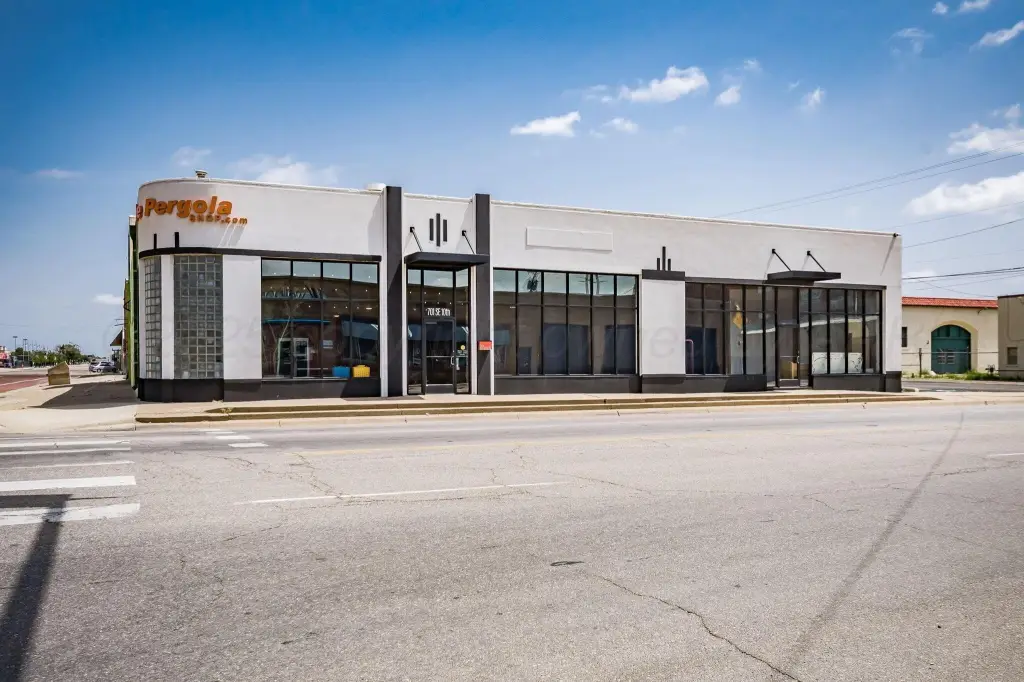
Additional improvements completed in 2020 include retail glass windows, a glass overhead door, a new HVAC system serving the main showroom, a TPO roof sealed with a silicone coating, front awnings, and exterior painting. The hard-corner property is approximately 700 feet from Hodgetown and includes parking along Johnson and a parking lot.
Additional improvements completed in 2020 include retail glass windows, a glass overhead door, a new HVAC system serving the main showroom, a TPO roof sealed with a silicone coating, front awnings, and exterior painting. The hard-corner property is approximately 700 feet from Hodgetown and includes parking along Johnson and a parking lot.
Key Highlights
- 10,300 SF flex building with retail, office, showroom, and warehouse areas
- Remodeled in 2020 with updated HVAC, ADA bathrooms, glass storefront windows, and exterior improvements
- Warehouse includes 2 overhead doors with electric openers
Financial Insights
Estimated NOI and Cap Rate
NOI / Yr
$61,970
Cap Rate
8.98%
Suggested Prices Based on Cap Rates
Cap Rate 5%
$1,239,400
$1.2M
Cap Rate 7%
$885,286
$885.3K
Cap Rate 9%
$688,556
$688.6K
Market Conditions
NOI Build-Up for 10,300 SF
Gross rent
$92.7K $9.00/SF
− Vacancy
−$4.2K −$0.41/SF
EGI
$88.5K $8.59/SF
− OpEx
−$26.6K −$2.58/SF
NOI
$62.0K $6.02/SF
Area
Amarillo, TX
Vacancy
4.50%
Lease Rate
$9.00 /SF/Yr
Expense Ratio
30.00%
Simulate Cap Rate and NOI
Suggested Prices Based on Cap Rates
Cap Rate 5%
$1,239,400
Cap Rate 7%
$885,286
Cap Rate 9%
$688,556
Alternative Uses
Best Use
Office B
$1.69M
$1.48M – $1.97M
NOI $118,193 @ 7.0% cap · market cap 17.13%
Second Best
Retail
$1.42M
$1.24M – $1.66M
NOI $99,498 @ 7.0% cap · market cap 14.42%
Theoretical Best
Office A
$2.30M
$2.01M – $2.68M
NOI $160,977 @ 7.0% cap · market cap 23.33%
Zoning and permitted uses should be independently verified with authorities.
How Realmo checks its estimates
Property Analytics
Unlock full access to Insights
Subscribe to Realmo Intelligence
Open Analytics
Current Use
Location Intelligence
Trade Area within ½ mile
1,803
Businesses Nearby
Under-served
Demand for This Use
Explore this area
Business Placement
Demographics for 79101, TX
2,307
Population
1,309
Households
1.8
Avg Household Size
51
Median Age
15%
College-Educated
81%
High-School Grad
1.6 sq mi
ZIP Area
1,442
Density / Sq Mi
$40,313
Median Household Income
$36,409
Median Earnings
$898
Median Rent
$152,300
Median Home Value
Check the figures for this property
Cap Rate, Value Estimation, Potential NOI and more
View Realmo Analytics
Market
Vacancy Rate% for Office in South region



Similar Off Market Nearby
- KFC Catering — 1510 Ross St, Amarillo, TX 79102
Frequently Asked Questions
What type of property is this?
Flex space - Adaptable commercial space combines showrooms, office areas, warehouse capacity, and parking in a central downtown setting.
Where is this flex space located?
The property is located at 701 SE 10TH Avenue Amarillo, TX.
What is the asking price?
The asking price for this property is $690,000.
What are key features of this property?
This property features: 10,300 SF flex building with retail, office, showroom, and warehouse areas; Remodeled in 2020 with updated HVAC, ADA bathrooms, glass storefront windows, and exterior improvements; Warehouse includes 2 overhead doors with electric openers


