Redevelopment Mixed-Use
For Sale
Contact for pricing
610 N Main St, Greenville, SC 29611
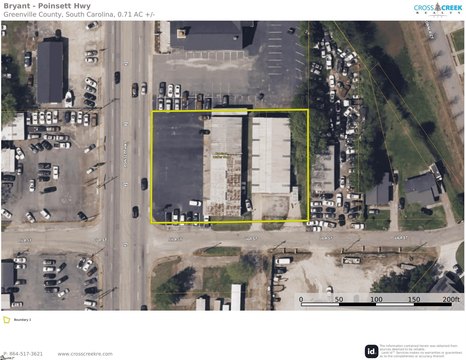
Two-parcel assemblage with an office building in shell condition and an occupied retail/entertainment building.
Property Size8,700 SF
Lot Size0.70 Acres
Price / SF$425.29
Days on Market184
Property Features for 610 N Main St
General Information
Standard status
Active
Size
8,700 SF
Lot size
0.70 Acres
Property subtype
Mixed Use, Land
Zoning
MX-2 (City of Greenville)
Investment Type
Redevelopment
Additional Details
Road Access
Yes
Building Details
Buildings
2
Tenancy
Single
Listing Agency:
SVN Palmetto
Listed By:
Daniel Holloway · License #SC 106855
(864) 593-6644
Source:
Crexi
Added: Apr 21
Changed: Oct 19
Last Checked: Oct 20 at 6:36PM
Displayed information is deemed reliable but is not guaranteed and should be independently verified. All listing content including descriptions, pricing, images are the copyrighted material of SVN Palmetto

Ask AI about this property
Review the available facts, identify missing information and prepare questions for the agent.
Investment Insights
Based on property information with market context.
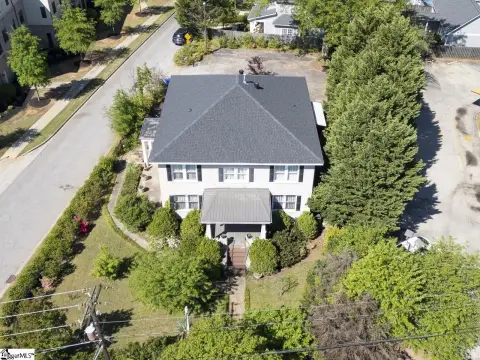
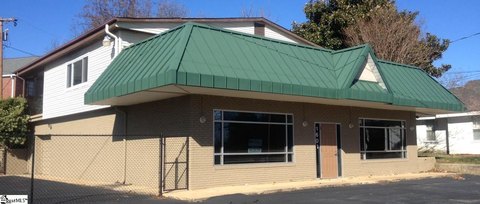
The offering includes two parcels along North Main Street. 610 N. Main contains an approximately 4,500 SF office building in shell condition. 614 N. Main includes an approximately 4,200 SF building currently occupied by a retail/entertainment tenant. Please do not disturb the tenant at 614 N. Main.
The parcels are directly across the street from the Noma City Terrace Townhome development. The site is within walking distance of the revitalized shops at 505 North Main, McPherson Park, and dining options on Stone Avenue.
Flexible MX-2 zoning supports a variety of uses with structures sized for 2 to 4 stories, and the information provided indicates no limits on residential density. The property is being marketed as a redevelopment opportunity for residential or mixed-use plans.
The parcels are directly across the street from the Noma City Terrace Townhome development. The site is within walking distance of the revitalized shops at 505 North Main, McPherson Park, and dining options on Stone Avenue.
Flexible MX-2 zoning supports a variety of uses with structures sized for 2 to 4 stories, and the information provided indicates no limits on residential density. The property is being marketed as a redevelopment opportunity for residential or mixed-use plans.
Key Highlights
- Two‑parcel assemblage on N. Main St totaling approximately 0.7 AC in downtown Greenville
- 610 N. Main: ±4,500 SF office building in shell condition
- 614 N. Main: ±4,200 SF building occupied by a retail/entertainment tenant (do not disturb)
Financial Insights
Estimated NOI and Cap Rate
NOI / Yr
$133,799
Cap Rate
3.62%
Suggested Prices Based on Cap Rates
Cap Rate 5%
$2,675,980
$2.7M
Cap Rate 7%
$1,911,414
$1.9M
Cap Rate 9%
$1,486,656
$1.5M
Market Conditions
NOI Build-Up for 8,700 SF
Gross rent
$200.4K $23.04/SF
− Vacancy
−$22.0K −$2.53/SF
EGI
$178.4K $20.51/SF
− OpEx
−$44.6K −$5.13/SF
NOI
$133.8K $15.38/SF
Area
Greenville County, SC
Vacancy
11.00%
Lease Rate
$23.04 /SF/Yr
Expense Ratio
25.00%
Simulate Cap Rate and NOI
Suggested Prices Based on Cap Rates
Cap Rate 5%
$2,675,980
Cap Rate 7%
$1,911,414
Cap Rate 9%
$1,486,656
Alternative Uses
Best Use
Office B
$1.91M
$1.67M – $2.23M
NOI $133,799 @ 7.0% cap · market cap 3.62%
Second Best
Retail
$1.84M
$1.61M – $2.15M
NOI $128,922 @ 7.0% cap · market cap 3.48%
Theoretical Best
Office A
$3.72M
$3.25M – $4.34M
NOI $260,202 @ 7.0% cap · market cap 7.03%
Zoning and permitted uses should be independently verified with authorities.
How Realmo checks its estimates
Property Analytics
Who owns this building?
See the owner, sales and loan history
Open Analytics
Current Use
Lease Details
Yes
Paved road access
Location Intelligence
Trade Area within ½ mile
554
Businesses Nearby
Explore this area
Business Placement
Demographics for 29611, SC
32,413
Population
14,620
Households
2.2
Avg Household Size
36
Median Age
19%
College-Educated
78%
High-School Grad
23.9 sq mi
ZIP Area
1,356
Density / Sq Mi
$47,046
Median Household Income
$32,272
Median Earnings
$1,092
Median Rent
$163,600
Median Home Value
Check the figures for this property
Cap Rate, Value Estimation, Potential NOI and more
View Realmo Analytics
Market
Vacancy Rate% for Office in Greenville, SC




Frequently Asked Questions
What type of property is this?
Mixed-use property - Two-parcel assemblage with an office building in shell condition and an occupied retail/entertainment building.
Where is this mixed-use property located?
The property is located at 610 N Main St Greenville, SC.
What is the asking price?
The asking price for this property is $3,700,000.
What are key features of this property?
This property features: Two‑parcel assemblage on N. Main St totaling approximately 0.7 AC in downtown Greenville; 610 N. Main: ±4,500 SF office building in shell condition; 614 N. Main: ±4,200 SF building occupied by a retail/entertainment tenant (do not disturb)


