Single-Level Income
For Sale
$415,000
546 S Bangor Way, Nampa, ID 83687
Residential Income, Nampa, ID
Property Size2,007 SF
Lot Size0.17 Acres
Price / SF$206.78
Days on Market142
Property Features for 546 S Bangor Way
General Information
Property type
Residential Multi Family
Property subtype
Other
Zoning description
Single Family Residential
Bedrooms
4
Bathrooms
2
Full bathrooms
2
Rooms
Bedroom 3, Bathroom 1, Bedroom 2, Bedroom 1, Bedroom 4, Bathroom 2
Parking
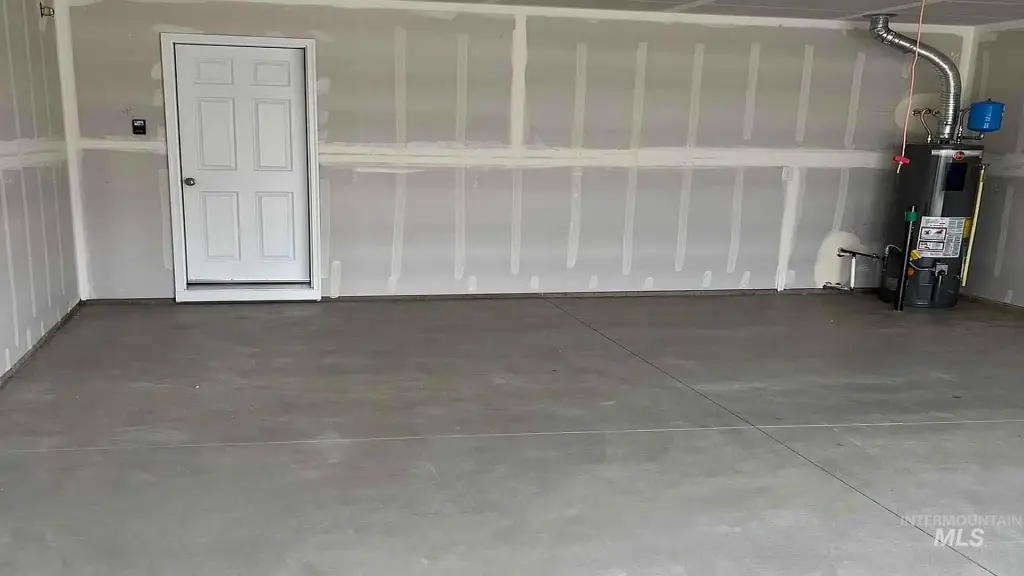
2
Parking features
Driveway
Appliances
Disposal (All Units), Stove/Range (All Units), Refrigerator (All Units)
Subdivision
aberdeen springs
Lot features
Standard Lot 6000-9999 S F, Sidewalks
Elementary school
Parkridge
Middle school
East Valley Mid
High school
Columbia
Elementary school district
Nampa School District #131
Middle school district
Nampa School District #131
High school district
Nampa School District #131
Directions
From I-84 take Exit 38 Garrity Blvd, L on E Flamingo Ave, R on N Happy Valley Rd, R on Mihan Ln, R on Queens, L on Bangor Way
Standard status
Active
APN
R3179913800
Size
2,007 SF
Lot size
0.17 Acres
Taxes and HOA fees
Tax Year
2025
Tax Description
25-3N-2W SW Aberdeen Springs LT 12 BLK 3
Tax Annual Amount
2759
HOA Fee
$400 Annually
Legal Description
25-3N-2W SW Aberdeen Springs LT 12 BLK 3
Utilities
Heating system
Forced Air, Natural Gas
Cooling system
Central Air
Building Details
Year built
2022
Number of units
1
Building materials
Stone, Vinyl Siding
Roof type
Composition
Listing Agency:
Silvercreek Realty Group
(208) 377-0422
Listed By:
Stanley Tonkin · License #AB30809
(208) 860-4771
Added: Jun 1
Changed: Oct 15
Last Checked: Oct 20 at 5:06PM
MLS# 98988590
Copyright © 2026 Intermountain Multiple Listing Service. All rights reserved. All information provided by the listing agent/broker is deemed reliable but is not guaranteed and should be independently verified.

Ask AI about this property
Review the available facts, identify missing information and prepare questions for the agent.
Investment Insights
Based on property information with market context.
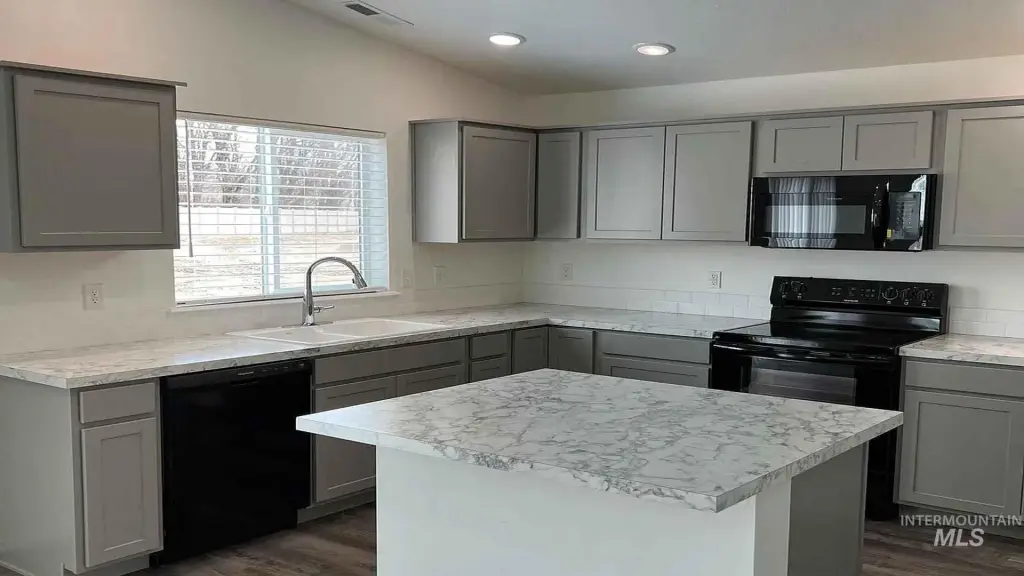
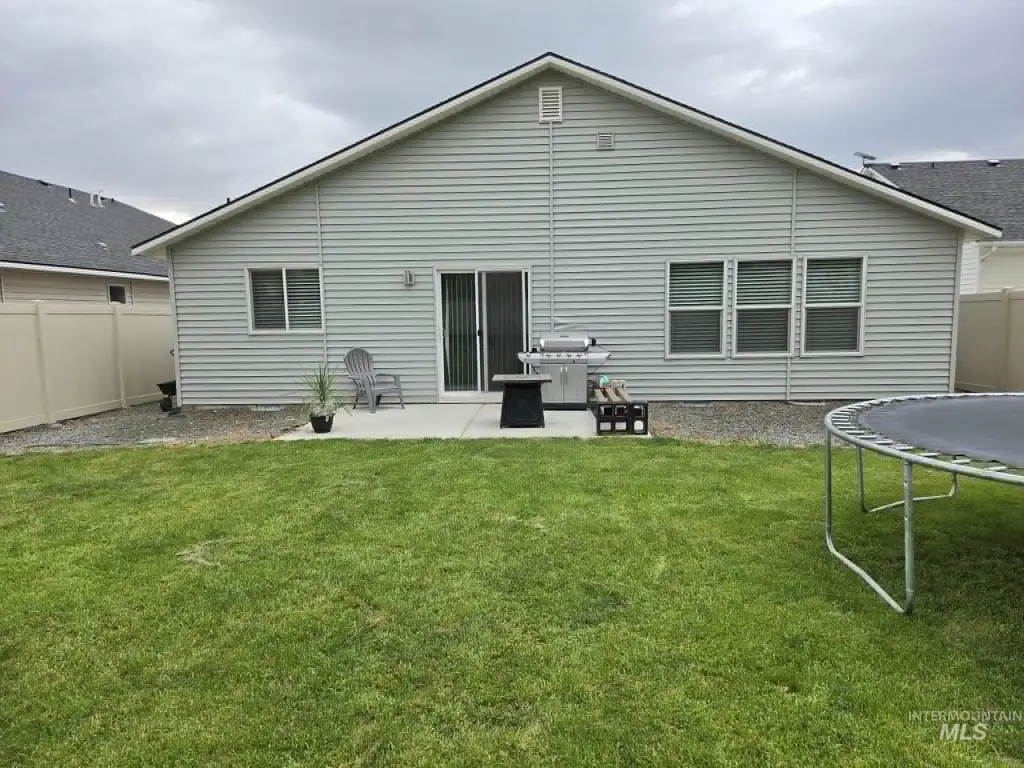
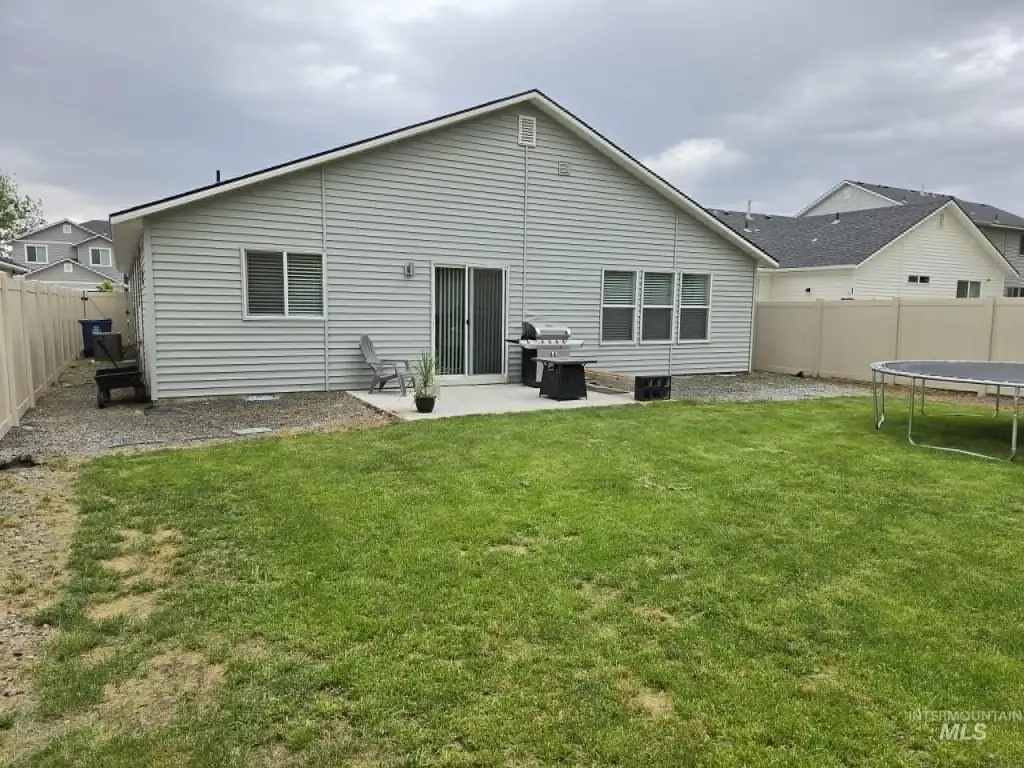
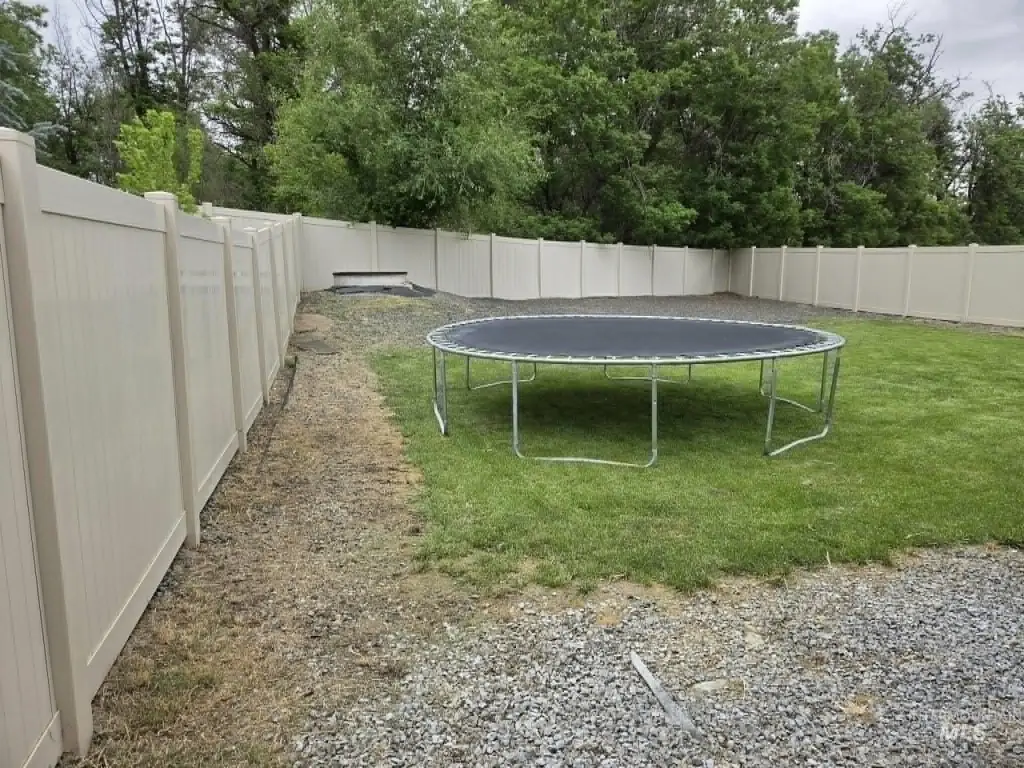
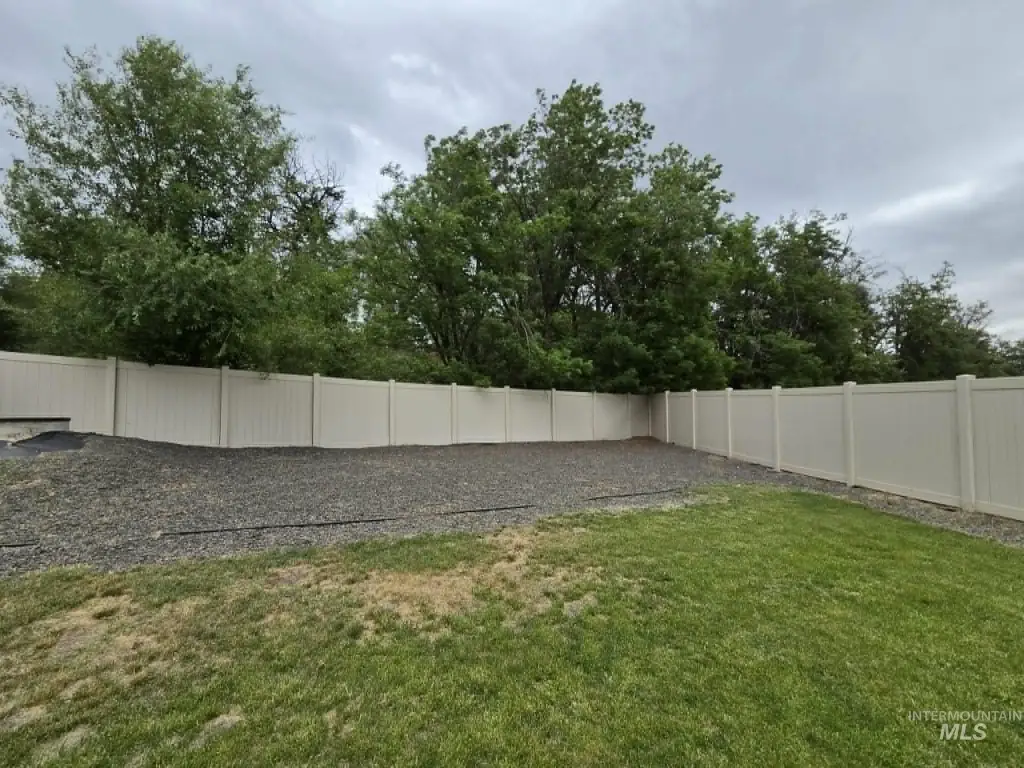
This single-level income property is offered for sale with a lease in place through April 30, 2027. The layout features four bedrooms and two bathrooms, along with a two-car garage. Inside, a wide open living room connects to the dining and kitchen area, including an island breakfast bar. The unit includes all appliances, with a refrigerator noted as part of the offering. The primary suite includes a large bathroom with a tub and a walk-in shower. At the rear, the windows overlook the patio and a sizable backyard that adjoins acreage of mature trees.
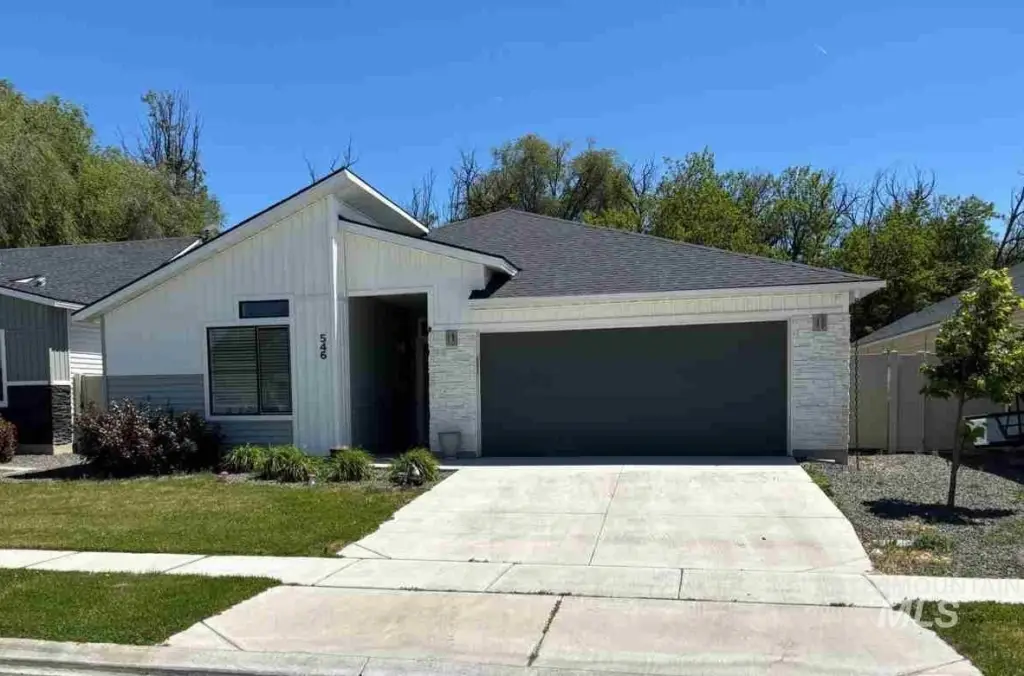
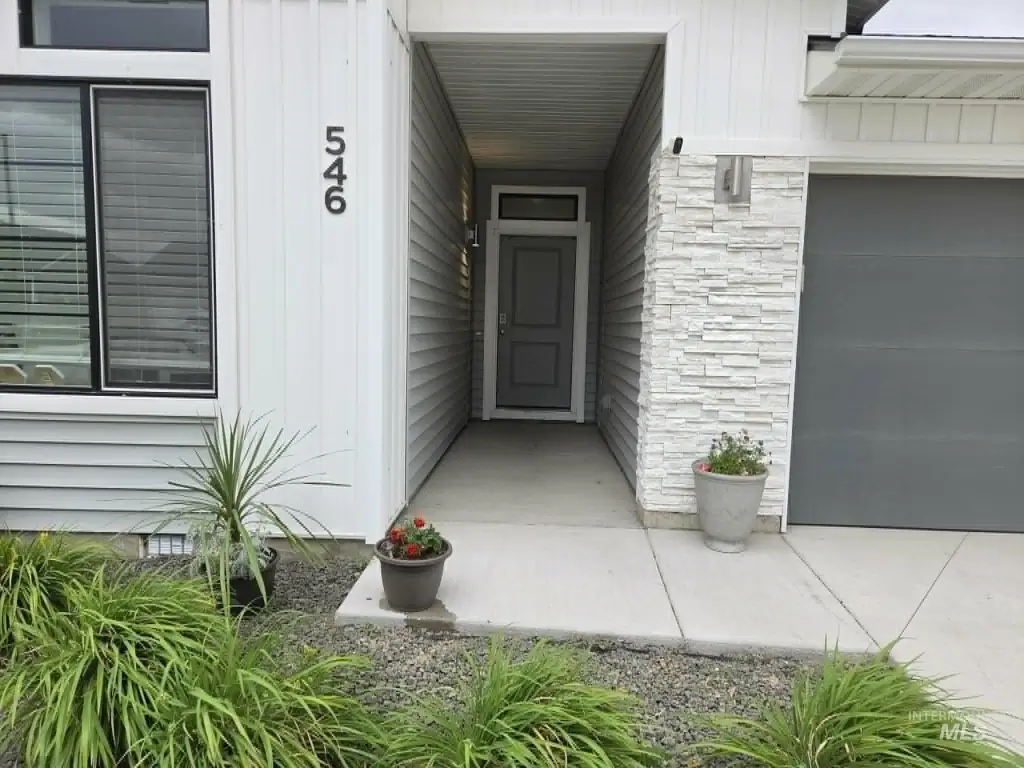
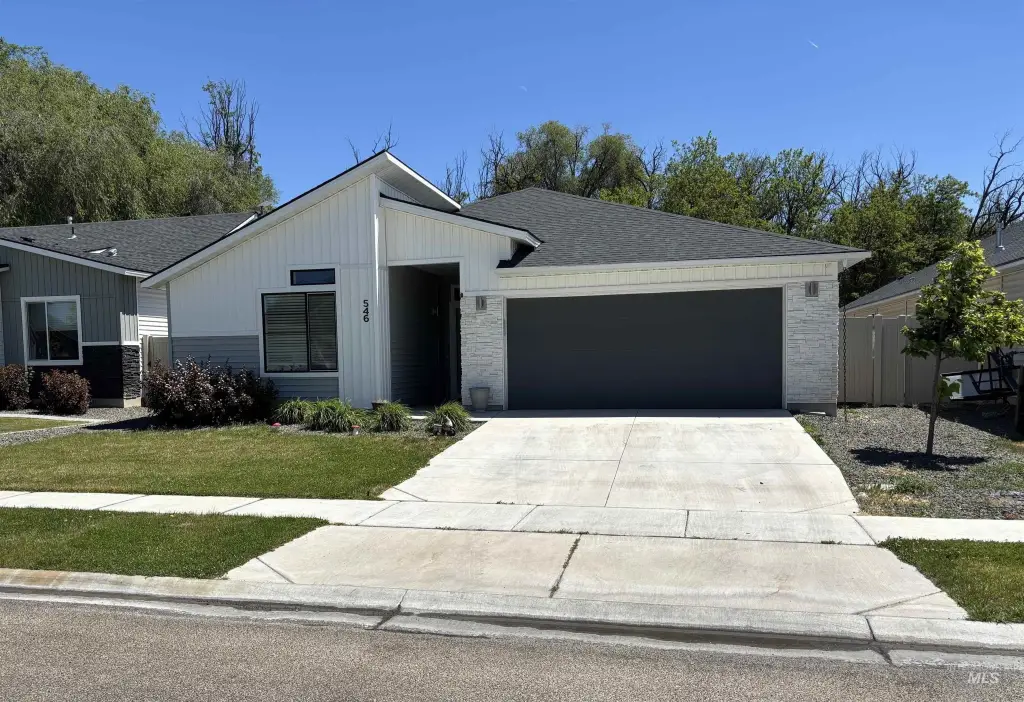
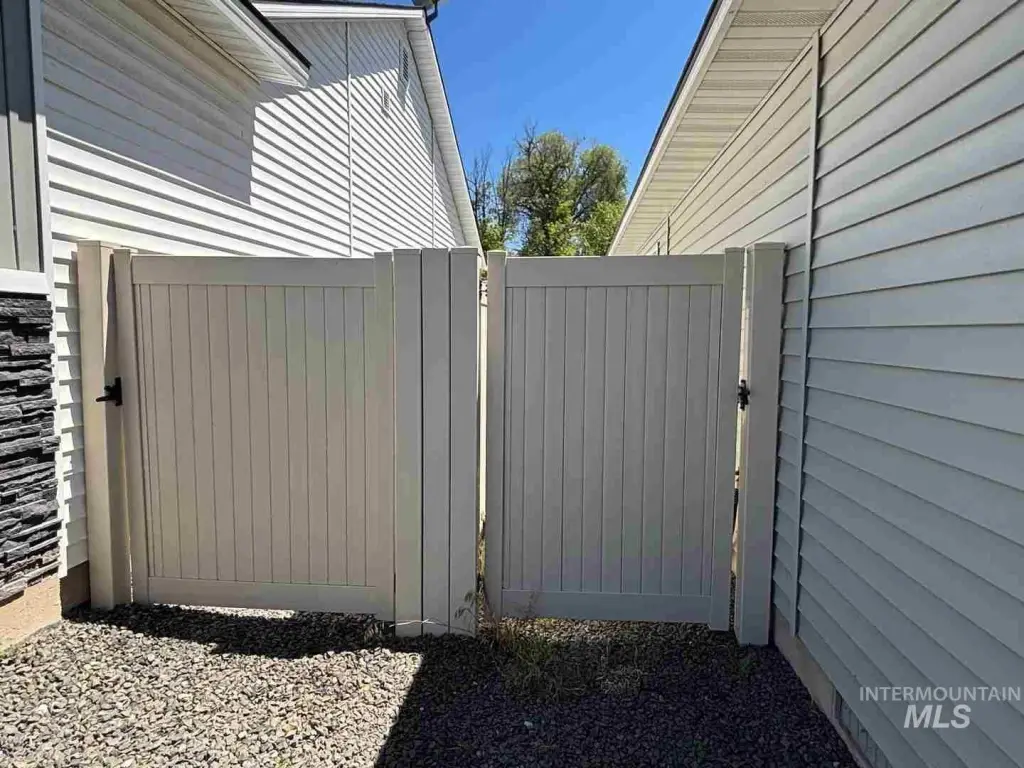
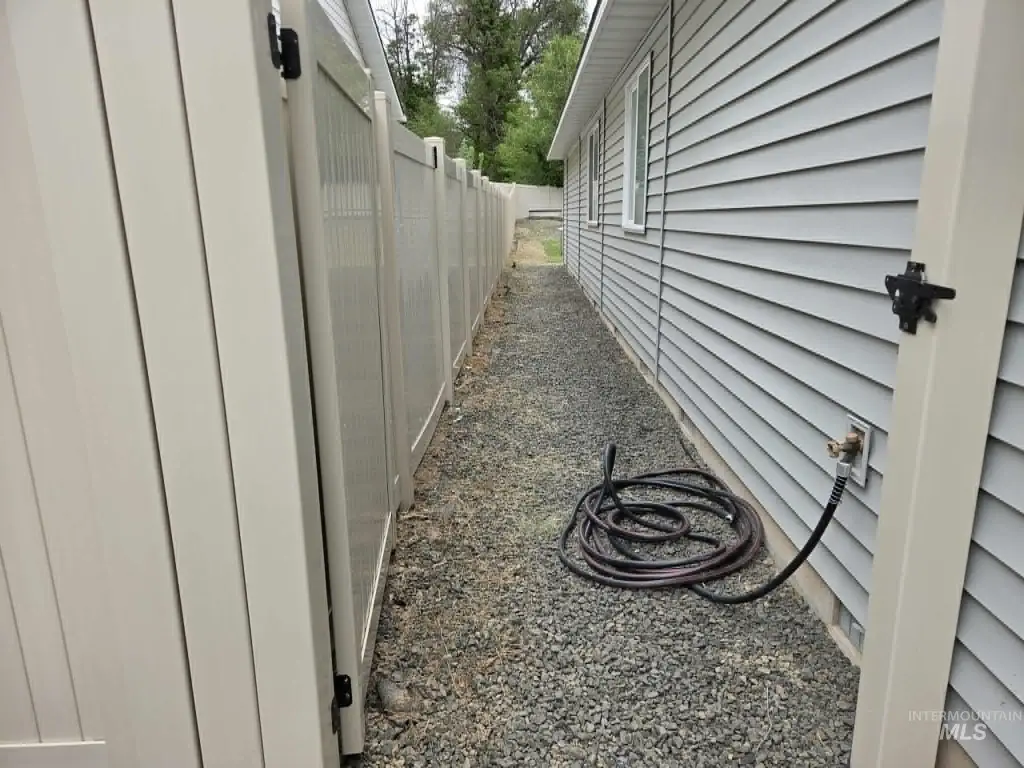
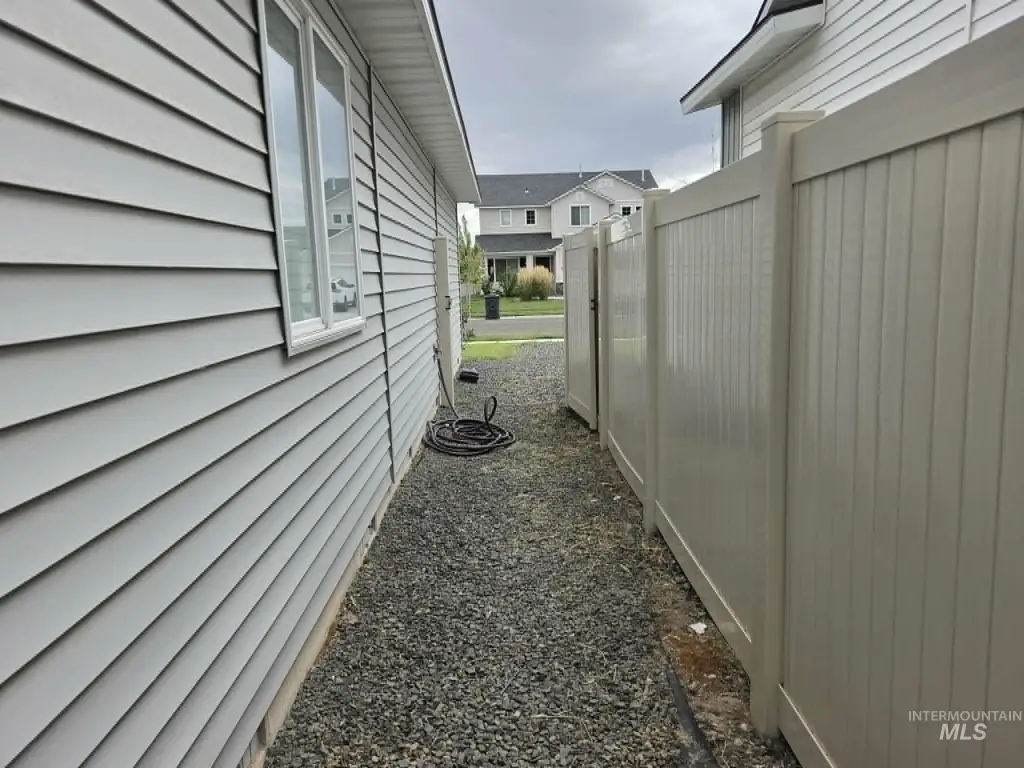
The property is located at 546 S Bangor Way in Nampa, Idaho. Because the home is tenant-occupied, there is no For Sale sign present. Prospective buyers can show the exterior by driving by and walking on the sidewalk, with interior showings scheduled after an offer is accepted.
For investors or buyers seeking an already-leased residential income asset, this property provides an in-place occupancy timeline through April 30, 2027. The interior photos were provided by property management and were taken in 2023 when the home was new and vacant, offering a reference point for the condition at that time.
The property is located at 546 S Bangor Way in Nampa, Idaho. Because the home is tenant-occupied, there is no For Sale sign present. Prospective buyers can show the exterior by driving by and walking on the sidewalk, with interior showings scheduled after an offer is accepted.
For investors or buyers seeking an already-leased residential income asset, this property provides an in-place occupancy timeline through April 30, 2027. The interior photos were provided by property management and were taken in 2023 when the home was new and vacant, offering a reference point for the condition at that time.
Key Highlights
- Single‑level 4‑bedroom, 2‑bath income property built in 2022
- Lease in place through April 30, 2027
- 2‑car garage plus driveway parking
Financial Insights
Estimated NOI and Cap Rate
NOI / Yr
$19,778
Cap Rate
4.77%
Suggested Prices Based on Cap Rates
Cap Rate 5%
$395,560
$395.6K
Cap Rate 7%
$282,543
$282.5K
Cap Rate 9%
$219,756
$219.8K
Market Conditions
NOI Build-Up for 2,007 SF
Gross rent
$38.1K $18.96/SF
− Vacancy
−$2.1K −$1.04/SF
EGI
$36.0K $17.92/SF
− OpEx
−$16.2K −$8.06/SF
NOI
$19.8K $9.85/SF
Area
Nampa, ID
Vacancy
5.50%
Lease Rate
$18.96 /SF/Yr
Expense Ratio
45.00%
Simulate Cap Rate and NOI
Suggested Prices Based on Cap Rates
Cap Rate 5%
$395,560
Cap Rate 7%
$282,543
Cap Rate 9%
$219,756
Alternative Uses
Best Use
Apartment 5plus
$282.5K
$247.2K – $329.6K
NOI $19,778 @ 7.0% cap · market cap 4.77%
Second Best
—
—
no second resolved use
Theoretical Best
Office A
$507.7K
$444.2K – $592.3K
NOI $35,538 @ 7.0% cap · market cap 8.56%
Zoning and permitted uses should be independently verified with authorities.
How Realmo checks its estimates
Property Analytics
Unlock full access to Insights
Subscribe to Realmo Intelligence
Open Analytics
Location Intelligence
Trade Area within ½ mile
103
Businesses Nearby
Explore this area
Business Placement
Demographics for 83687, ID
37,254
Population
14,484
Households
2.6
Avg Household Size
33
Median Age
27%
College-Educated
91%
High-School Grad
49.4 sq mi
ZIP Area
754
Density / Sq Mi
$72,294
Median Household Income
$40,328
Median Earnings
$1,416
Median Rent
$369,700
Median Home Value
Check the figures for this property
Cap Rate, Value Estimation, Potential NOI and more
View Realmo Analytics








Frequently Asked Questions
What type of property is this?
Single family property - Lease-in-place income property with four bedrooms, two bathrooms, and a two-car garage through April 30, 2027.
Where is this single family property located?
The property is located at 546 S Bangor Way Nampa, ID.
What is the asking price?
The asking price for this property is $415,000.
What are key features of this property?
This property features: Single‑level 4‑bedroom, 2‑bath income property built in 2022; Lease in place through April 30, 2027; 2‑car garage plus driveway parking