Pre-Construction Duplex with Two
For Sale
$530,000
5263 Centennial Blvd, Lehigh Acres, FL 33971
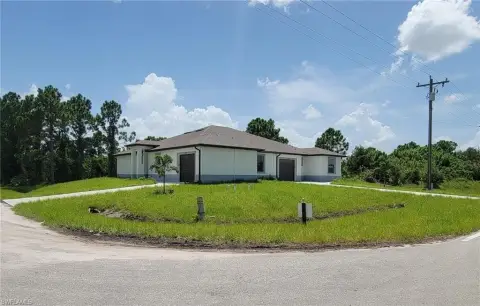
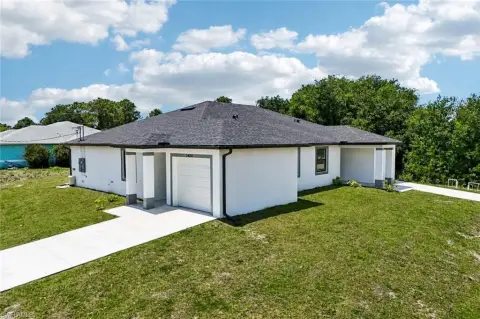
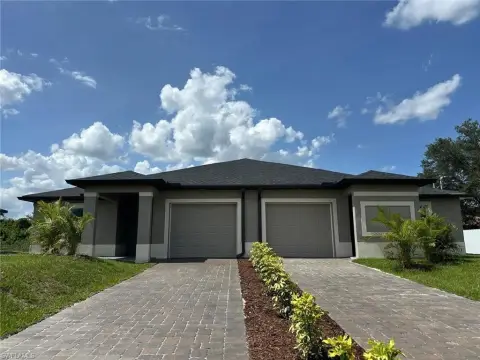
Each residence offers two bedrooms, two bathrooms, and a den suitable for flexible use.
Property Size2,386 SF
Price / SF$222.13
Days on Market184
Property Features for 5263 Centennial Blvd
General Information
Standard status
Active
Size
2,386 SF
Property subtype
Multi-Family
Units
Unit Mix
2 x 2BR/2BA+den
Multifamily Units
2
Building Details
Year Built
2026
Buildings
1
Listing Agency:
Rossman Realty Group Inc
Listed By:
Maria Cruz · License #258008890
(239) 895-4179
Source:
Napleshomesearches
Added: Apr 13
Changed: Oct 1
Last Checked: Oct 12 at 7:52PM
Displayed information is deemed reliable but is not guaranteed and should be independently verified. All listing content including descriptions, pricing, images are the copyrighted material of Rossman Realty Group Inc
Investment Insights
Based on property information with market context.
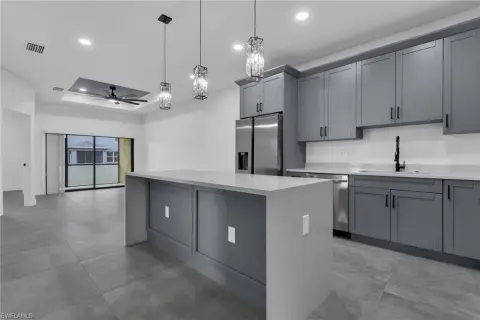
This pre-construction duplex is planned with 2,386 square feet and two matching residences. Each side includes two bedrooms, two bathrooms, and a den that can function as office or additional room space. The design includes porcelain flooring, quartz countertops, impact windows, and high doors. The property is identified with a 2026 year built.
The duplex is located near schools and I-75, with Lee Blvd approximately one minute away. Its two-residence configuration supports use as a primary home or an investment property, as described for the asset.
The duplex is located near schools and I-75, with Lee Blvd approximately one minute away. Its two-residence configuration supports use as a primary home or an investment property, as described for the asset.
Key Highlights
- Two‑residence duplex with 2,386 square feet
- Each side includes 2 bedrooms, 2 bathrooms, and a den
- Planned porcelain flooring and quartz countertops
Financial Insights
Estimated NOI and Cap Rate
NOI / Yr
$31,582
Cap Rate
5.96%
Suggested Prices Based on Cap Rates
Cap Rate 5%
$631,640
$631.6K
Cap Rate 7%
$451,171
$451.2K
Cap Rate 9%
$350,911
$350.9K
Market Conditions
NOI Build-Up for 2,386 SF
Gross rent
$47.2K $19.80/SF
− Vacancy
−$2.1K −$0.89/SF
EGI
$45.1K $18.91/SF
− OpEx
−$13.5K −$5.67/SF
NOI
$31.6K $13.24/SF
Area
Lee County, FL
Vacancy
4.50%
Lease Rate
$19.80 /SF/Yr
Expense Ratio
30.00%
Simulate Cap Rate and NOI
Suggested Prices Based on Cap Rates
Cap Rate 5%
$631,640
Cap Rate 7%
$451,171
Cap Rate 9%
$350,911
Alternative Uses
Best Use
Multifamily LT 5
$451.2K
$394.8K – $526.4K
NOI $31,582 @ 7.0% cap · market cap 5.96%
Second Best
Apartment 5plus
$418.1K
$365.8K – $487.8K
NOI $29,267 @ 7.0% cap · market cap 5.52%
Theoretical Best
Office A
$751.0K
$657.1K – $876.1K
NOI $52,568 @ 7.0% cap · market cap 9.92%
Zoning and permitted uses should be independently verified with authorities.
How Realmo checks its estimates
Property Analytics
Unlock full access to Insights
Subscribe to Realmo Intelligence
Open Analytics
Current Use
Lease Details
2
Residential units
Location Intelligence
Trade Area within ½ mile
75
Businesses Nearby
Explore this area
Business Placement
Demographics for 33971, FL
26,333
Population
8,802
Households
3
Avg Household Size
33
Median Age
15%
College-Educated
85%
High-School Grad
17.0 sq mi
ZIP Area
1,549
Density / Sq Mi
$72,784
Median Household Income
$38,898
Median Earnings
$1,678
Median Rent
$271,900
Median Home Value
Check the figures for this property
Cap Rate, Value Estimation, Potential NOI and more
View Realmo Analytics
Market
Vacancy Rate% for Multifamily in South region

Questions? Ask Rey
Realmo’s AI knows this listing — price, zoning, demand, history. Ask anything.








Frequently Asked Questions
What type of property is this?
Duplex - Each residence offers two bedrooms, two bathrooms, and a den suitable for flexible use.
Where is this duplex located?
The property is located at 5263 Centennial Blvd Lehigh Acres, FL.
What is the asking price?
The asking price for this property is $530,000.
What are key features of this property?
This property features: Two‑residence duplex with 2,386 square feet; Each side includes 2 bedrooms, 2 bathrooms, and a den; Planned porcelain flooring and quartz countertops


