Remodeled Half-Duplex with
For Sale
$294,900
524 PIGEON CIR, Orlando, FL 32825
Residential, ORLANDO, FL
Property Size1,277 SF
Lot Size0.09 Acres
Price / SF$230.93
Days on Market51
Property Features for 524 PIGEON CIR
General Information
Property type
Residential Multi Family
Property subtype
Duplex
Zoning
R-2
Bedrooms
3
Bathrooms
2
Full bathrooms
2
Rooms
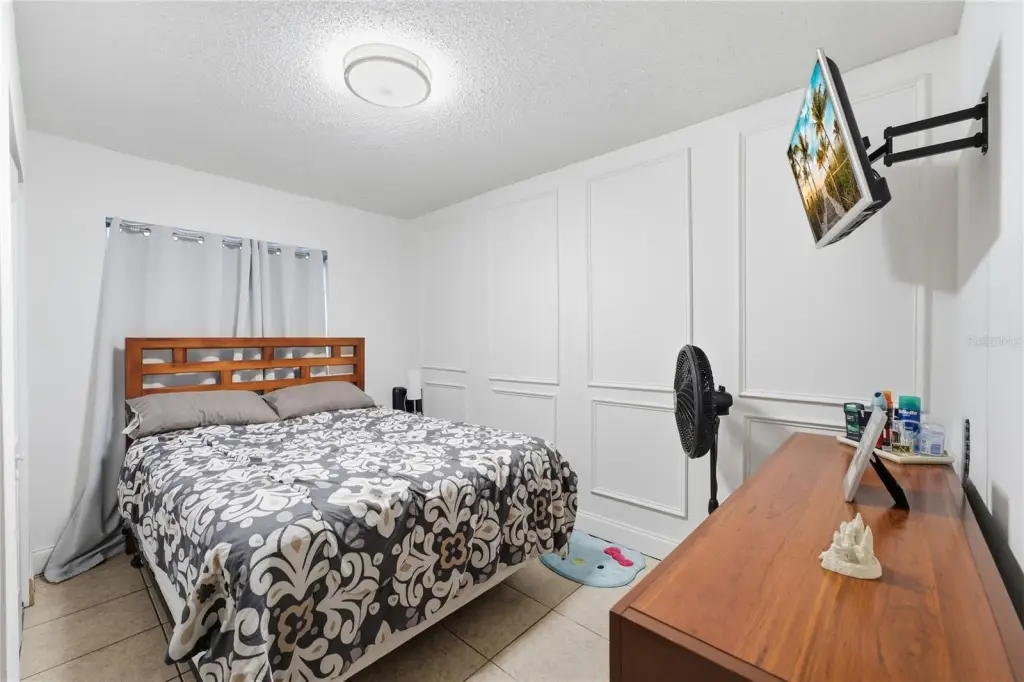
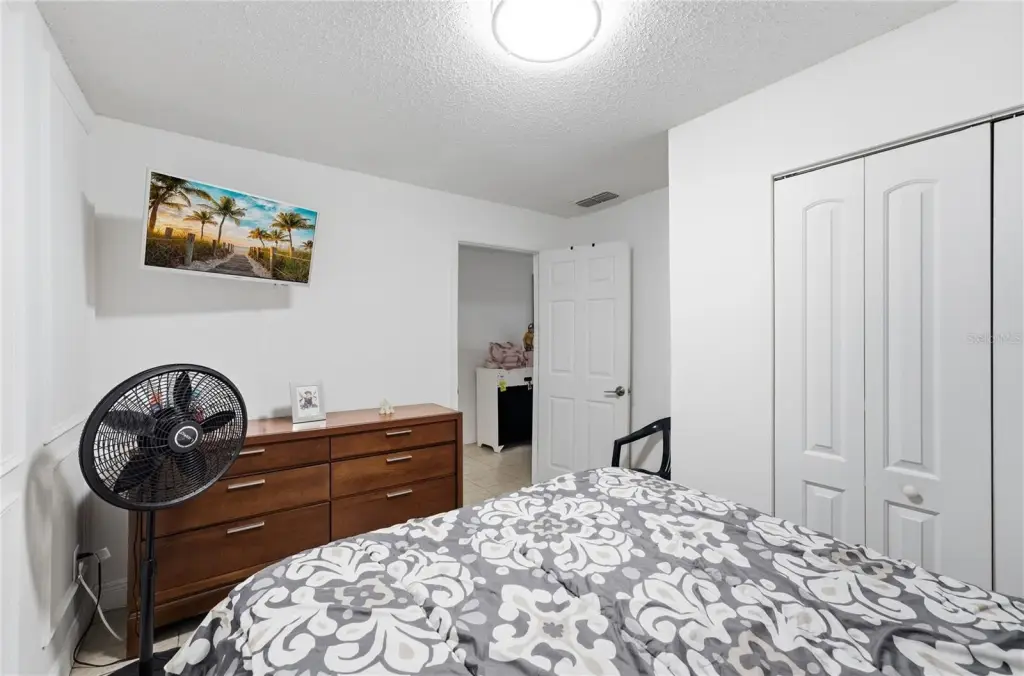
Bathroom 1, Bedroom 2, Bedroom 1, Bathroom 2, Bedroom 3
Patio and Porch features
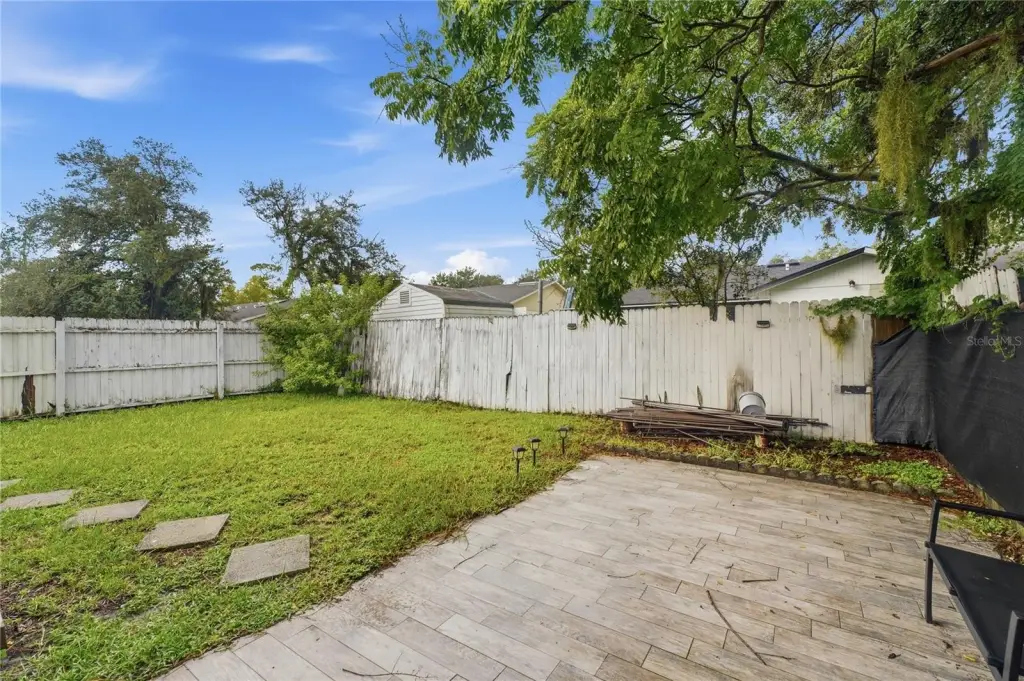
Patio
Interior features
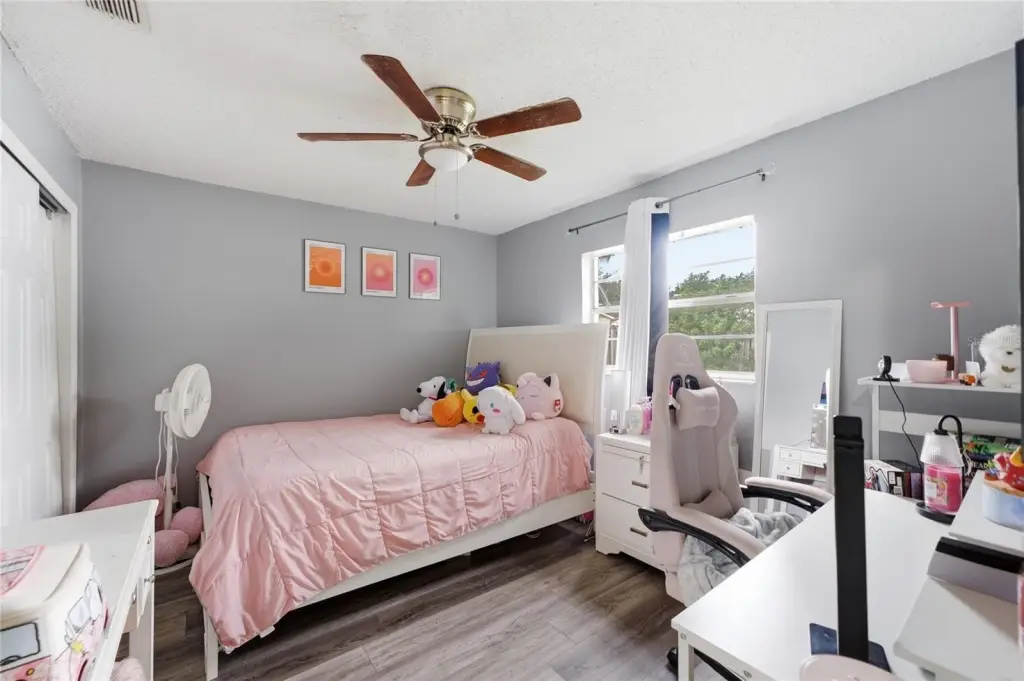
Ceiling Fans(s)
Exterior features
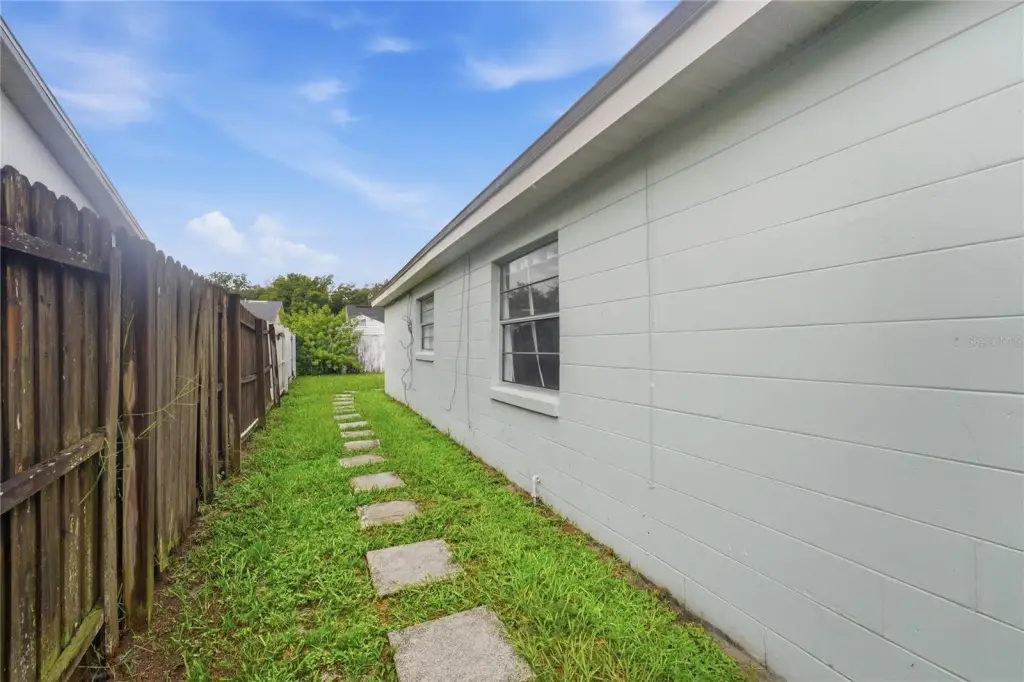
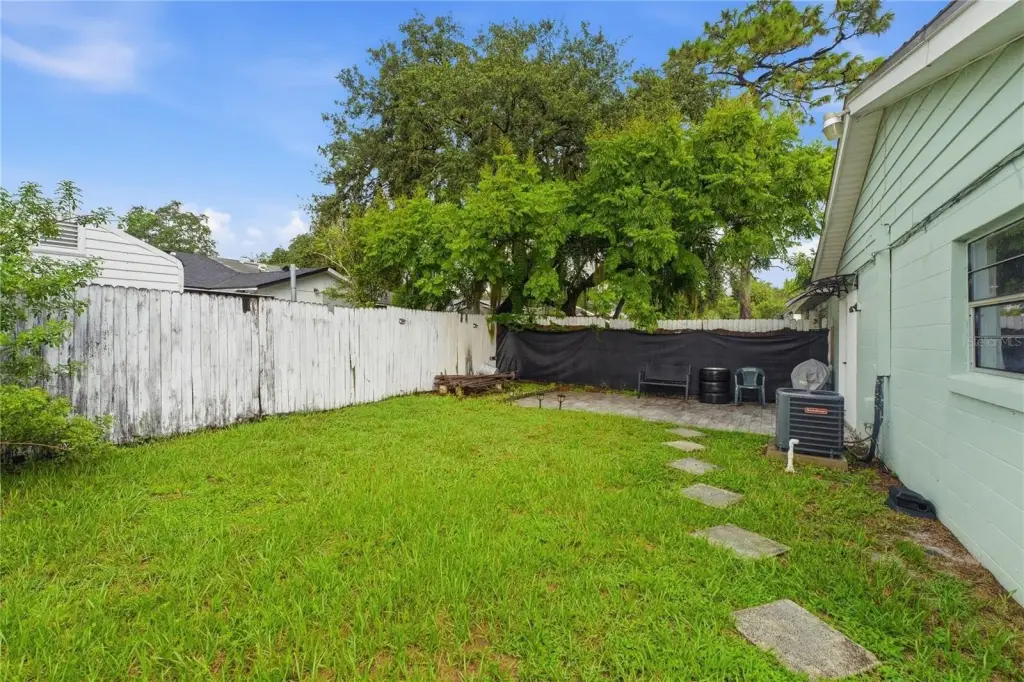
Private Yard
Fencing
Fenced
Appliances
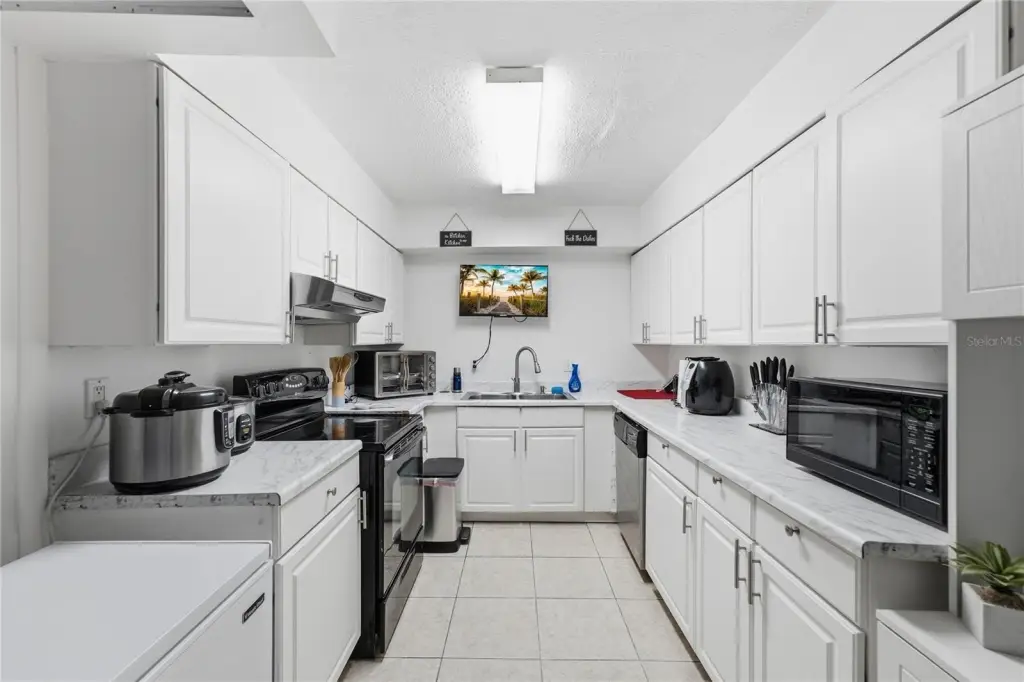
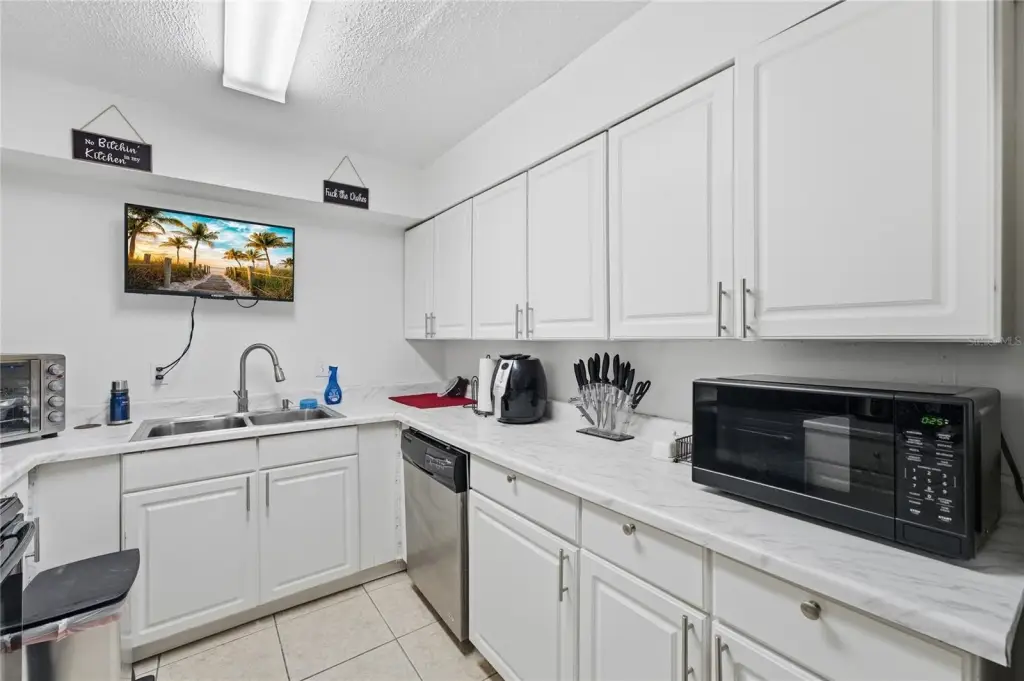
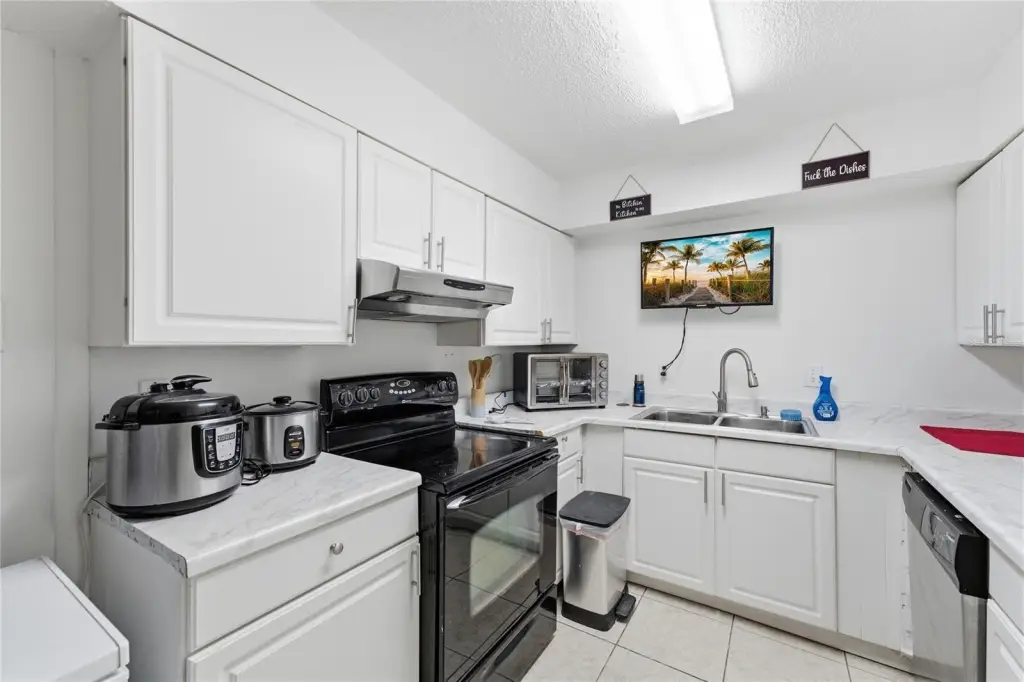
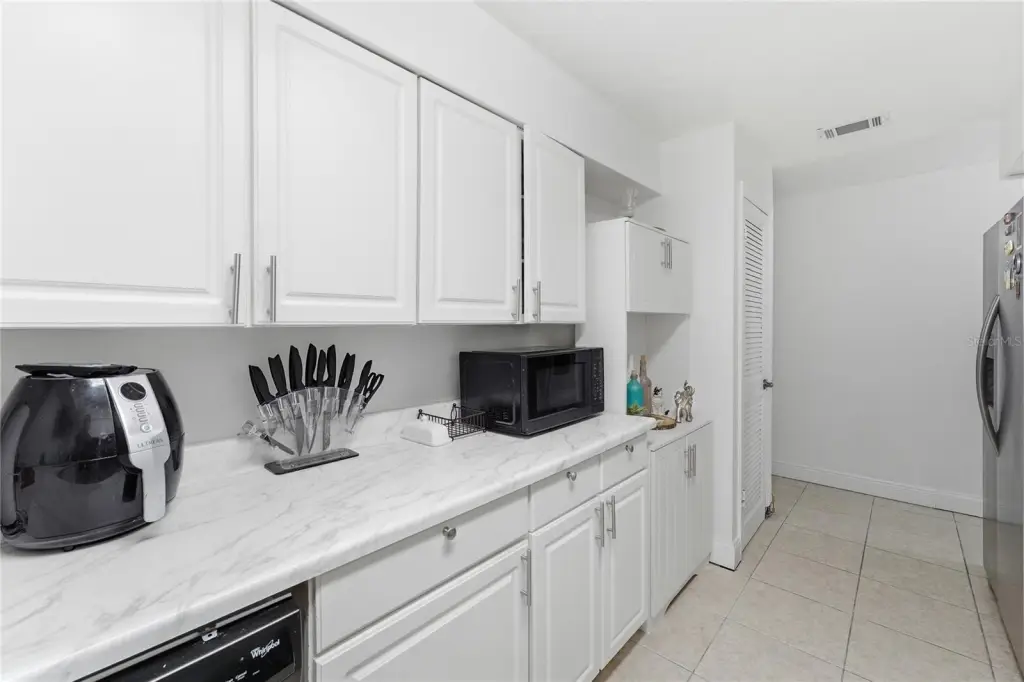
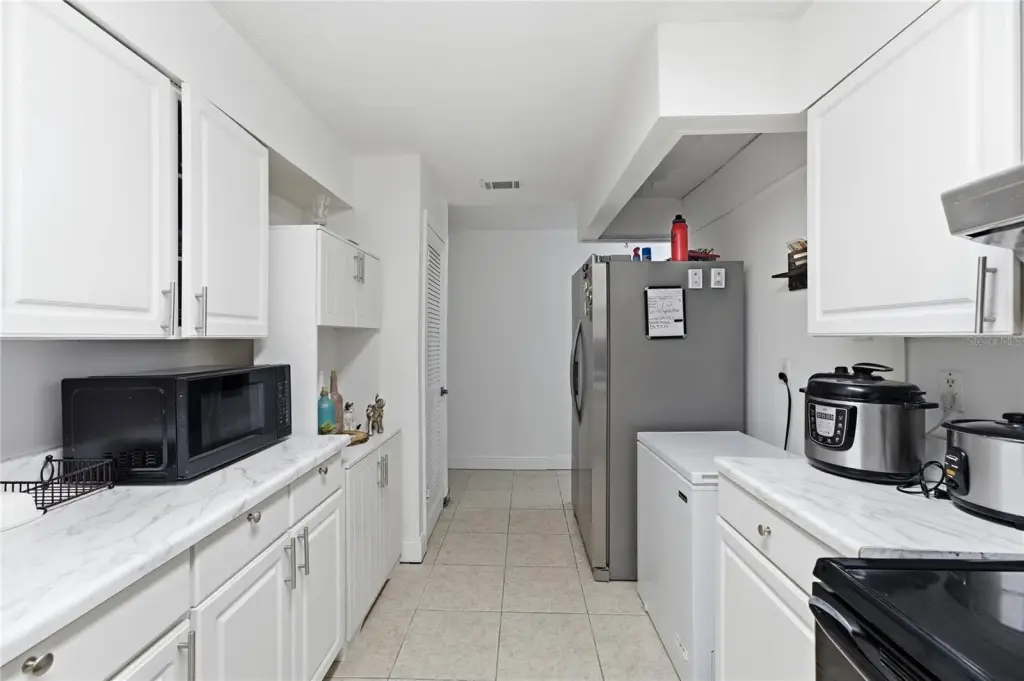
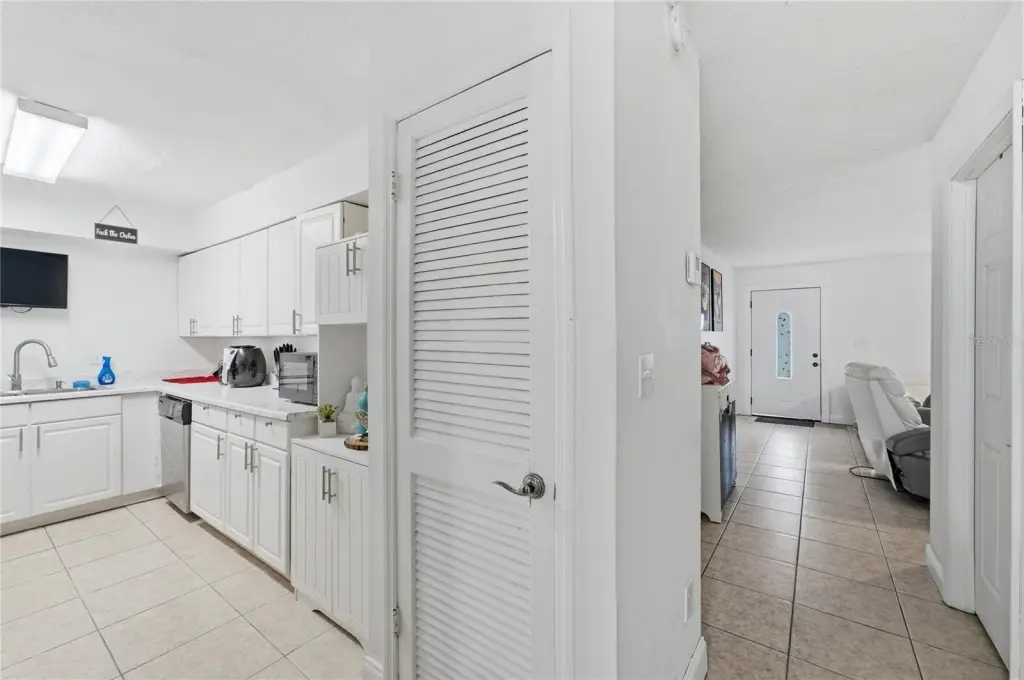
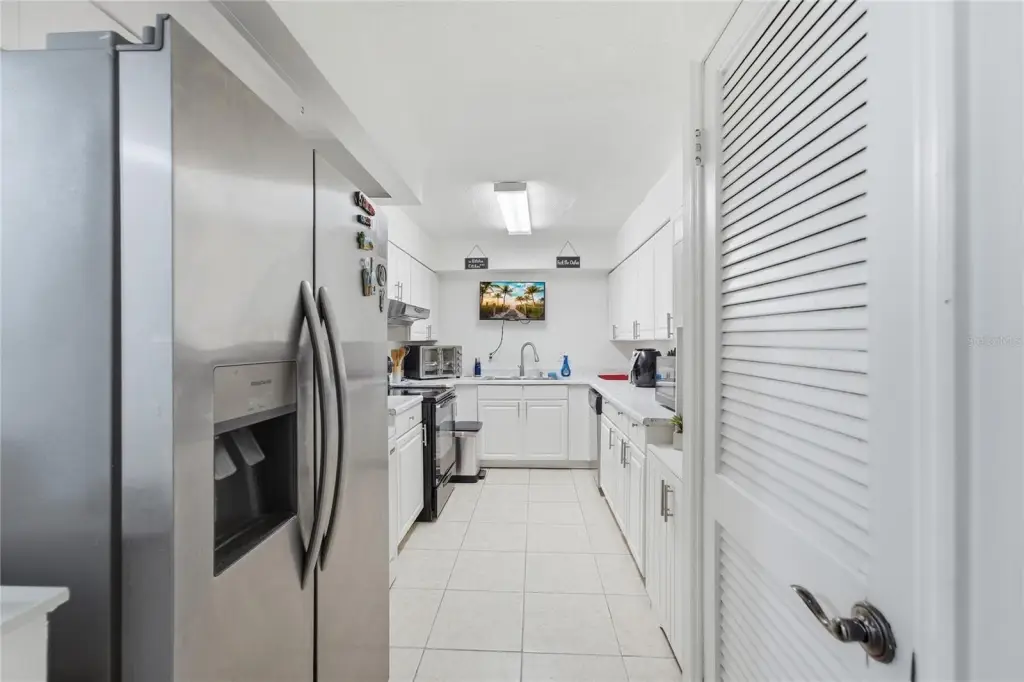
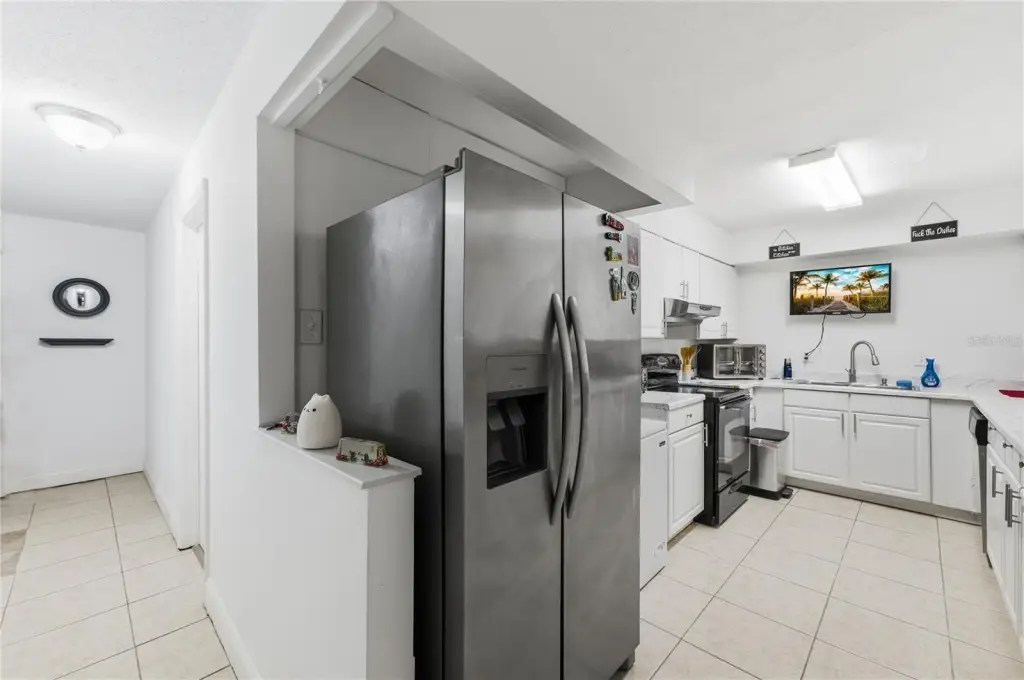
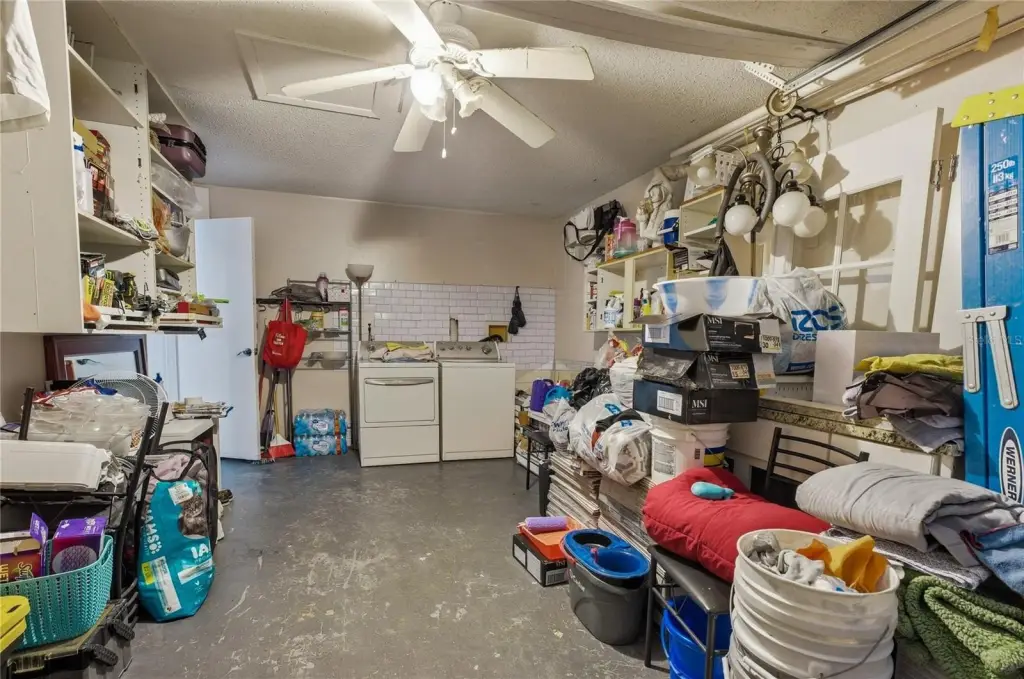
Dishwasher, Dryer, Electric Water Heater, Range, Range Hood, Refrigerator, Washer
Subdivision
QUAIL HOLLOW AT RIO PINAR
Elementary school
Deerwood Elem (Orange Cty)
Middle school
Liberty Middle
High school
Colonial High
Directions
From FL-408 E, take Exit 17 toward Chickasaw Trail. Head south on Chickasaw Trail, turn left onto Lake Underhill Rd, then turn right onto Pigeon Circle. Continue to 524 Pigeon Circle.
Standard status
Active
APN
30-22-35-7271-08-161
Size
1,277 SF
Lot size
0.09 Acres
Taxes and HOA fees
Tax Year
2025
Tax Description
QUAIL HOLLOW AT RIO PINAR 5/1 THE S 1/2OF LOT 16 BLK H
Tax Annual Amount
4515
Legal Description
QUAIL HOLLOW AT RIO PINAR 5/1 THE S 1/2OF LOT 16 BLK H
Utilities
Sewer type
Public Sewer
Heating system
Electric (Heating)
Cooling system
Central Air
Water source
Public
Building Details
Year built
1975
Floors in Building
1
Flooring type
Vinyl, Tile - Ceramic
Building materials
Block
Roof type
Shingle
Listing Agency:
LPT REALTY, LLC
(877) 366-2213
Listed By:
Annie Gutierrez
(786) 720-1598
Added: Aug 29
Changed: Oct 16
Last Checked: Oct 18 at 9:06PM
MLS# S5156595
Copyright © 2026 Stellar MLS. All rights reserved. All information provided by the listing agent/broker is deemed reliable but is not guaranteed and should be independently verified.

Ask AI about this property
Review the available facts, identify missing information and prepare questions for the agent.
Investment Insights
Based on property information with market context.
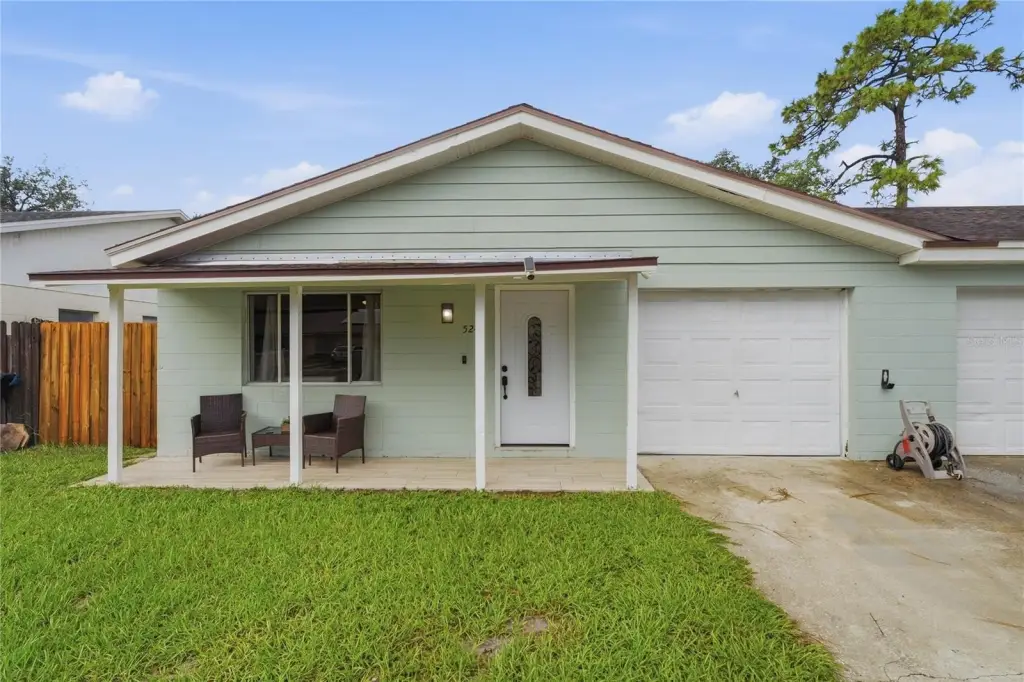
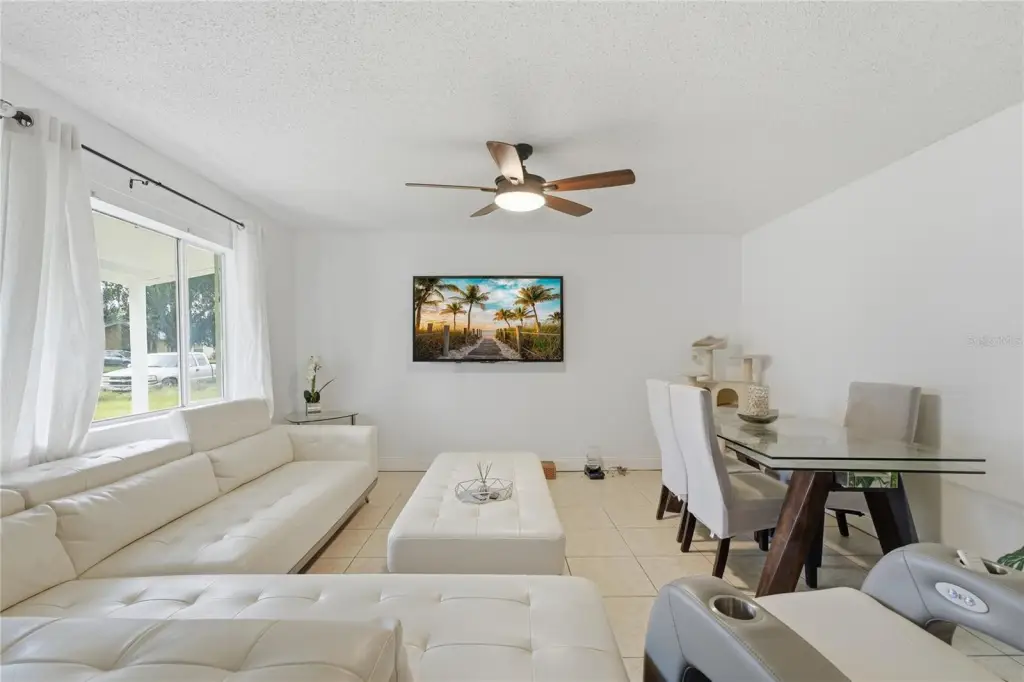
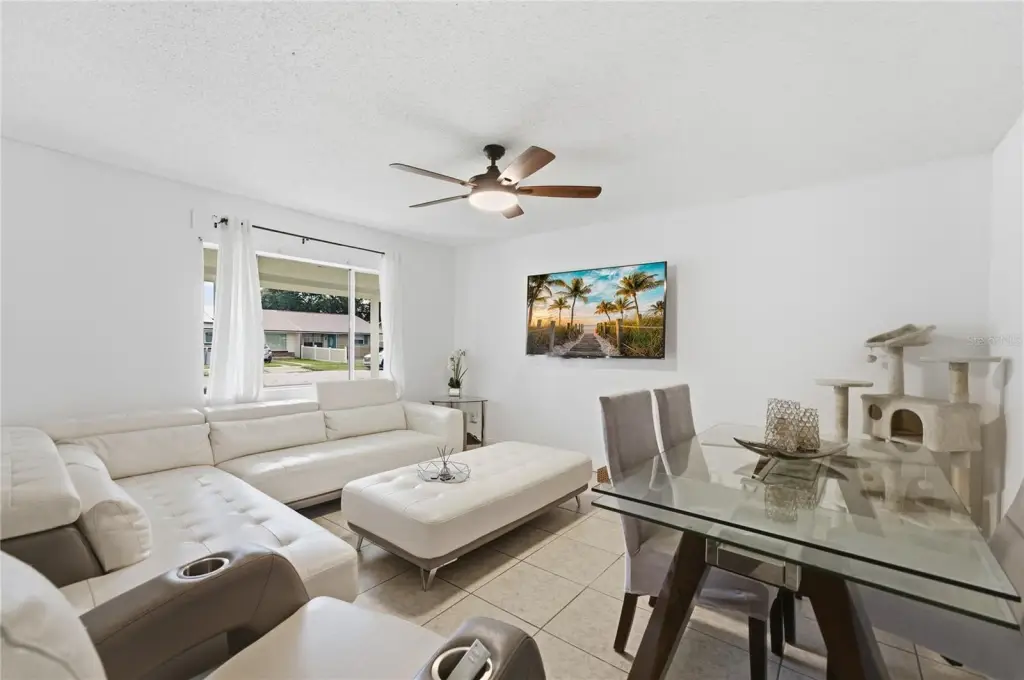
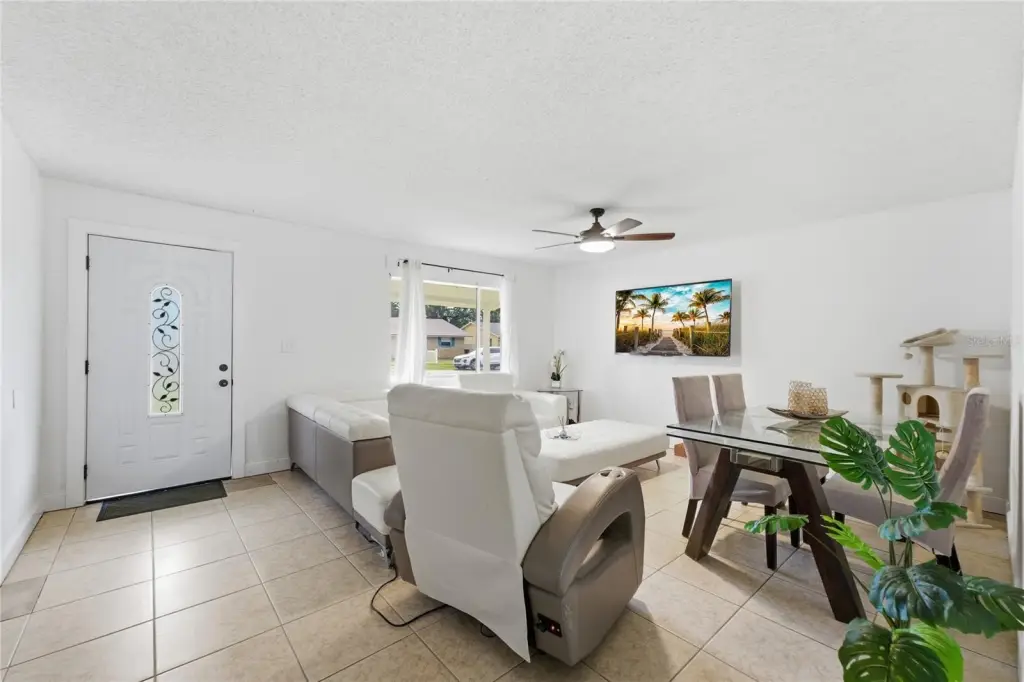
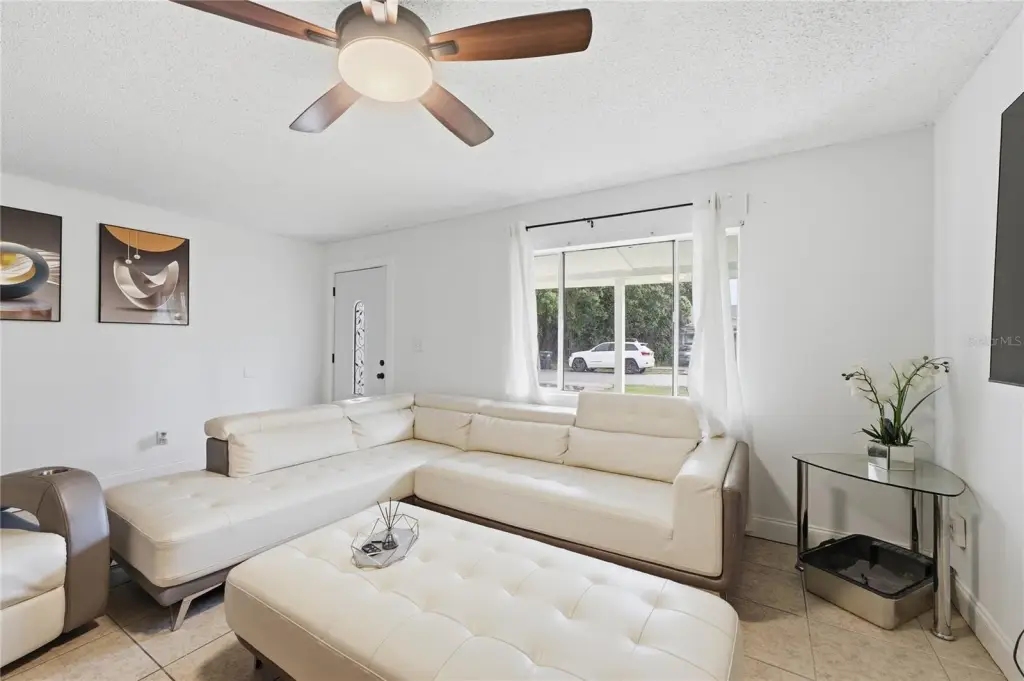
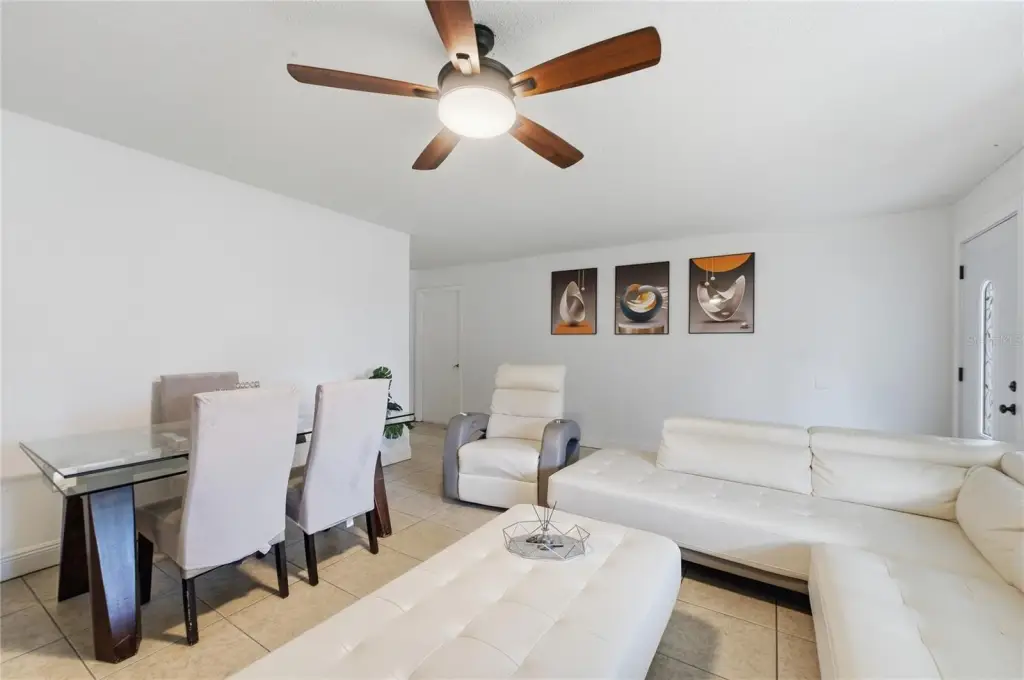
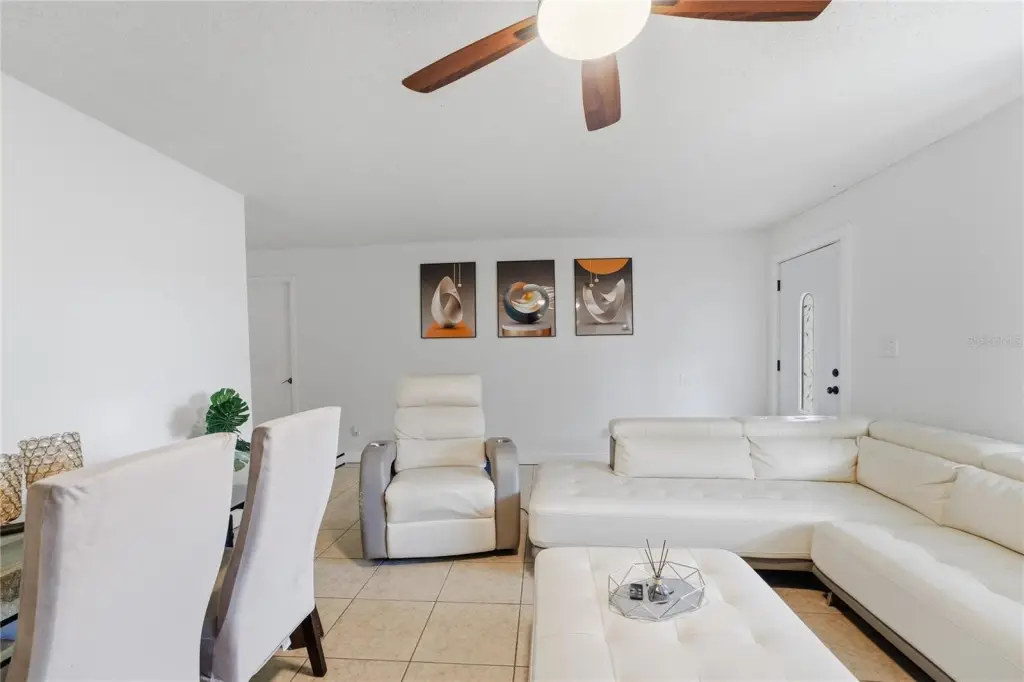
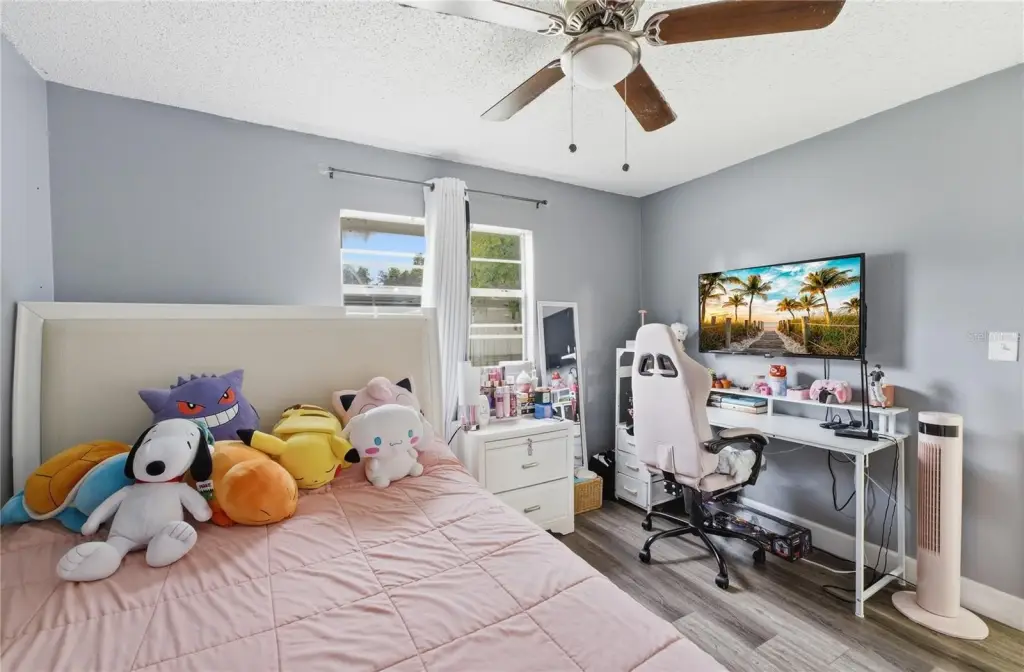
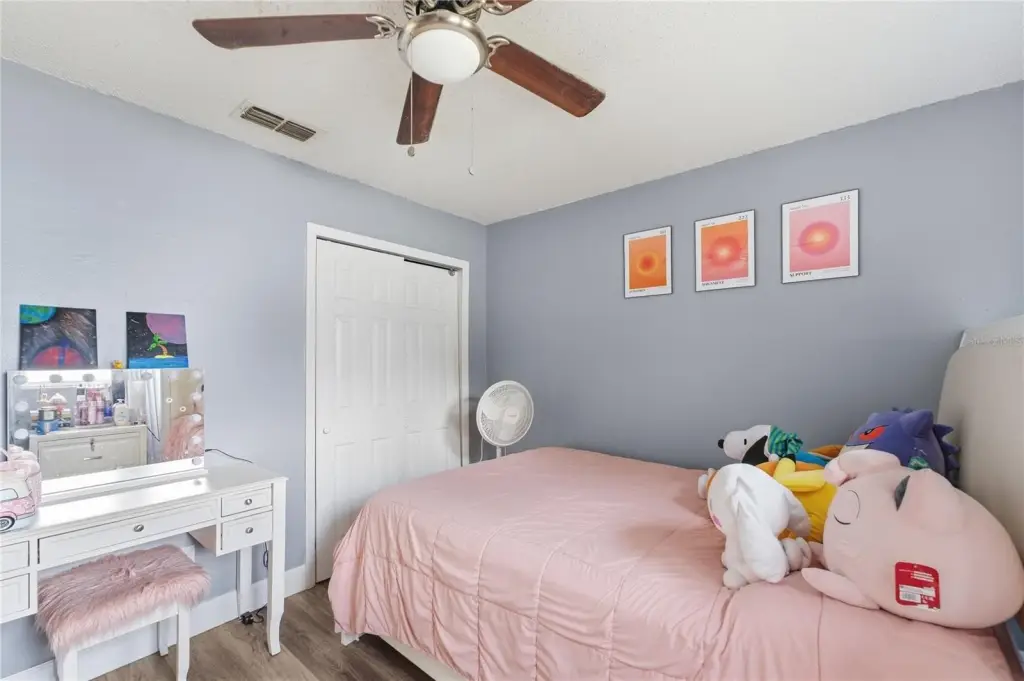
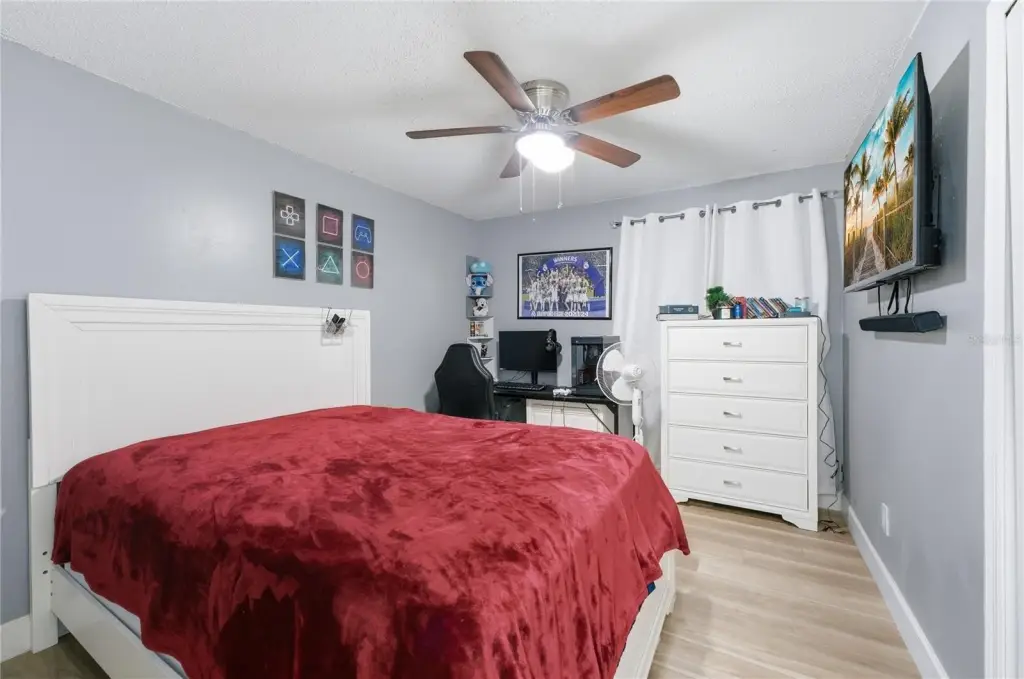
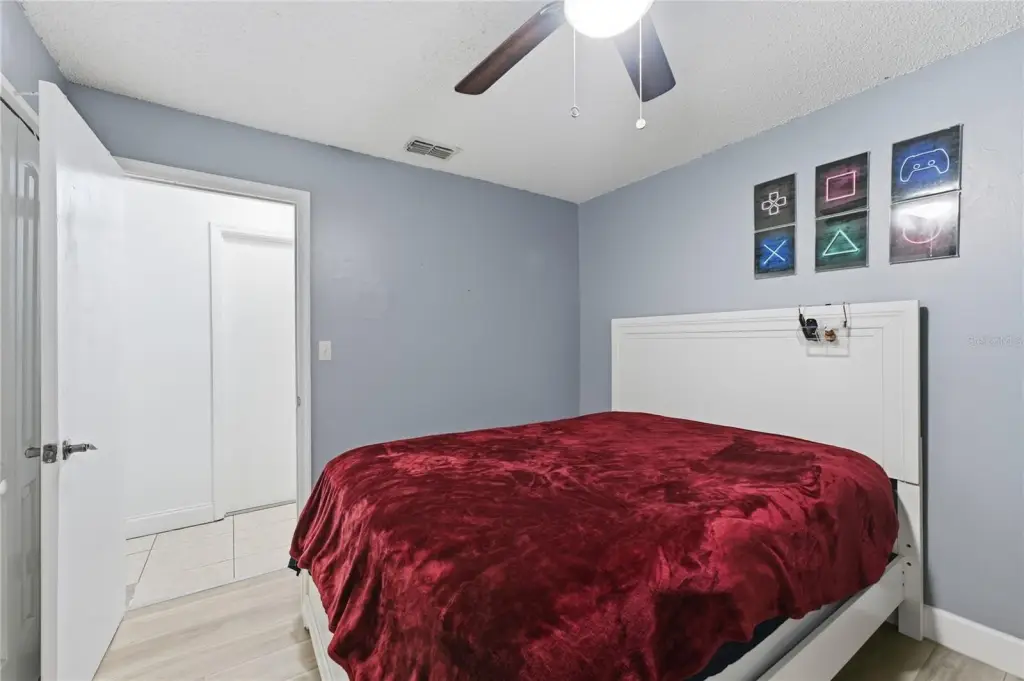
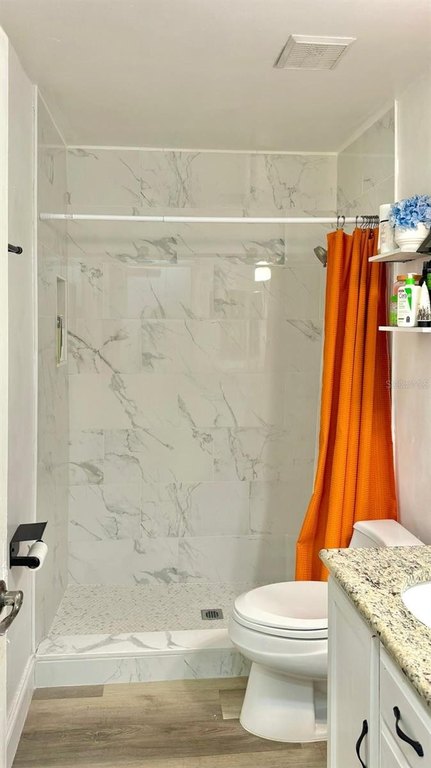
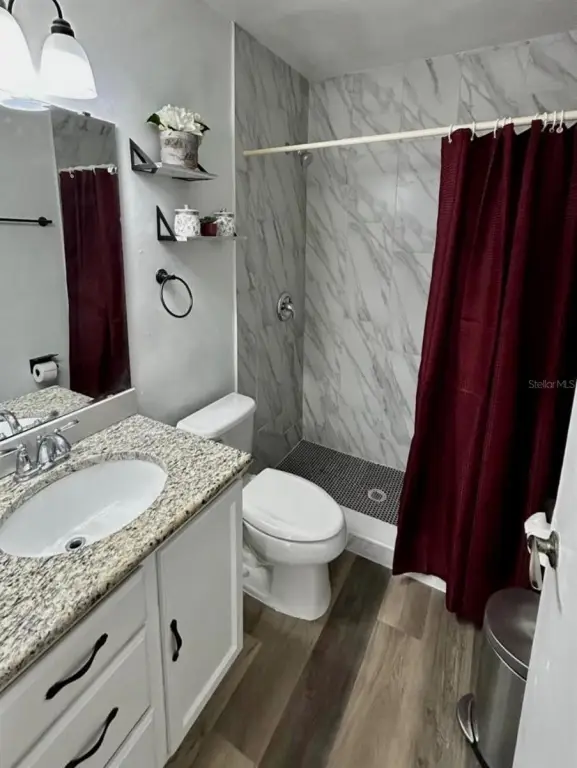
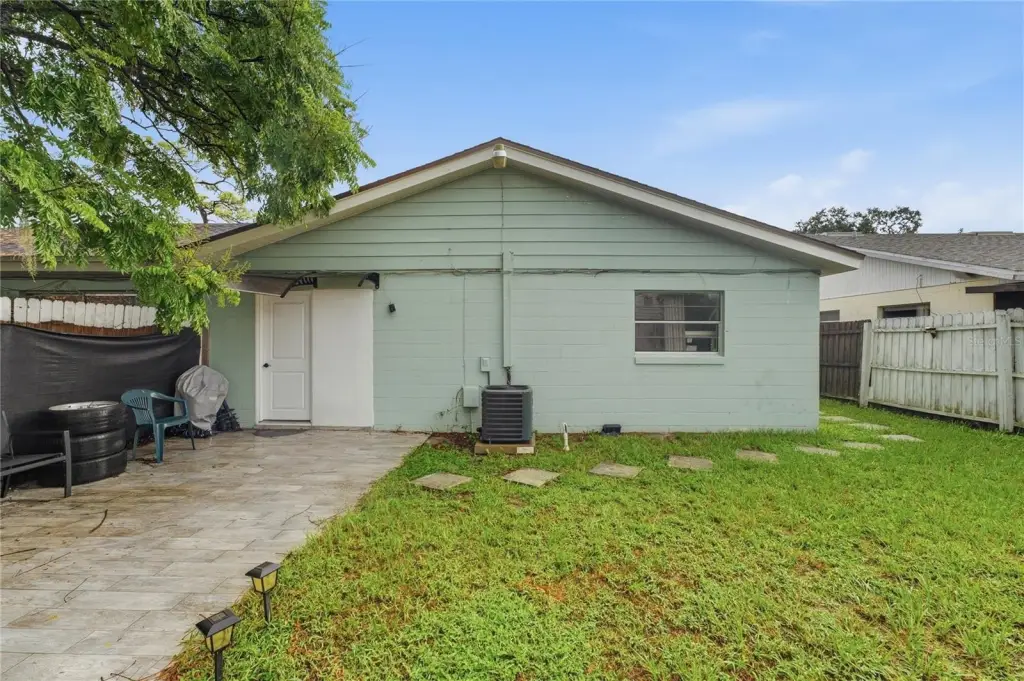
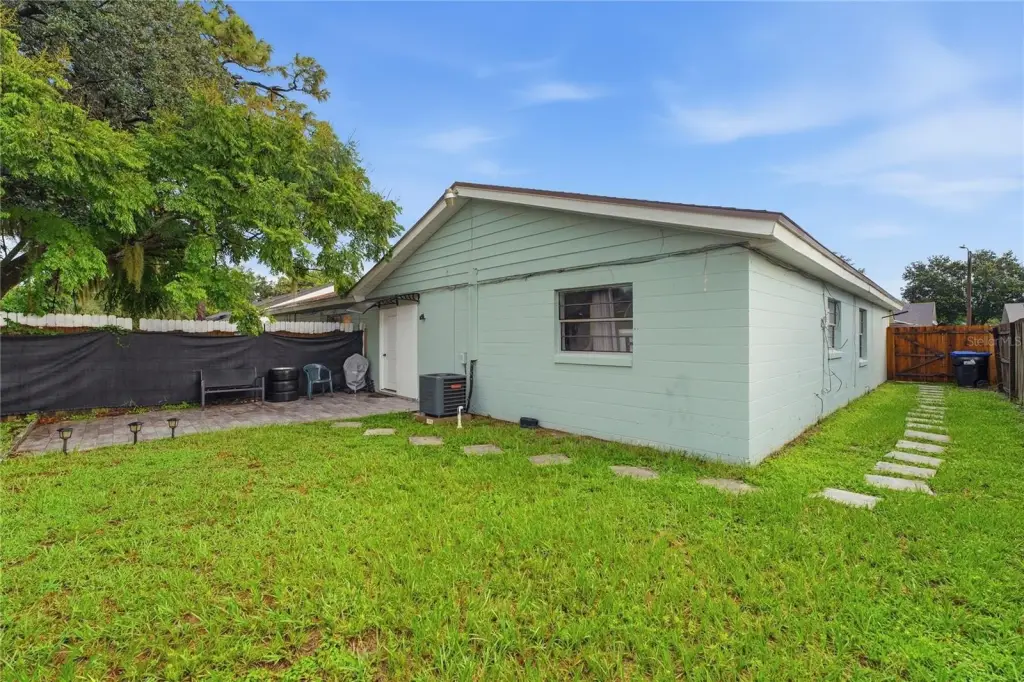
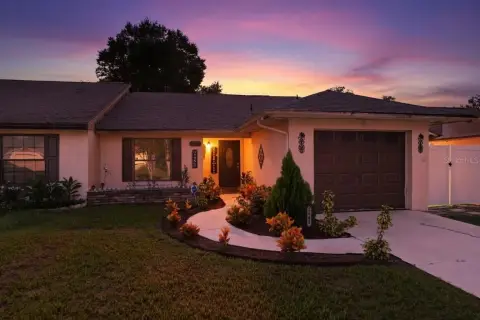
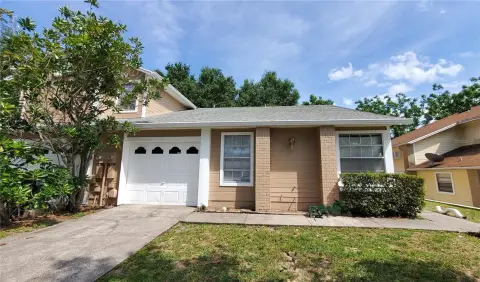
This 1,277-square-foot half-duplex, built in 1975, includes three bedrooms and two bathrooms. Recent improvements include remodeled bathrooms, a 2026 A/C system, a 2025 roof, and a 2025 water heater. One bedroom has a private bathroom and a separate exterior entrance. The home also features vinyl and ceramic tile flooring, ceiling fans, a patio, and a fully fenced backyard on a 0.09-acre lot.
The property is zoned R-2 and served by public water and public sewer. Restaurants, Publix, a fitness center, a hospital, and other services are located less than a mile away. The residence also offers access to major Orlando highways and is minutes from Orlando International Airport and Downtown Orlando. Block construction, a shingle roof, central air, electric heating, and included appliances add to the existing property features.
The property is zoned R-2 and served by public water and public sewer. Restaurants, Publix, a fitness center, a hospital, and other services are located less than a mile away. The residence also offers access to major Orlando highways and is minutes from Orlando International Airport and Downtown Orlando. Block construction, a shingle roof, central air, electric heating, and included appliances add to the existing property features.
Key Highlights
- 1,277‑square‑foot half‑duplex with 3 bedrooms and 2 bathrooms
- Remodeled bathrooms plus a 2026 A/C, 2025 roof, and 2025 water heater
- Bedroom with private bathroom and separate exterior entrance
Financial Insights
Estimated NOI and Cap Rate
NOI / Yr
$14,780
Cap Rate
5.01%
Suggested Prices Based on Cap Rates
Cap Rate 5%
$295,600
$295.6K
Cap Rate 7%
$211,143
$211.1K
Cap Rate 9%
$164,222
$164.2K
Market Conditions
NOI Build-Up for 1,277 SF
Gross rent
$22.5K $17.64/SF
− Vacancy
−$1.4K −$1.11/SF
EGI
$21.1K $16.53/SF
− OpEx
−$6.3K −$4.96/SF
NOI
$14.8K $11.57/SF
Area
ZIP 32825
Vacancy
6.27%
Lease Rate
$17.64 /SF/Yr
Expense Ratio
30.00%
Simulate Cap Rate and NOI
Suggested Prices Based on Cap Rates
Cap Rate 5%
$295,600
Cap Rate 7%
$211,143
Cap Rate 9%
$164,222
Alternative Uses
Best Use
Multifamily LT 5
$211.1K
$184.8K – $246.3K
NOI $14,780 @ 7.0% cap · market cap 5.01%
Second Best
Apartment 5plus
$199.0K
$174.2K – $232.2K
NOI $13,933 @ 7.0% cap · market cap 4.72%
Theoretical Best
Specialty Retail
$375.1K
$328.2K – $437.6K
NOI $26,256 @ 7.0% cap · market cap 8.90%
Zoning and permitted uses should be independently verified with authorities.
How Realmo checks its estimates
Property Analytics
Unlock full access to Insights
Subscribe to Realmo Intelligence
Open Analytics
Current Use
Lease Details
1
Residential units
Yes
Highway access
Location Intelligence
Trade Area within ½ mile
1,010
Businesses Nearby
Explore this area
Business Placement
Demographics for 32825, FL
61,755
Population
22,360
Households
2.8
Avg Household Size
36
Median Age
34%
College-Educated
91%
High-School Grad
18.4 sq mi
ZIP Area
3,356
Density / Sq Mi
$79,942
Median Household Income
$37,957
Median Earnings
$1,738
Median Rent
$327,900
Median Home Value
Check the figures for this property
Cap Rate, Value Estimation, Potential NOI and more
View Realmo Analytics
Market
Vacancy Rate% for Multifamily in South region




Frequently Asked Questions
What type of property is this?
Duplex - Updated two-bath residence with a private-entry bedroom, fenced outdoor space, and convenient access to Orlando services.
Where is this duplex located?
The property is located at 524 PIGEON CIR Orlando, FL.
What is the asking price?
The asking price for this property is $294,900.
What are key features of this property?
This property features: 1,277‑square‑foot half‑duplex with 3 bedrooms and 2 bathrooms; Remodeled bathrooms plus a 2026 A/C, 2025 roof, and 2025 water heater; Bedroom with private bathroom and separate exterior entrance


