Corner Mixed-Use
For Sale
Contact for pricing
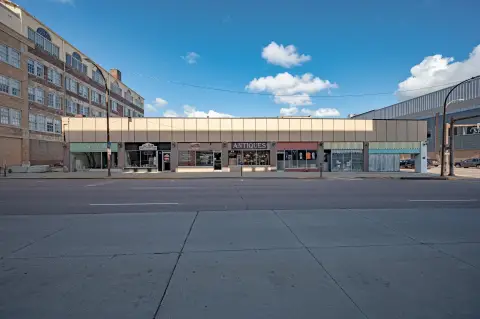
501 Pearl Street, Sioux City, IA 51101
Two-level property with flexible commercial layout, basement areas, high ceilings, and three-phase electrical service.
Property Size8,136 SF
Price / SF$86.04
Days on Market206
Property Features for 501 Pearl Street
General Information
Standard status
Active
Size
8,136 SF
Property subtype
Special Purpose
Zoning
HA-P Historic Area P
Investment Type
Owner/User
Site & Location
Corner Location
Yes
Utilities to Site
Yes
Amenities
tall ceilings
large windows
3-phase power
Building Details
Year Built
1900
Buildings
1
Stories
2
Listing Agency:
CENTURY 21 ProLink
Listed By:
KJ Wingert · License #S69502000
(712) 251-9905
Source:
Crexi
Added: Mar 23
Changed: Oct 13
Last Checked: Oct 12 at 8:45PM
Displayed information is deemed reliable but is not guaranteed and should be independently verified. All listing content including descriptions, pricing, images are the copyrighted material of CENTURY 21 ProLink
Investment Insights
Based on property information with market context.
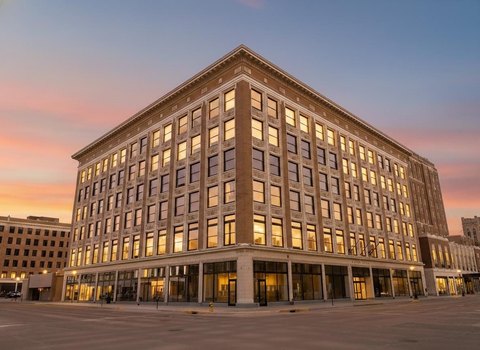
This mixed-use property was built in 1900 and includes two floors measuring 4,068 square feet each. Tall ceilings, large upper-level windows, and full basement space on each side contribute to a flexible configuration. The layout can be separated into two units, supporting separate occupancy or leasing arrangements. Existing features and electrical capacity are suited to office, retail, bar, restaurant, or combined-use concepts, subject to applicable requirements.
The building occupies a corner position on Pearl Street in Sioux City’s entertainment district, near bars, restaurants, and nightlife along a primary corridor. A public parking ramp is located kitty-corner from the property, and a neighboring building is undergoing renovations. Zoning is HA-P Historic Area P. Three-phase power is in place, with electrical capacity described as sufficient for high-demand operations.
The building occupies a corner position on Pearl Street in Sioux City’s entertainment district, near bars, restaurants, and nightlife along a primary corridor. A public parking ramp is located kitty-corner from the property, and a neighboring building is undergoing renovations. Zoning is HA-P Historic Area P. Three-phase power is in place, with electrical capacity described as sufficient for high-demand operations.
Key Highlights
- Two floors with 4,068 square feet per floor
- Full basement space on each side of the building
- Layout can be divided into two separate units
Financial Insights
Estimated NOI and Cap Rate
NOI / Yr
$61,401
Cap Rate
8.77%
Suggested Prices Based on Cap Rates
Cap Rate 5%
$1,228,020
$1.2M
Cap Rate 7%
$877,157
$877.2K
Cap Rate 9%
$682,233
$682.2K
Market Conditions
NOI Build-Up for 8,136 SF
Gross rent
$122.0K $15.00/SF
− Vacancy
−$23.8K −$2.93/SF
EGI
$98.2K $12.08/SF
− OpEx
−$36.8K −$4.53/SF
NOI
$61.4K $7.55/SF
Area
Woodbury County, IA
Vacancy
19.50%
Lease Rate
$15.00 /SF/Yr
Expense Ratio
37.50%
Simulate Cap Rate and NOI
Suggested Prices Based on Cap Rates
Cap Rate 5%
$1,228,020
Cap Rate 7%
$877,157
Cap Rate 9%
$682,233
Alternative Uses
Best Use
Retail
$1.15M
$1.01M – $1.35M
NOI $80,721 @ 7.0% cap · market cap 11.53%
Second Best
Mixed Use
$877.2K
$767.5K – $1.02M
NOI $61,401 @ 7.0% cap · market cap 8.77%
Theoretical Best
Specialty Retail
$1.22M
$1.07M – $1.43M
NOI $85,581 @ 7.0% cap · market cap 12.23%
Zoning and permitted uses should be independently verified with authorities.
How Realmo checks its estimates
Property Analytics
Unlock full access to Insights
Subscribe to Realmo Intelligence
Open Analytics
Current Use
Lease Details
Yes
Utilities to site
Location Intelligence
Trade Area within ½ mile
2,205
Businesses Nearby
Explore this area
Business Placement
Demographics for 51101, IA
1,146
Population
723
Households
1.6
Avg Household Size
39
Median Age
11%
College-Educated
84%
High-School Grad
1.2 sq mi
ZIP Area
955
Density / Sq Mi
$18,103
Median Household Income
$25,661
Median Earnings
$676
Median Rent
Check the figures for this property
Cap Rate, Value Estimation, Potential NOI and more
View Realmo Analytics
Market
Vacancy Rate% for Office in Midwest region

Questions? Ask Rey
Realmo’s AI knows this listing — price, zoning, demand, history. Ask anything.






Frequently Asked Questions
What type of property is this?
Mixed-use property - Two-level property with flexible commercial layout, basement areas, high ceilings, and three-phase electrical service.
Where is this mixed-use property located?
The property is located at 501 Pearl Street Sioux City, IA.
What is the asking price?
The asking price for this property is $700,000.
What are key features of this property?
This property features: Two floors with 4,068 square feet per floor; Full basement space on each side of the building; Layout can be divided into two separate units


