Industrial Flex Property with
For Sale
Contact for pricing
4450 Monroe St, Cincinnati, OH 45033
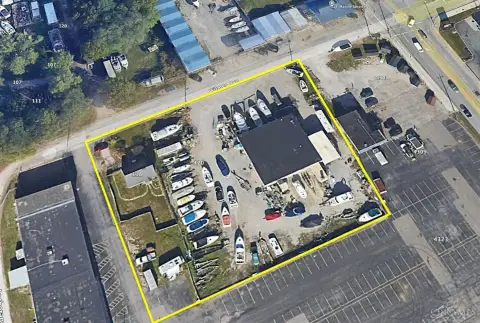
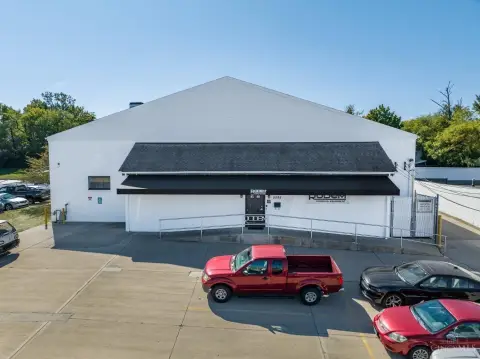
Industrial warehouse space includes a recently renovated office area, supported by ample acreage.
Property Size8,000 SF
Lot Size6.65 Acres
Price / SF$250
Days on Market142
Property Features for 4450 Monroe St
General Information
Standard status
Active
Size
8,000 SF
Lot size
6.65 Acres
Property subtype
Industrial
Building Details
Year Built
1993
Tenancy
Single
Listing Agency:
Colliers - Cincinnati, Ohio
Listed By:
Bill Keefer · License #OH 0000342681
(513) 721-4200
Source:
Crexi
Added: Jun 3
Changed: Oct 5
Last Checked: Oct 20 at 8:25PM
Displayed information is deemed reliable but is not guaranteed and should be independently verified. All listing content including descriptions, pricing, images are the copyrighted material of Colliers - Cincinnati, Ohio

Ask AI about this property
Review the available facts, identify missing information and prepare questions for the agent.
Investment Insights
Based on property information with market context.
This industrial flex property totals 8,000 SF and combines warehouse space with 3,500 SF of recently renovated office space in excellent condition. The office component offers a turnkey option for operations needing dedicated administrative space alongside their industrial footprint.
The property sits on 6.651 acres, providing room for the site needs associated with industrial and flex use. It is presented as a for-sale opportunity.
For tenants, operators, or buyers seeking a single property that supports both production or storage and on-site office functions, the layout is designed to keep work and management under one roof. The recently renovated office portion can help accommodate day-to-day administration without relying on off-site space, while the remaining industrial area supports core operational requirements.
The property sits on 6.651 acres, providing room for the site needs associated with industrial and flex use. It is presented as a for-sale opportunity.
For tenants, operators, or buyers seeking a single property that supports both production or storage and on-site office functions, the layout is designed to keep work and management under one roof. The recently renovated office portion can help accommodate day-to-day administration without relying on off-site space, while the remaining industrial area supports core operational requirements.
Key Highlights
- 8,000 SF industrial property built in 1993
- Includes 3,500 SF recently renovated office space in excellent condition
- Set on 6.651 acres
Financial Insights
Estimated NOI and Cap Rate
NOI / Yr
$69,638
Cap Rate
3.48%
Suggested Prices Based on Cap Rates
Cap Rate 5%
$1,392,760
$1.4M
Cap Rate 7%
$994,829
$994.8K
Cap Rate 9%
$773,756
$773.8K
Market Conditions
NOI Build-Up for 8,000 SF
Gross rent
$115.2K $14.40/SF
− Vacancy
−$8.1K −$1.01/SF
EGI
$107.1K $13.39/SF
− OpEx
−$37.5K −$4.69/SF
NOI
$69.6K $8.70/SF
Area
Cincinnati, OH
Vacancy
7.00%
Lease Rate
$14.40 /SF/Yr
Expense Ratio
35.00%
Simulate Cap Rate and NOI
Suggested Prices Based on Cap Rates
Cap Rate 5%
$1,392,760
Cap Rate 7%
$994,829
Cap Rate 9%
$773,756
Alternative Uses
Best Use
Flex RnD
$994.8K
$870.5K – $1.16M
NOI $69,638 @ 7.0% cap · market cap 3.48%
Second Best
Industrial
$559.5K
$489.6K – $652.7K
NOI $39,164 @ 7.0% cap · market cap 1.96%
Theoretical Best
Office A
$1.59M
$1.39M – $1.86M
NOI $111,320 @ 7.0% cap · market cap 5.57%
Zoning and permitted uses should be independently verified with authorities.
How Realmo checks its estimates
Property Analytics
Contact the owner directly
Get the owner's phone numbers and email
Open Analytics
Current Use
Location Intelligence
Trade Area within ½ mile
1,481
Businesses Nearby
Under-served
Demand for This Use
Explore this area
Business Placement
Demographics for 45033, OH
323
Population
169
Households
1.9
Avg Household Size
41
Median Age
12%
College-Educated
84%
High-School Grad
0.3 sq mi
ZIP Area
1,077
Density / Sq Mi
$43,125
Median Household Income
$38,281
Median Earnings
$81,400
Median Home Value
Check the figures for this property
Cap Rate, Value Estimation, Potential NOI and more
View Realmo Analytics
Market
Vacancy Rate% for Industrial in Cincinnati, OH






Similar Off Market Nearby
- Prestige Catering — 2650 Highland Ave, Cincinnati, OH 45219
Frequently Asked Questions
What type of property is this?
Flex space - Industrial warehouse space includes a recently renovated office area, supported by ample acreage.
Where is this flex space located?
The property is located at 4450 Monroe St Cincinnati, OH.
What is the asking price?
The asking price for this property is $2,000,000.
What are key features of this property?
This property features: 8,000 SF industrial property built in 1993; Includes 3,500 SF recently renovated office space in excellent condition; Set on 6.651 acres


