Mixed-Use Redevelopment
For Sale
Contact for pricing
421 E ROBINSON ST, Orlando, FL 32801
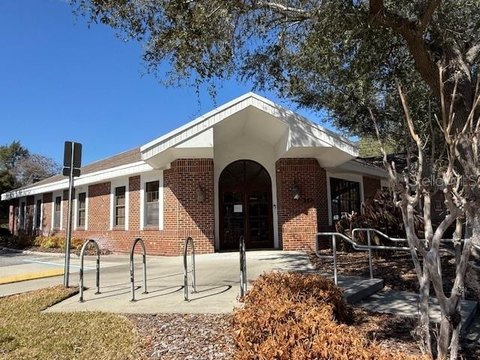
Existing block construction building near Lake Eola Park, with prior city-approved plans for a 7-story mixed-use project.
Property Size9,479 SF
Price / SF$599
Days on Market495
Property Features for 421 E ROBINSON ST
General Information
Standard status
Active
Size
9,479 SF
Property subtype
Office
Taxes and HOA fees
Annual Taxes
$38,530
Building Details
Building Size
9,479 SF
Year Built
1965
Stories
7
Listing Agency:
DOVER INTERNATIONAL CO., INC.
Listed By:
Kimberly Robinson · License #BK3113676
(407) 488-7236
Source:
Thefullerproperties
Added: May 22, 2025
Changed: Sep 25
Last Checked: Sep 26 at 1:36PM
Displayed information is deemed reliable but is not guaranteed and should be independently verified. All listing content including descriptions, pricing, images are the copyrighted material of DOVER INTERNATIONAL CO., INC.
Investment Insights
Based on property information with market context.
The property at 421 E Robinson St Orlando includes an existing nearly 10,000 SF block construction building. The site is being marketed as a redevelopment or transformation opportunity, with prior City of Orlando approved plans for a 7-story mixed-use development. The proposed concept includes spacious one-bedroom, two-bedroom, and three-bedroom units, along with restaurant and office spaces and a convenient parking garage.
The location is described as just steps from Lake Eola Park in Downtown Orlando, with immediate access to the Walt Disney Amphitheater and the surrounding event calendar. The remarks also reference the 0.9-mile concrete path that runs along Lake Eola and nearby lake-oriented attractions such as a pagoda, swan boats, and a playground.
For investors, developers, and operators, the practical takeaway is the flexibility between renovating the existing building and pursuing the previously approved mixed-use program on-site. The plan’s blend of residential units plus restaurant and office space may support multiple tenant and user profiles, including the remarks’ noted options such as senior housing or student accommodations. Any buyer evaluating the asset will have a clear framework provided by the prior approvals while still retaining the ability to tailor the final mix to their vision.
The location is described as just steps from Lake Eola Park in Downtown Orlando, with immediate access to the Walt Disney Amphitheater and the surrounding event calendar. The remarks also reference the 0.9-mile concrete path that runs along Lake Eola and nearby lake-oriented attractions such as a pagoda, swan boats, and a playground.
For investors, developers, and operators, the practical takeaway is the flexibility between renovating the existing building and pursuing the previously approved mixed-use program on-site. The plan’s blend of residential units plus restaurant and office space may support multiple tenant and user profiles, including the remarks’ noted options such as senior housing or student accommodations. Any buyer evaluating the asset will have a clear framework provided by the prior approvals while still retaining the ability to tailor the final mix to their vision.
Key Highlights
- Nearly 10,000 SF block construction building near Lake Eola Park in Downtown Orlando
- City of Orlando previously approved plans for a 7‑story mixed‑use development
- Proposed mix includes 1‑bedroom, 2‑bedroom, and 3‑bedroom units
Property Analytics
Unlock full access to Insights
Subscribe to Realmo Intelligence
Open Analytics
Current Use
Location Intelligence
Trade Area within ½ mile
8,617
Businesses Nearby
Explore this area
Business Placement
Demographics for 32801, FL
17,728
Population
12,133
Households
1.5
Avg Household Size
36
Median Age
63%
College-Educated
95%
High-School Grad
2.2 sq mi
ZIP Area
8,058
Density / Sq Mi
$77,626
Median Household Income
$63,090
Median Earnings
$1,773
Median Rent
$397,600
Median Home Value
Check the figures for this property
Cap Rate, Value Estimation, Potential NOI and more
View Realmo Analytics
Market
Vacancy Rate% for Multifamily in South region

Questions? Ask Rey
Realmo’s AI knows this listing — price, zoning, demand, history. Ask anything.




Frequently Asked Questions
What type of property is this?
Mixed-use property - Existing block construction building near Lake Eola Park, with prior city-approved plans for a 7-story mixed-use project.
Where is this mixed-use property located?
The property is located at 421 E ROBINSON ST Orlando, FL.
What is the asking price?
The asking price for this property is $5,990,000.
What are key features of this property?
This property features: Nearly 10,000 SF block construction building near Lake Eola Park in Downtown Orlando; City of Orlando previously approved plans for a 7‑story mixed‑use development; Proposed mix includes 1‑bedroom, 2‑bedroom, and 3‑bedroom units


