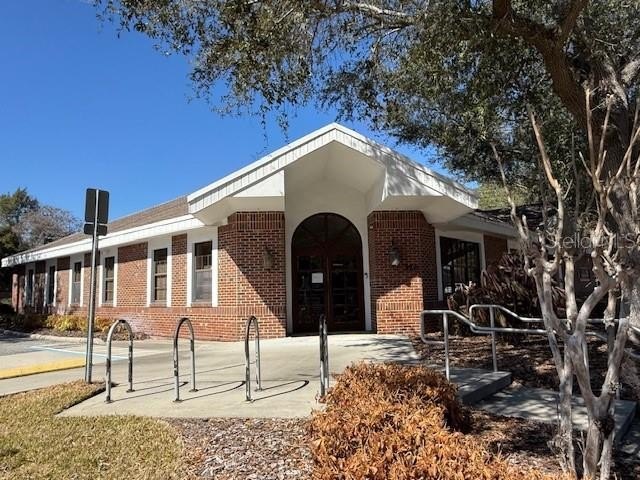
Brick Office Building with
For Sale
$2,750,000
326 N MILLS Avenue, Orlando, FL 32803
Commercial Sale, ORLANDO, FL
Property Size6,706 SF
Lot Size1.29 Acres
Price / SF$410.08
Days on Market138
Property Features for 326 N MILLS Avenue
General Information
Property type
Commercial Sale
Property subtype
Office
Zoning
O-1/T
Security features
Security System
Window features
Blinds
Appliances
Refrigerator
Subdivision
EOLA PARK HEIGHTS
Lot features
Corner Lot, City Limits, Landscaped, Street Lights, Paved
Directions
Exit I-4 on Colonial make a right (south) on Mills Avenue, Make a right on Livingston Street. building on left facing Mills Avenue .
Standard status
Active
APN
25-22-29-2508-05-100
Size
6,706 SF
Lot size
1.29 Acres
Taxes and HOA fees
Tax Year
2025
Tax Description
EOLA PARK HEIGHTS H/33 LOTS 9 THROUGH 16BLK E
Tax Annual Amount
112826
Legal Description
EOLA PARK HEIGHTS H/33 LOTS 9 THROUGH 16BLK E
Utilities
Utilities
Phone Available
Sewer type
Public Sewer
Heating system
Central
Cooling system
Central Air
Water source
Public
Amenities
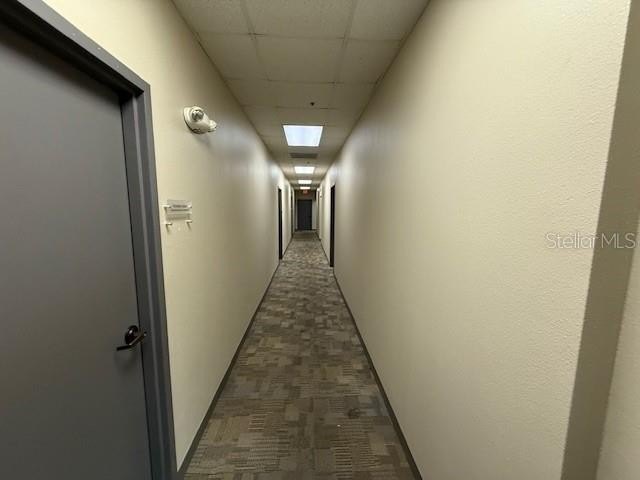
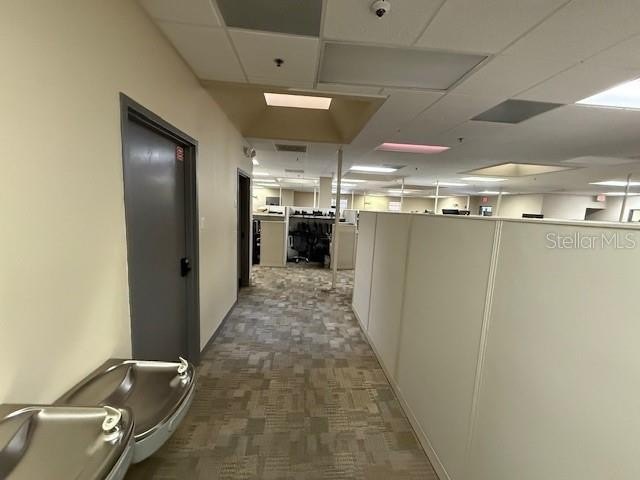
2 reception areas
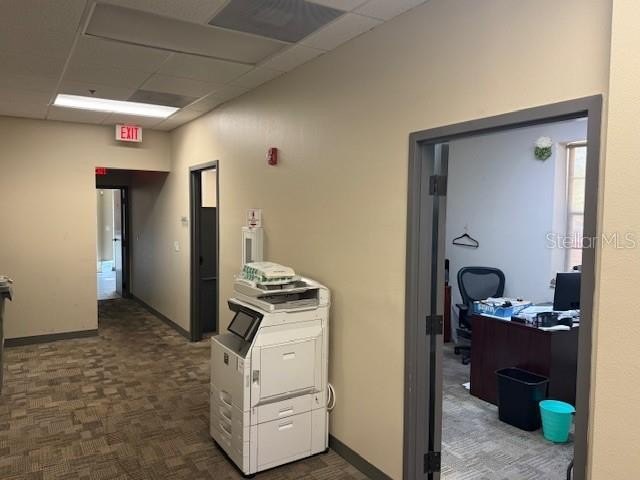
7 private offices
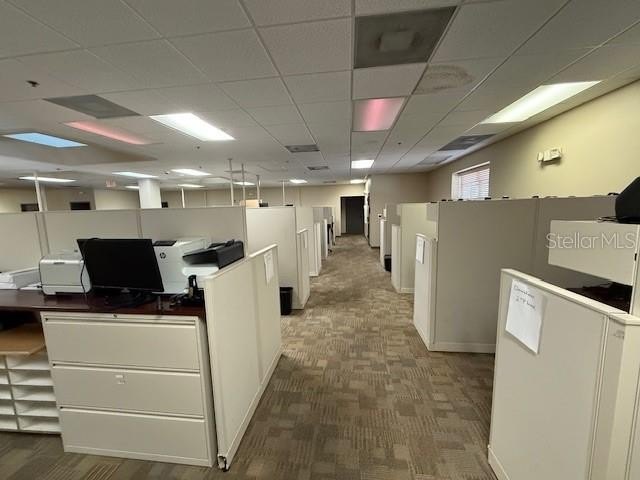
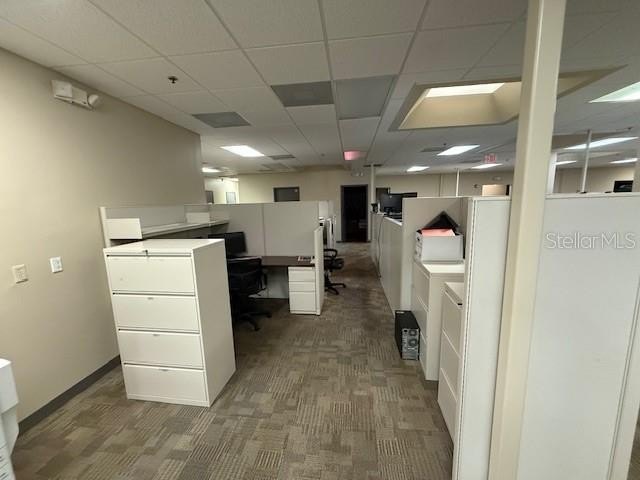
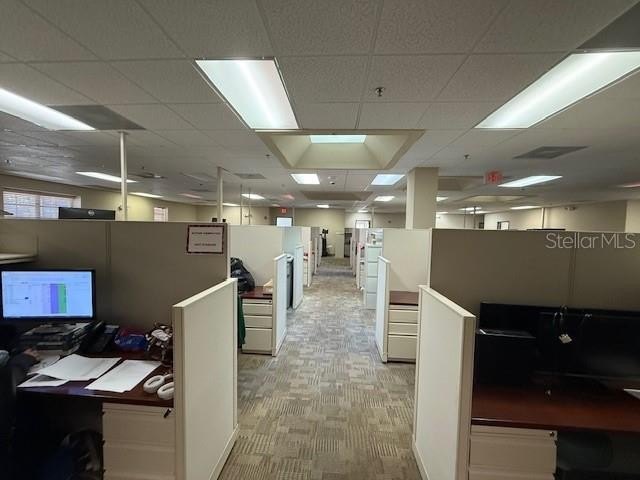
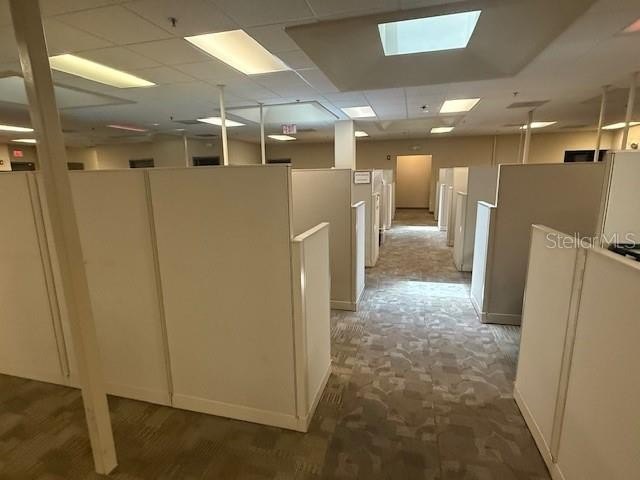
multiple open workstations
skylights
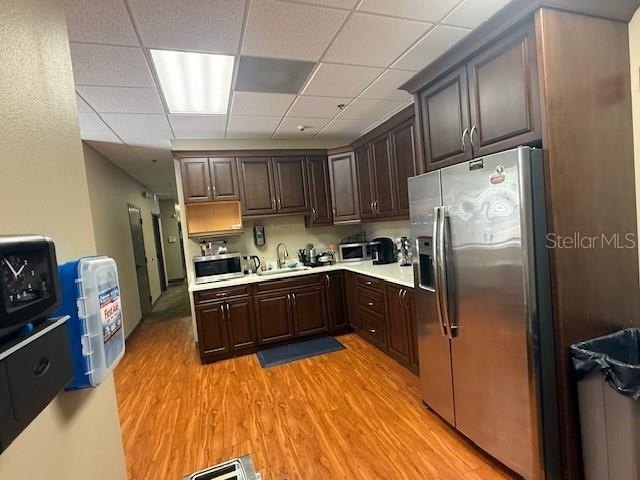
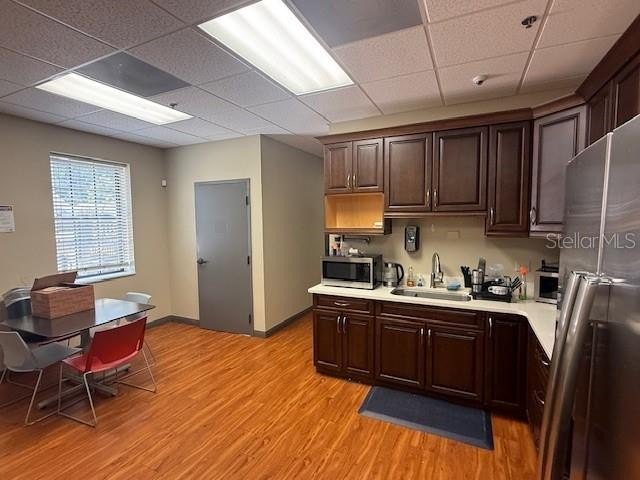
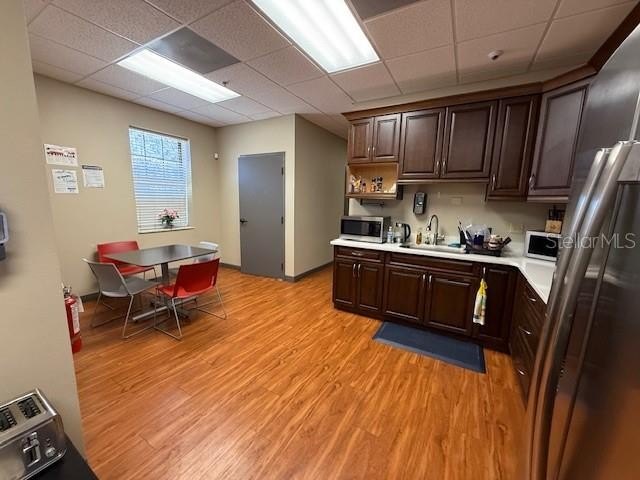
full service Kitchen
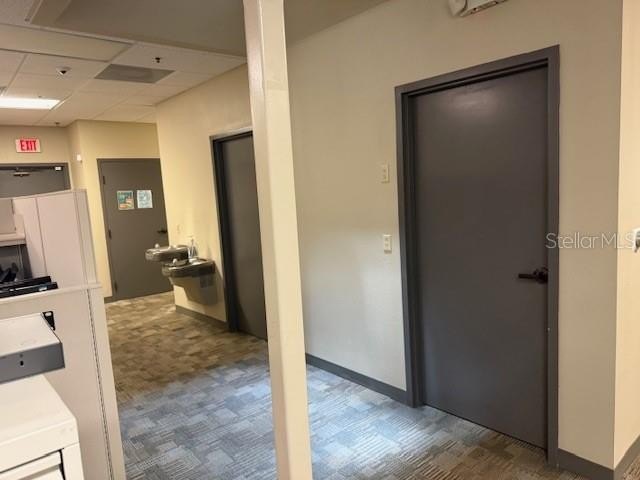
4 restrooms
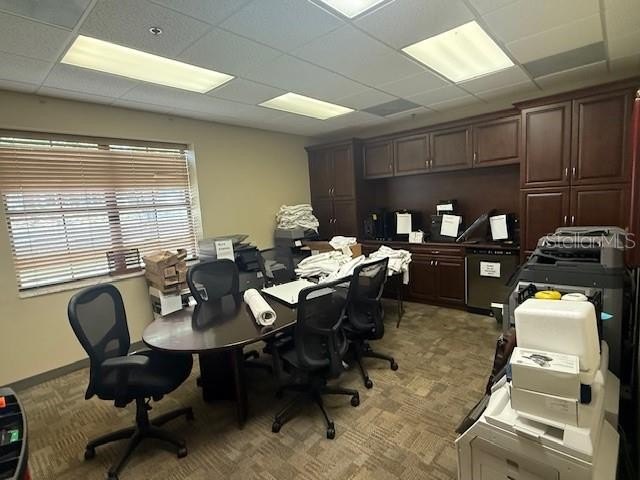
Stylish Business Conference Room
electrical and computer monitor room
2 file rooms
Building Details
Year built
1993
Floors in Building
1
Flooring type
Carpet, Laminate
Building materials
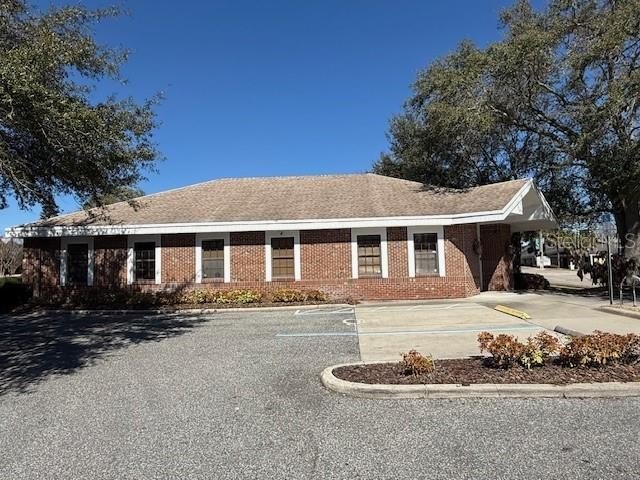
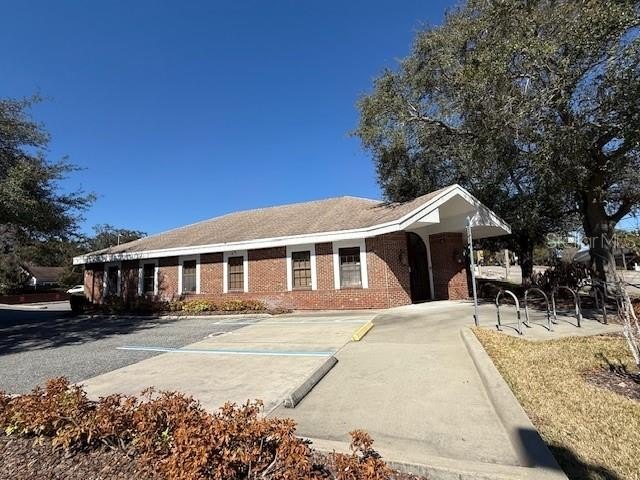
Brick
Roof type
Shingle
Listing Agency:
FLORIDA REALTY INVESTMENTS
Listed By:
Alain Hart
(407) 207-2220
Added: Jun 10
Changed: Oct 17
Last Checked: Oct 25 at 6:06AM
MLS# O6415603
Copyright © 2026 Stellar MLS. All rights reserved. All information provided by the listing agent/broker is deemed reliable but is not guaranteed and should be independently verified.

Ask AI about this property
Review the available facts, identify missing information and prepare questions for the agent.
Investment Insights
Based on property information with market context.
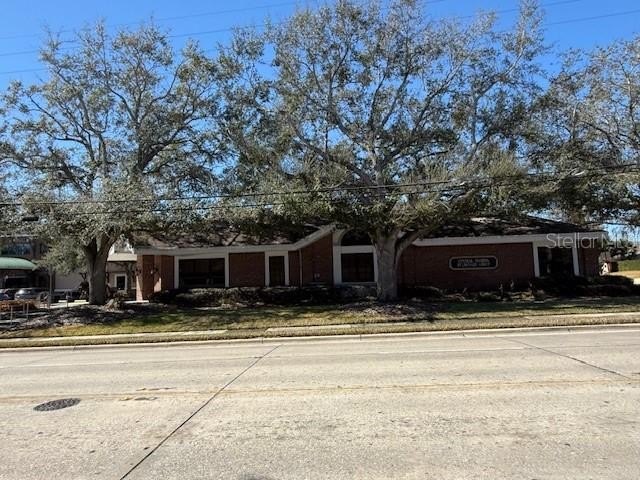
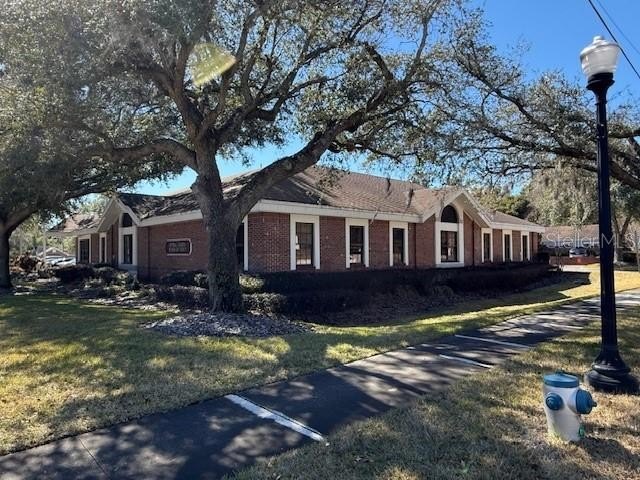
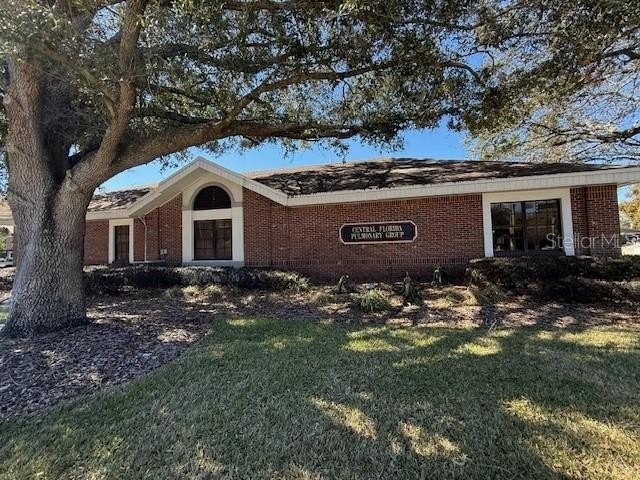
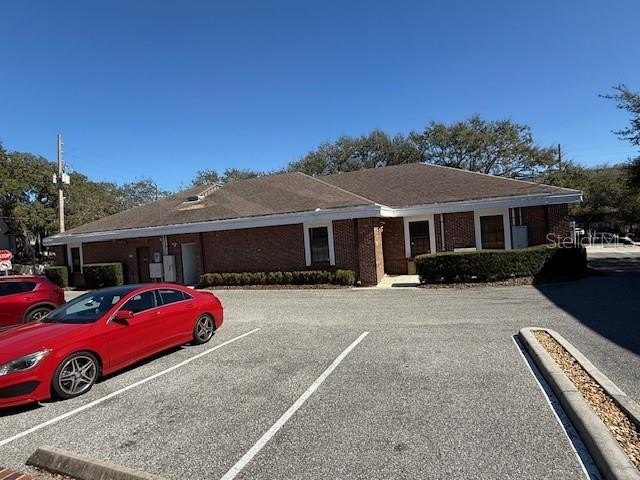
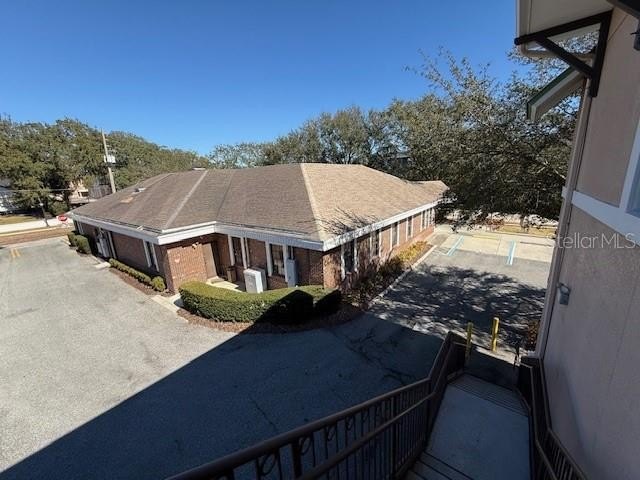
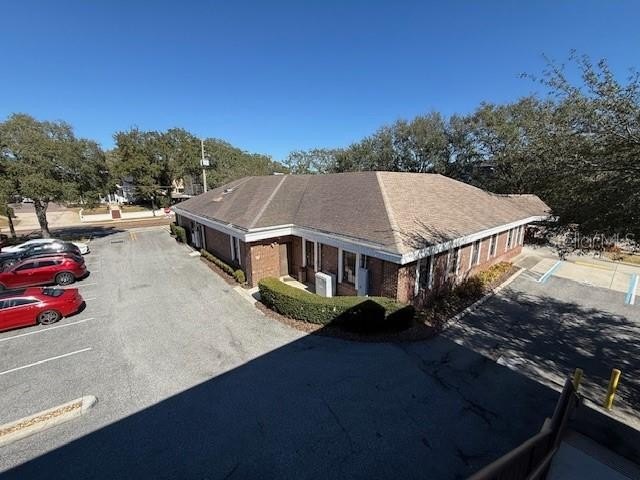
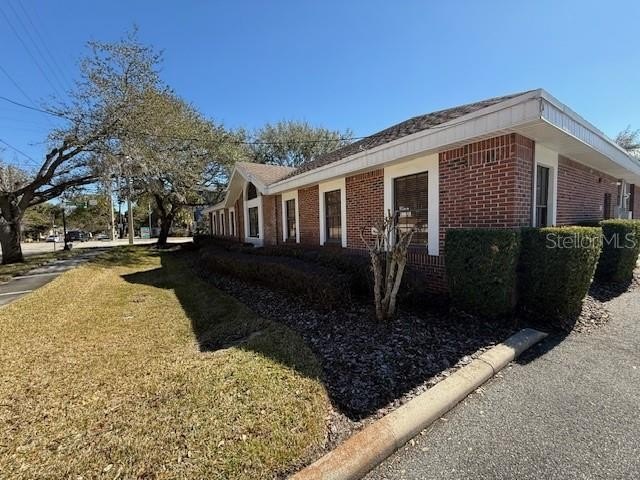
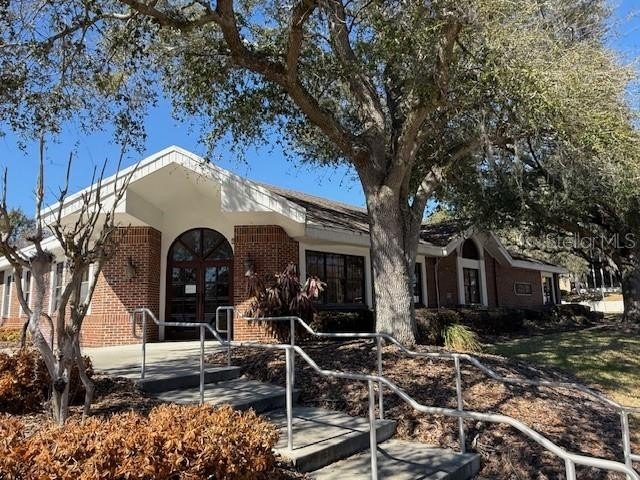
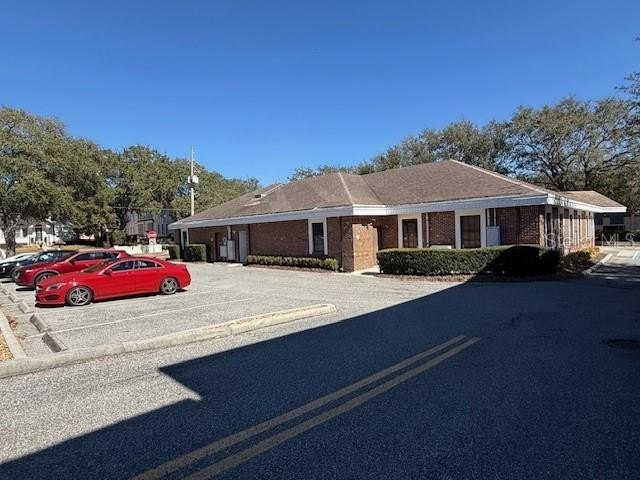
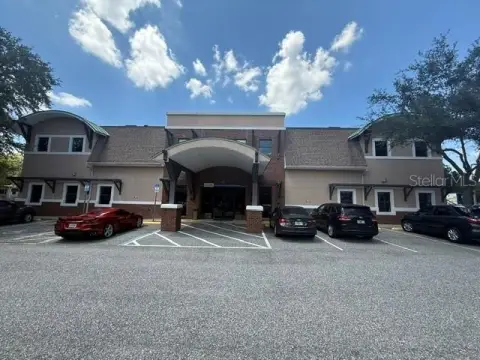
Built in 1993, this office property at 326 N Mills Avenue features a Colonial-style brick exterior, dormer windows, skylights, and laminate and carpet flooring. The interior includes two reception areas, seven private offices, open workstations, a business conference room, a full-service kitchen, four restrooms, two file rooms, and a dedicated electrical and computer monitor room. Central heating and central air conditioning serve the building, with public water and public sewer.
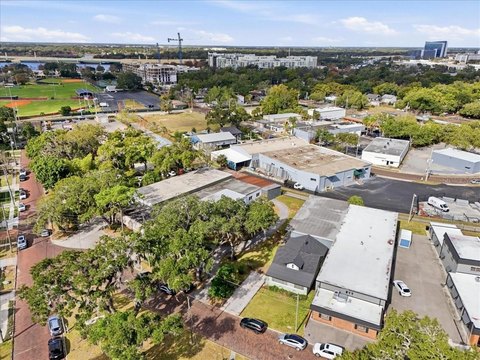
The property occupies 1.29 acres with 80 feet of frontage along North Mills Avenue and is zoned O-1/T. It is adjacent to the Advent Health Pulmonary Medical facility. A shingle roof replacement is identified for March 2026.
The property occupies 1.29 acres with 80 feet of frontage along North Mills Avenue and is zoned O-1/T. It is adjacent to the Advent Health Pulmonary Medical facility. A shingle roof replacement is identified for March 2026.
Key Highlights
- 1.29‑acre office property with 80 feet of frontage on North Mills Avenue
- Zoned O‑1/T
- Seven private offices plus open workstations and two reception areas
Financial Insights
Estimated NOI and Cap Rate
NOI / Yr
$125,235
Cap Rate
4.55%
Suggested Prices Based on Cap Rates
Cap Rate 5%
$2,504,700
$2.5M
Cap Rate 7%
$1,789,071
$1.8M
Cap Rate 9%
$1,391,500
$1.4M
Market Conditions
NOI Build-Up for 6,706 SF
Gross rent
$201.2K $30.00/SF
− Vacancy
−$34.2K −$5.10/SF
EGI
$167.0K $24.90/SF
− OpEx
−$41.7K −$6.23/SF
NOI
$125.2K $18.67/SF
Area
Orlando, FL
Vacancy
17.00%
Lease Rate
$30.00 /SF/Yr
Expense Ratio
25.00%
Simulate Cap Rate and NOI
Suggested Prices Based on Cap Rates
Cap Rate 5%
$2,504,700
Cap Rate 7%
$1,789,071
Cap Rate 9%
$1,391,500
Alternative Uses
Best Use
Office B
$1.79M
$1.57M – $2.09M
NOI $125,235 @ 7.0% cap · market cap 4.55%
Second Best
—
—
no second resolved use
Theoretical Best
Office A
$2.16M
$1.89M – $2.52M
NOI $151,217 @ 7.0% cap · market cap 5.50%
Zoning and permitted uses should be independently verified with authorities.
How Realmo checks its estimates
Property Analytics
Contact the owner directly
Get the owner's phone numbers and email
Open Analytics
Current Use
Lease Details
Yes
Paved road access
Location Intelligence
Trade Area within ½ mile
3,913
Businesses Nearby
Explore this area
Business Placement
Demographics for 32803, FL
21,003
Population
12,225
Households
1.7
Avg Household Size
38
Median Age
59%
College-Educated
96%
High-School Grad
6.8 sq mi
ZIP Area
3,089
Density / Sq Mi
$101,401
Median Household Income
$61,439
Median Earnings
$1,823
Median Rent
$421,300
Median Home Value
Check the figures for this property
Cap Rate, Value Estimation, Potential NOI and more
View Realmo Analytics
Market
Vacancy Rate% for Office in Orlando, FL





Frequently Asked Questions
What type of property is this?
Office building - Configured with private offices, open work areas, reception space, conference facilities, kitchen, and multiple restrooms.
Where is this office building located?
The property is located at 326 N MILLS Avenue Orlando, FL.
What is the asking price?
The asking price for this property is $2,750,000.
What are key features of this property?
This property features: 1.29‑acre office property with 80 feet of frontage on North Mills Avenue; Zoned O‑1/T; Seven private offices plus open workstations and two reception areas