Live-Work Property with Rooftop
For Sale
$895,000
411 NW 5th Street, Oklahoma City, OK 73102
Commercial Sale, Oklahoma City, OK
Property Size7,875 SF
Lot Size0.23 Acres
Price / SF$113.65
Days on Market541
Property Features for 411 NW 5th Street
General Information
Property type
Commercial Sale
Property subtype
Office
Zoning
Commercial
Directions
SE Corner of NW 5th St & Hudson Ave, downtown OKC. Just west of public parking lot.
Standard status
Active
APN
411NW5th73102
Size
7,875 SF
Lot size
0.23 Acres
Utilities
Sewer type
Public Sewer
Heating system
Electric (Heating)
Cooling system
Central Air, Electric
Water source
Public
Amenities
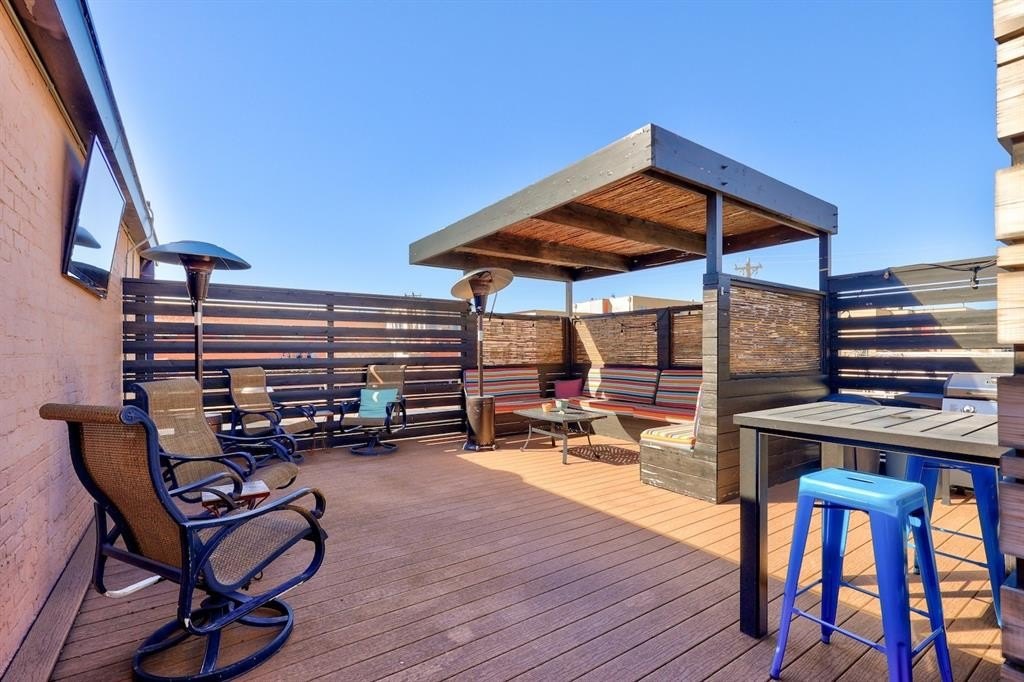
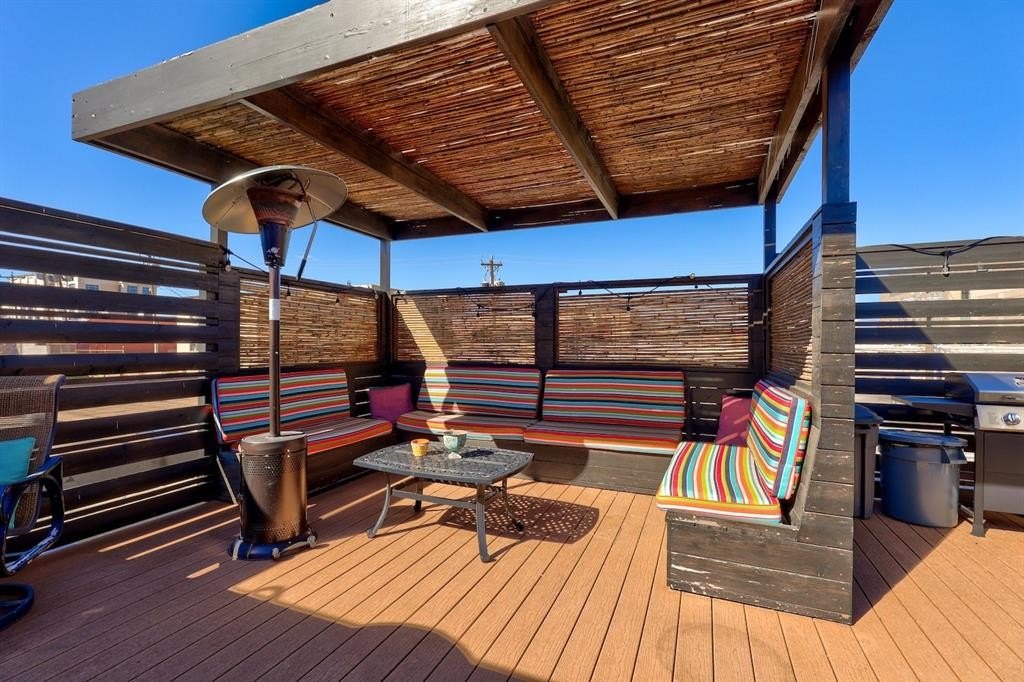
private rooftop patio
kitchenette
fenced-in storage area
video surveillance cameras
monitored alarm system
large roll-up garage door
Building Details
Year built
1953
Floors in Building
2
Building materials
Brick
Listing Agency:
Copper Creek Real Estate
(405) 888-9902
Listed By:
Micah Davis · License #153465
(405) 509-3516
Added: Apr 21, 2025
Changed: Sep 17
Last Checked: Oct 13 at 3:06PM
MLS# 1165935
Copyright © 2026 MLSOK, Inc. All rights reserved. All information provided by the listing agent/broker is deemed reliable but is not guaranteed and should be independently verified.
Investment Insights
Based on property information with market context.
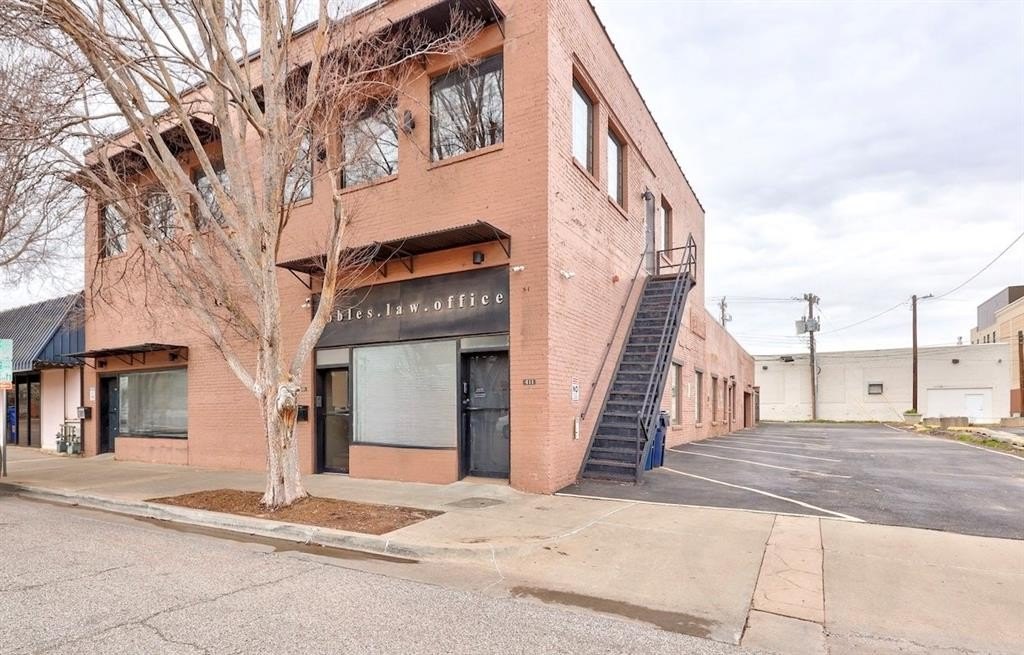
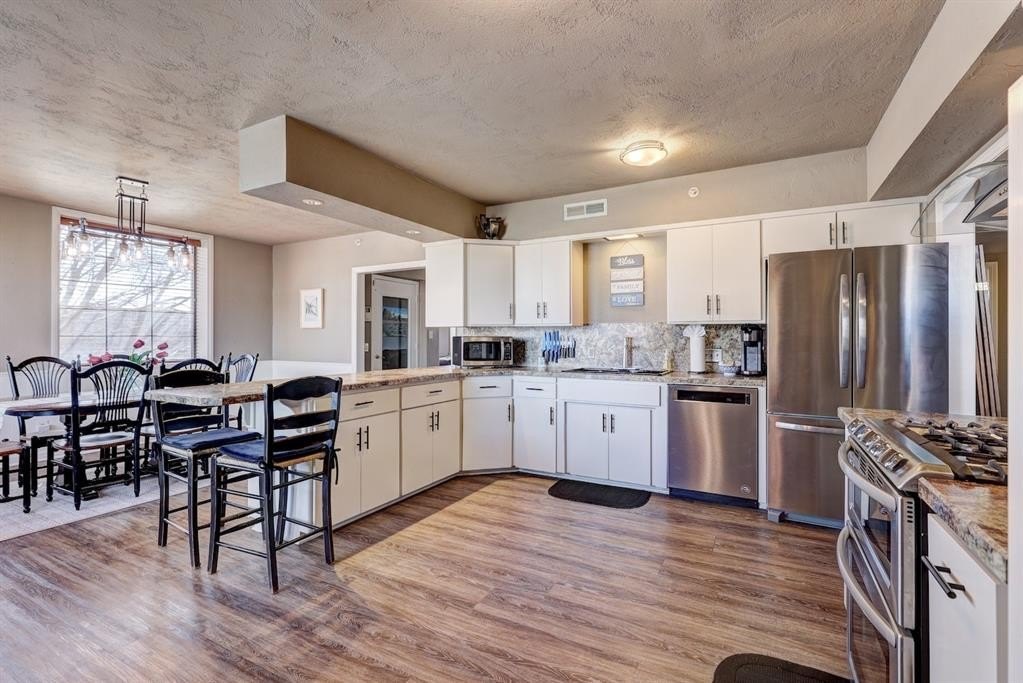
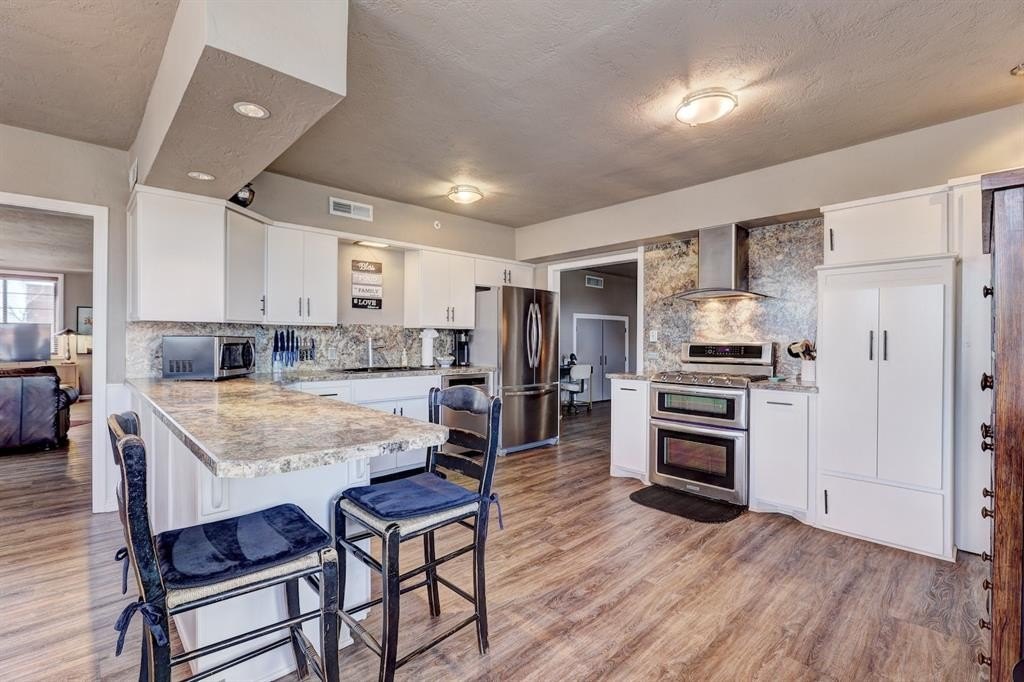
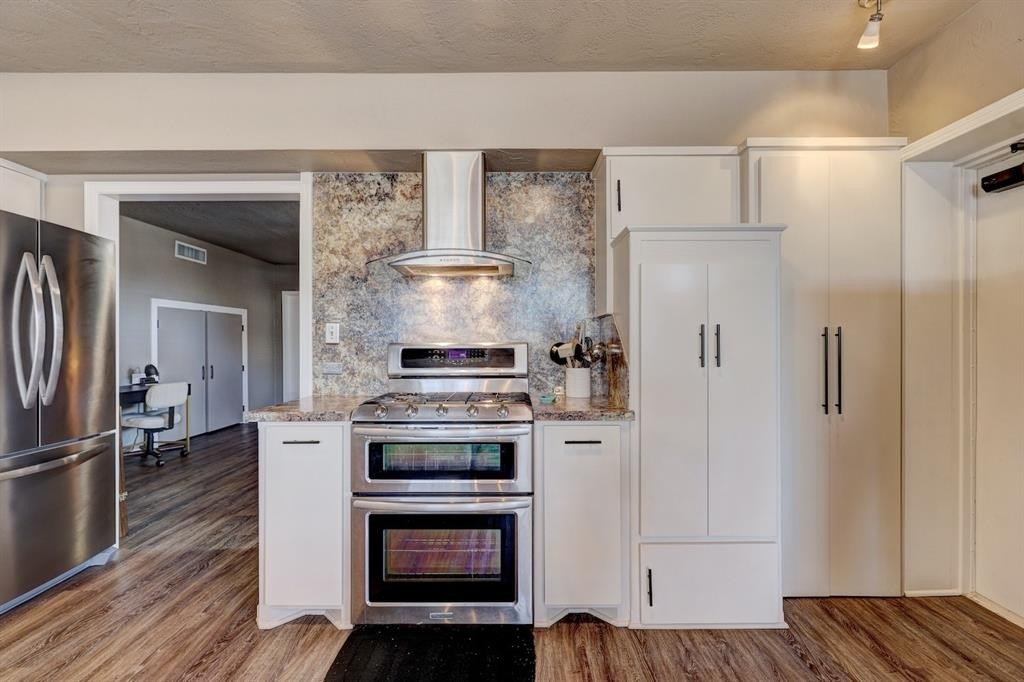
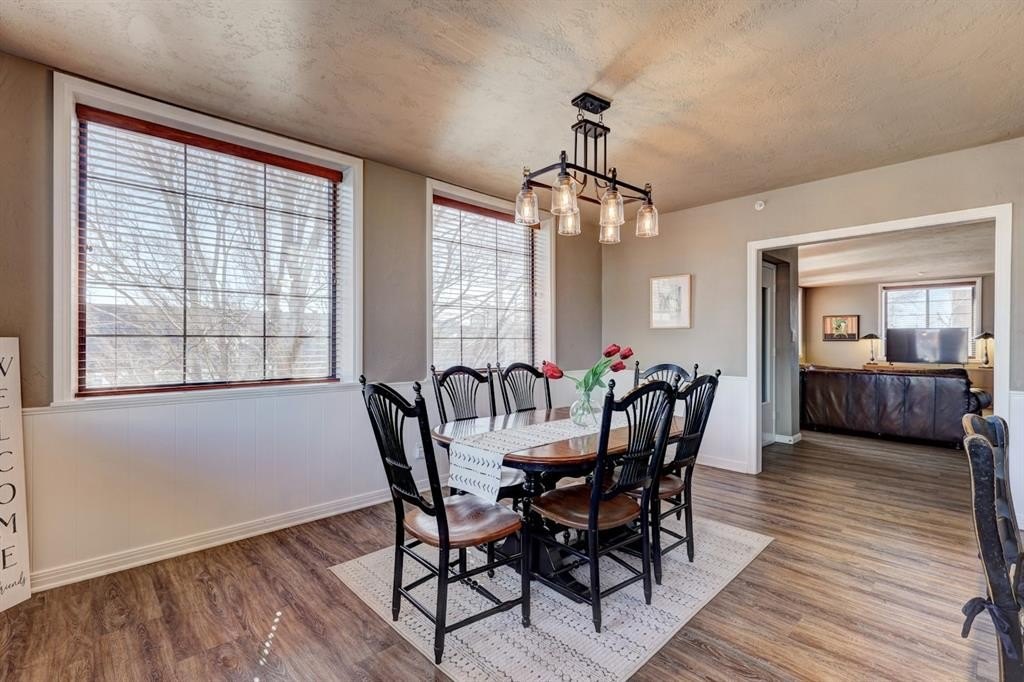
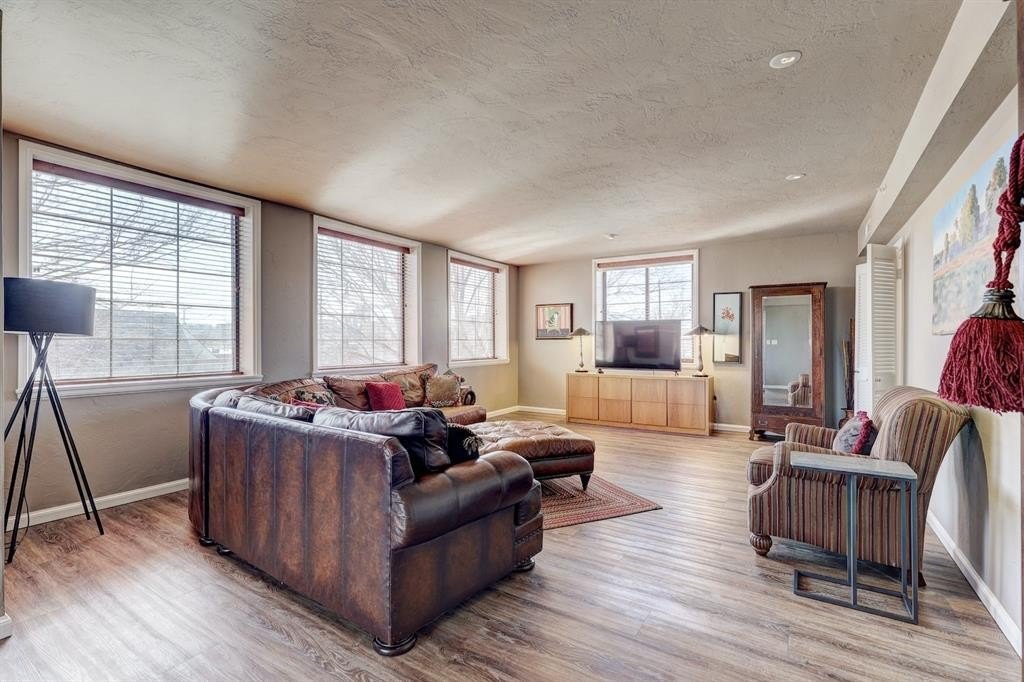
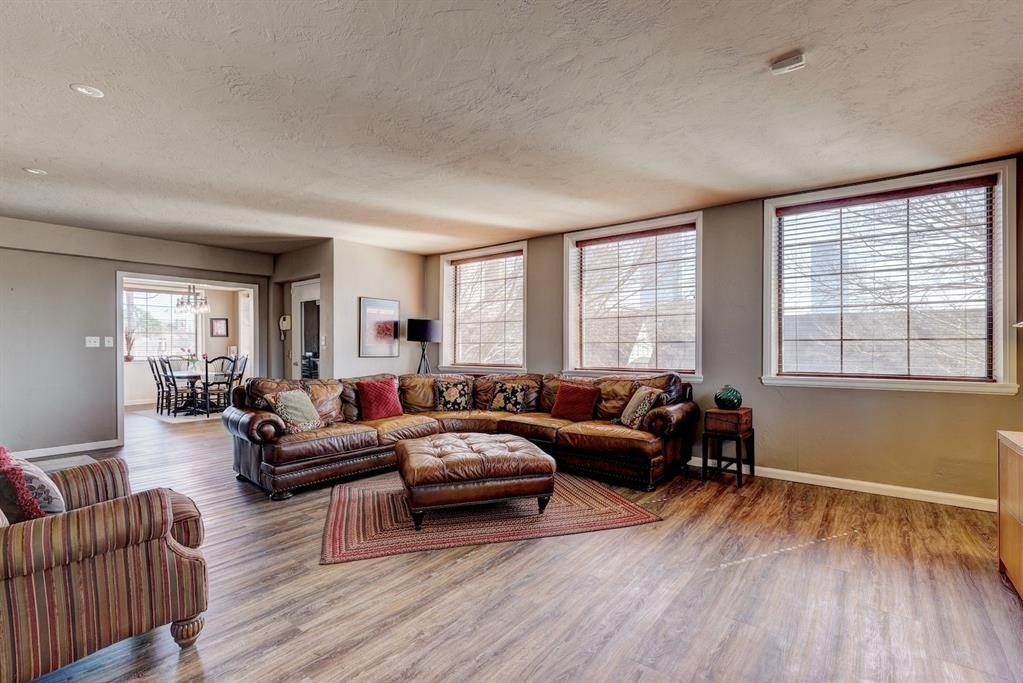
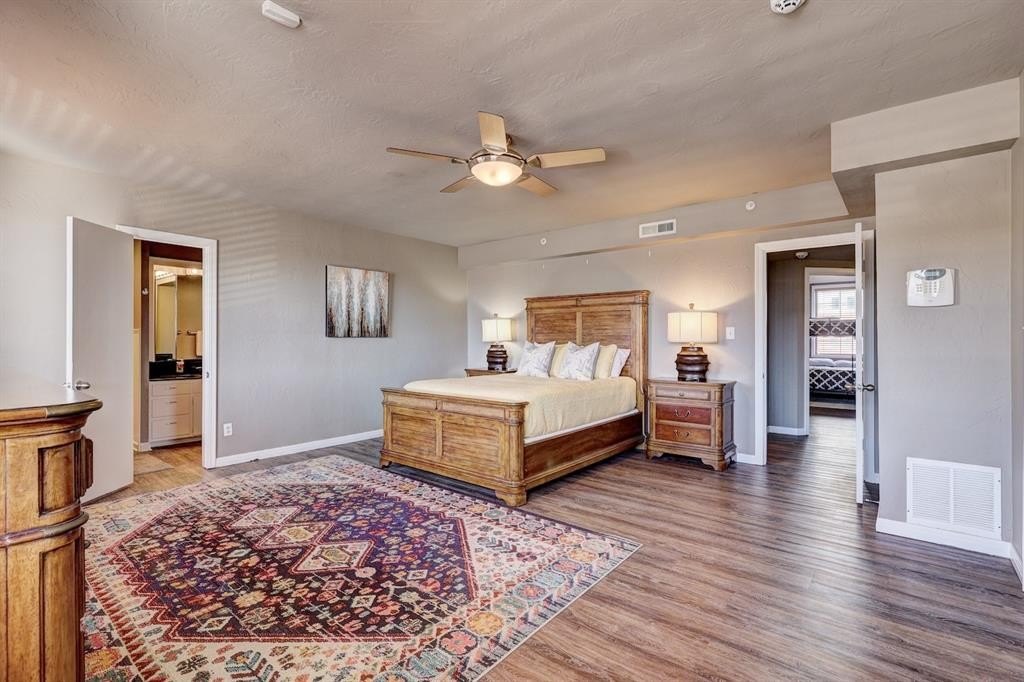
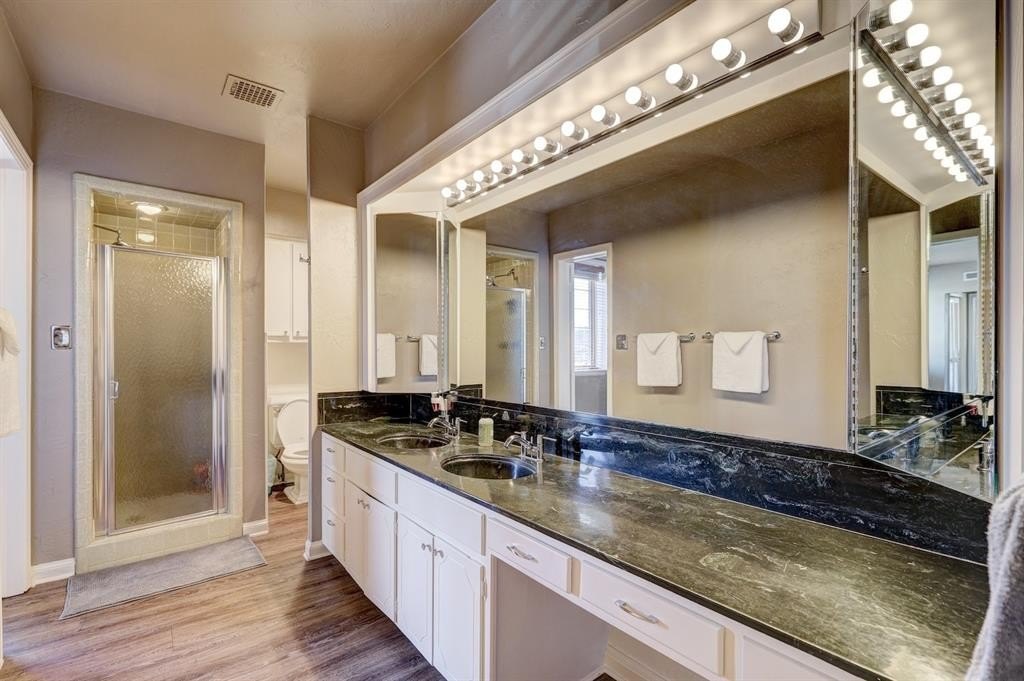
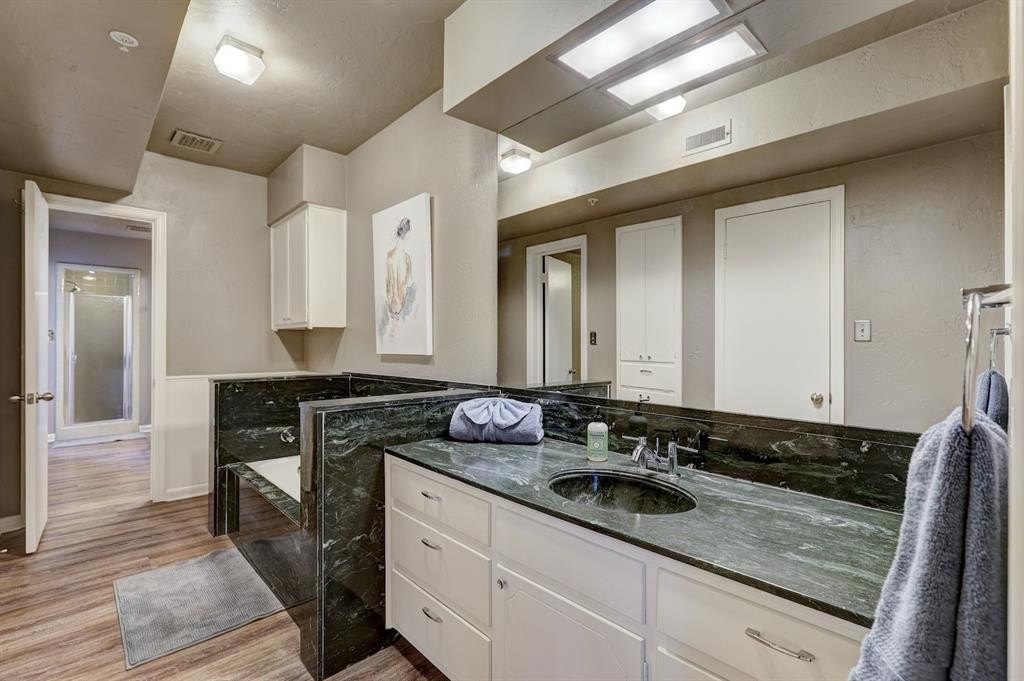
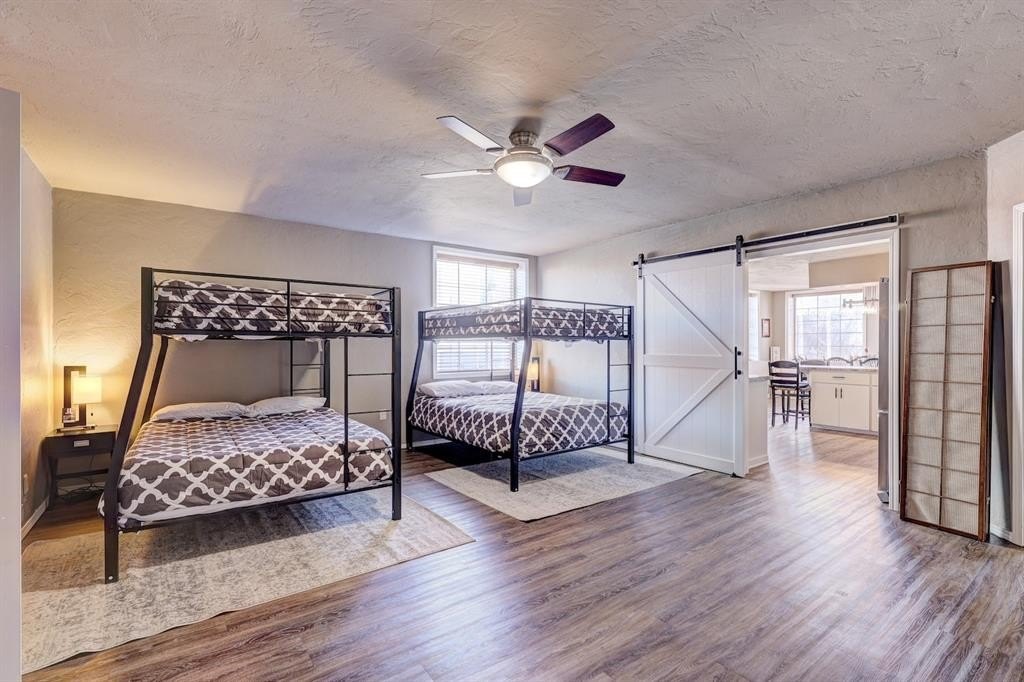
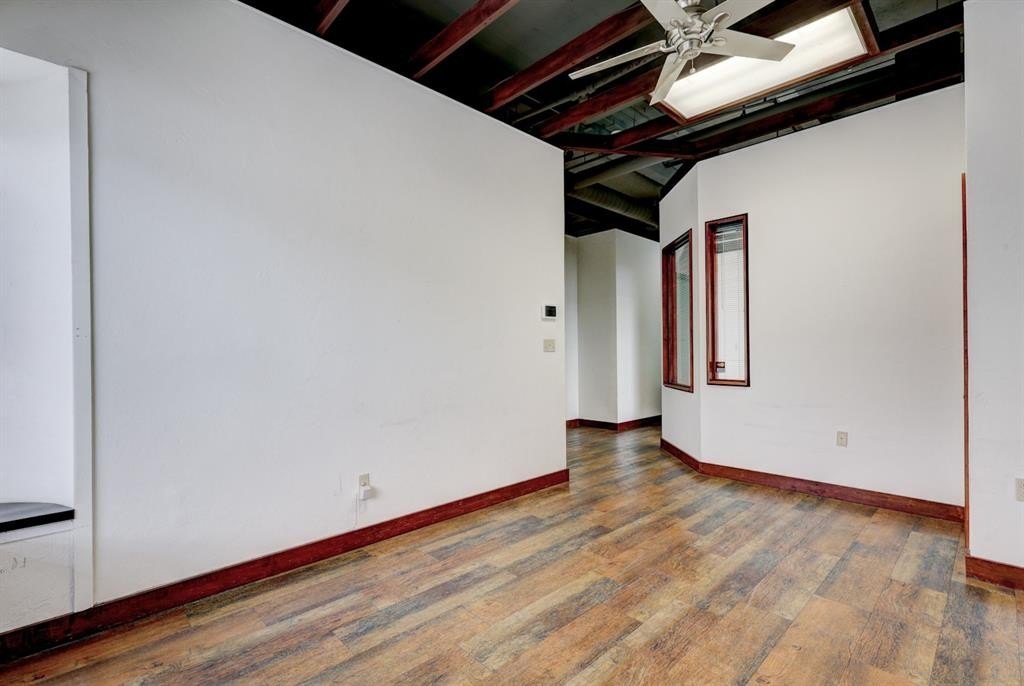
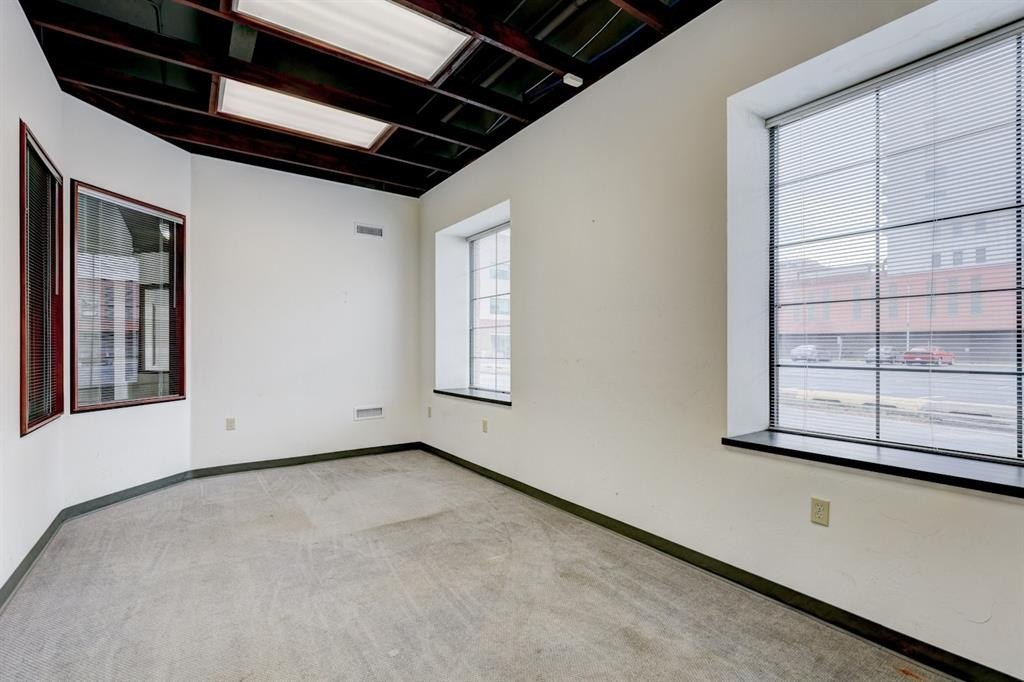
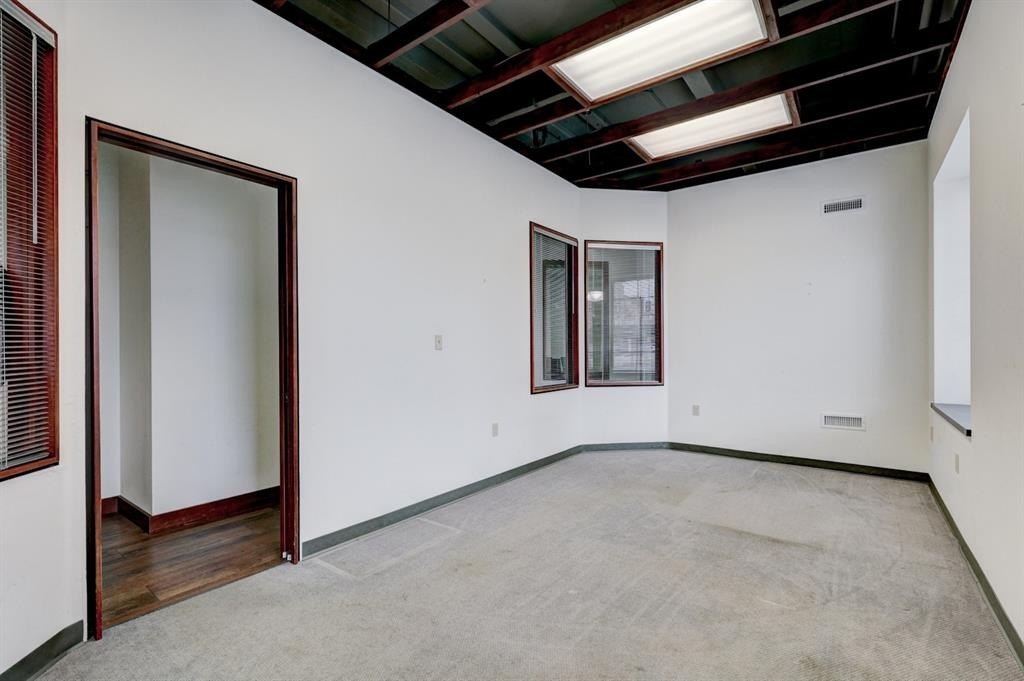
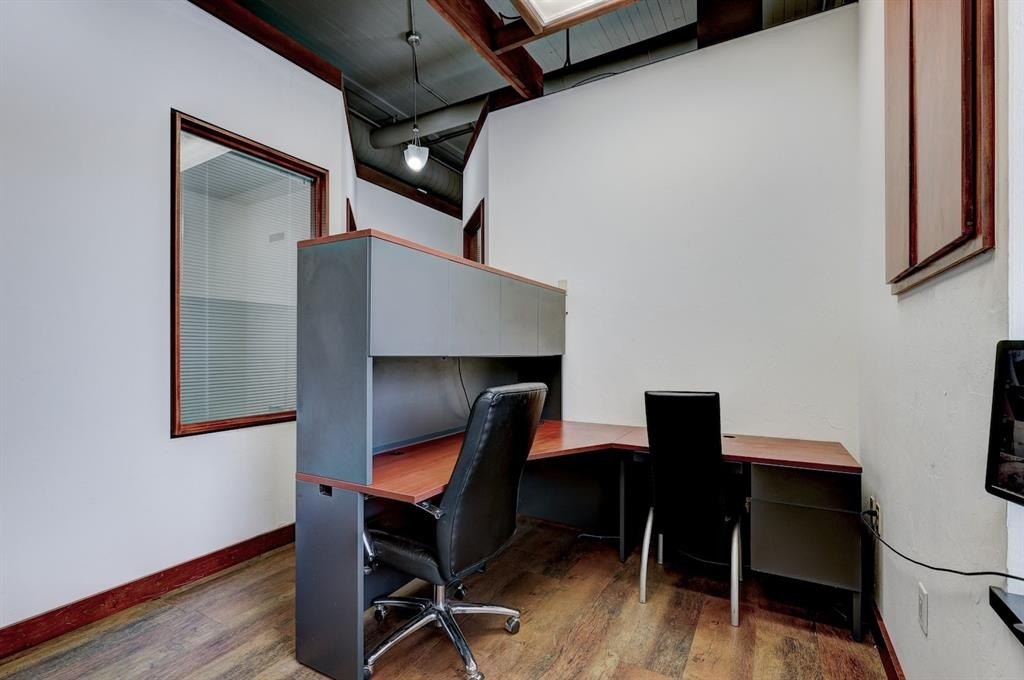
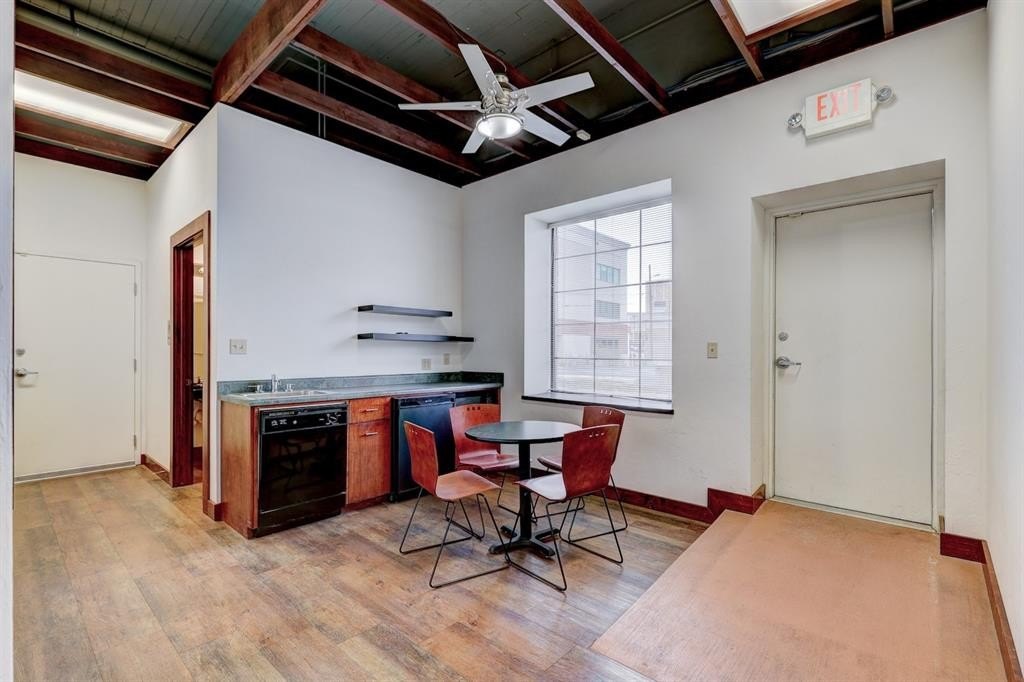
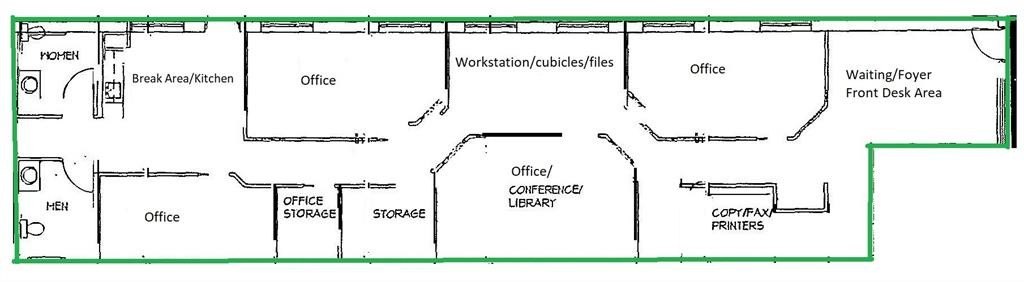
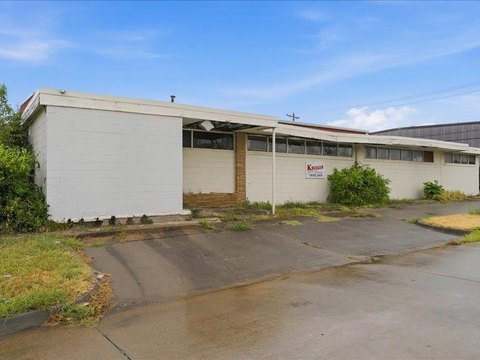
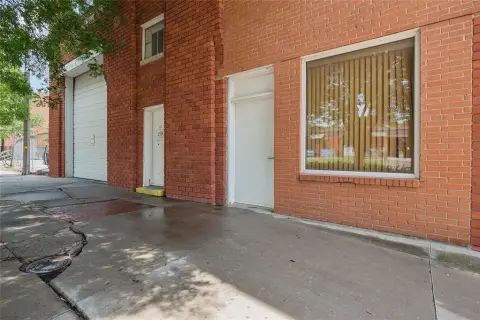
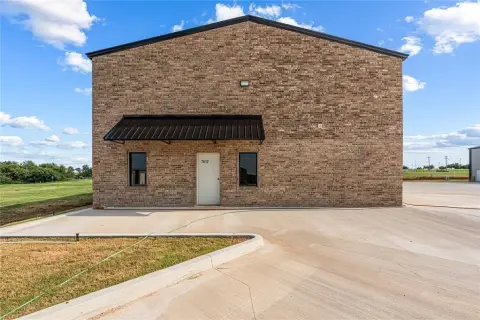
This 7,875-square-foot live-work property, built in 1953, brings together three distinct areas within one commercial building. The upper floor contains a furnished 2,250-square-foot apartment with two bedrooms, two full bathrooms, a private rooftop patio, and a small elevator. The office component includes a kitchenette, two bathrooms, and a connected two-car garage. A separate warehouse provides high ceilings, a large roll-up door, and access to a fenced storage area behind the building.
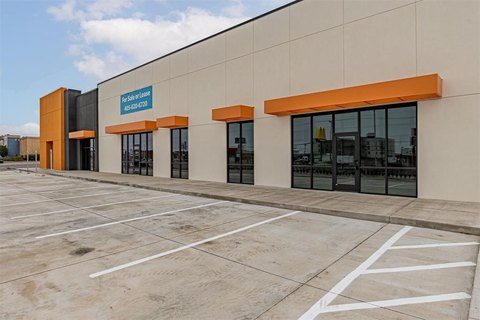
The property sits at 411 NW 5th Street in Oklahoma City, within walking distance of restaurants and businesses. A private parking lot east of the building provides additional parking for occupants, guests, or employees. Building systems and security features include electric heating, central air, electric cooling, 14 video surveillance cameras, a monitored alarm system, public water, public sewer, and brick construction. Zoning is Commercial, and the property is offered As-Is.
The property sits at 411 NW 5th Street in Oklahoma City, within walking distance of restaurants and businesses. A private parking lot east of the building provides additional parking for occupants, guests, or employees. Building systems and security features include electric heating, central air, electric cooling, 14 video surveillance cameras, a monitored alarm system, public water, public sewer, and brick construction. Zoning is Commercial, and the property is offered As-Is.
Key Highlights
- 7,875‑square‑foot commercial building on 0.2282 acres
- Furnished 2,250‑square‑foot upper‑level apartment with 2 bedrooms and 2 full bathrooms
- Office area includes kitchenette, 2 bathrooms, and a connecting 2‑car garage
Financial Insights
Estimated NOI and Cap Rate
NOI / Yr
$66,518
Cap Rate
7.43%
Suggested Prices Based on Cap Rates
Cap Rate 5%
$1,330,360
$1.3M
Cap Rate 7%
$950,257
$950.3K
Cap Rate 9%
$739,089
$739.1K
Market Conditions
NOI Build-Up for 7,875 SF
Gross rent
$127.6K $16.20/SF
− Vacancy
−$6.6K −$0.84/SF
EGI
$120.9K $15.36/SF
− OpEx
−$54.4K −$6.91/SF
NOI
$66.5K $8.45/SF
Area
Oklahoma City, OK
Vacancy
5.20%
Lease Rate
$16.20 /SF/Yr
Expense Ratio
45.00%
Simulate Cap Rate and NOI
Suggested Prices Based on Cap Rates
Cap Rate 5%
$1,330,360
Cap Rate 7%
$950,257
Cap Rate 9%
$739,089
Alternative Uses
Best Use
Office B
$1.60M
$1.40M – $1.87M
NOI $112,039 @ 7.0% cap · market cap 12.52%
Second Best
Mixed Use
$1.55M
$1.36M – $1.81M
NOI $108,675 @ 7.0% cap · market cap 12.14%
Theoretical Best
Specialty Retail
$2.69M
$2.36M – $3.14M
NOI $188,528 @ 7.0% cap · market cap 21.06%
Zoning and permitted uses should be independently verified with authorities.
How Realmo checks its estimates
Property Analytics
Unlock full access to Insights
Subscribe to Realmo Intelligence
Open Analytics
Current Use
Lease Details
1
Office units
Yes
Fenced yard
Location Intelligence
Trade Area within ½ mile
5,534
Businesses Nearby
Explore this area
Business Placement
Demographics for 73102, OK
3,072
Population
1,460
Households
2.1
Avg Household Size
35
Median Age
27%
College-Educated
86%
High-School Grad
0.8 sq mi
ZIP Area
3,840
Density / Sq Mi
$67,542
Median Household Income
$37,067
Median Earnings
$1,253
Median Rent
$212,500
Median Home Value
Check the figures for this property
Cap Rate, Value Estimation, Potential NOI and more
View Realmo Analytics
Market
Vacancy Rate% for Office in Oklahoma City, OK

Questions? Ask Rey
Realmo’s AI knows this listing — price, zoning, demand, history. Ask anything.






Frequently Asked Questions
What type of property is this?
Live-work space - Three-part commercial property combines a furnished apartment, office area, warehouse, and dedicated parking in central Oklahoma City.
Where is this live-work space located?
The property is located at 411 NW 5th Street Oklahoma City, OK.
What is the asking price?
The asking price for this property is $895,000.
What are key features of this property?
This property features: 7,875‑square‑foot commercial building on 0.2282 acres; Furnished 2,250‑square‑foot upper‑level apartment with 2 bedrooms and 2 full bathrooms; Office area includes kitchenette, 2 bathrooms, and a connecting 2‑car garage


