Eight-Unit Mixed-Use
For Sale
$1,850,000
406 E 7th, Long Beach, CA 90813
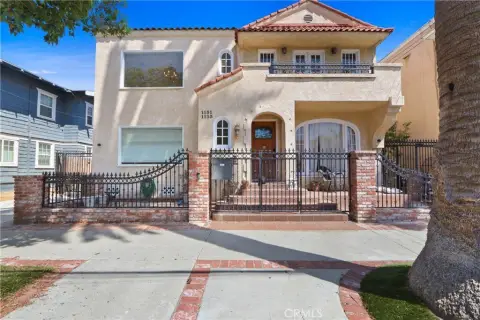
Three detached buildings combine five residences with three commercial units in a walkable downtown Long Beach setting.
Property Size7,505 SF
Days on Market92
Property Features for 406 E 7th
General Information
Standard status
Active
Size
7,505 SF
Property subtype
Mixed Use
Zoning
LBPD-30
Financials
Gross Income
$201,576
Gross Rent Multiplier
10.05
Site & Location
Corner Location
Yes
Road Access
Yes
Public Transit
Yes
Additional Details
Multifamily Units
5
Building Details
Building Size
7,505 SF
Year Built
1908
Buildings
3
Stories
2
Tenancy
Multi
Listing Agency:
Sage Real Estate Group, Inc.
Listed By:
Juan Huizar · License #01417642
(562) 307-0838
Source:
Nolanrossre.kw
Added: Jul 15
Changed: Oct 10
Last Checked: Oct 12 at 4:40PM
Displayed information is deemed reliable but is not guaranteed and should be independently verified. All listing content including descriptions, pricing, images are the copyrighted material of Sage Real Estate Group, Inc.
Investment Insights
Based on property information with market context.
This mixed-use property includes eight units across three detached structures. The residential component comprises a two-bedroom, one-bath bungalow, two apartments positioned above retail space, and a two-story duplex with one residence on each level. Three ground-floor commercial units are located within the mixed-use building, creating a combination of residential and retail occupancy across the site. The property was built in 1908.
The buildings span 406–420 E 7th Street and 652–654 Elm Avenue in Long Beach, at the corner of 7th Street and Lime Avenue. The site provides 150 feet of frontage along E 7th Street, with 50 feet of depth along both Linden and Elm Avenues. It is zoned LBPD-30 within the Downtown Planned Development Zone and sits on the border of the East Village Arts District, near downtown restaurants, retail, nightlife, cultural attractions, public transportation, and major employment centers. The reported GRM is 10.05.
The buildings span 406–420 E 7th Street and 652–654 Elm Avenue in Long Beach, at the corner of 7th Street and Lime Avenue. The site provides 150 feet of frontage along E 7th Street, with 50 feet of depth along both Linden and Elm Avenues. It is zoned LBPD-30 within the Downtown Planned Development Zone and sits on the border of the East Village Arts District, near downtown restaurants, retail, nightlife, cultural attractions, public transportation, and major employment centers. The reported GRM is 10.05.
Key Highlights
- Eight units across three detached buildings: five residential and three commercial
- Unit mix includes a 2‑bedroom, 1‑bathroom bungalow, two apartments, three retail units, and a residential duplex
- 150 feet of frontage along E 7th Street
Financial Insights
Estimated NOI and Cap Rate
NOI / Yr
$158,966
Cap Rate
8.59%
Suggested Prices Based on Cap Rates
Cap Rate 5%
$3,179,320
$3.2M
Cap Rate 7%
$2,270,943
$2.3M
Cap Rate 9%
$1,766,289
$1.8M
Market Conditions
NOI Build-Up for 7,505 SF
Gross rent
$301.7K $40.20/SF
− Vacancy
−$12.7K −$1.69/SF
EGI
$289.0K $38.51/SF
− OpEx
−$130.1K −$17.33/SF
NOI
$159.0K $21.18/SF
Area
ZIP 90813
Vacancy
4.20%
Lease Rate
$40.20 /SF/Yr
Expense Ratio
45.00%
Simulate Cap Rate and NOI
Suggested Prices Based on Cap Rates
Cap Rate 5%
$3,179,320
Cap Rate 7%
$2,270,943
Cap Rate 9%
$1,766,289
Alternative Uses
Best Use
Multifamily LT 5
$2.46M
$2.16M – $2.88M
NOI $172,501 @ 7.0% cap · market cap 9.32%
Second Best
Apartment 5plus
$2.27M
$1.99M – $2.65M
NOI $158,966 @ 7.0% cap · market cap 8.59%
Theoretical Best
—
—
same as Best Use
Zoning and permitted uses should be independently verified with authorities.
How Realmo checks its estimates
Property Analytics
Unlock full access to Insights
Subscribe to Realmo Intelligence
Open Analytics
Current Use
Lease Details
5
Residential units
Multi-tenant
Tenancy
Yes
Paved road access
Location Intelligence
Trade Area within ½ mile
5,153
Businesses Nearby
Explore this area
Business Placement
Demographics for 90813, CA
54,565
Population
18,603
Households
2.9
Avg Household Size
32
Median Age
16%
College-Educated
63%
High-School Grad
3.1 sq mi
ZIP Area
17,602
Density / Sq Mi
$50,302
Median Household Income
$31,450
Median Earnings
$1,578
Median Rent
$543,700
Median Home Value
Check the figures for this property
Cap Rate, Value Estimation, Potential NOI and more
View Realmo Analytics
Market
Vacancy Rate% for Multifamily in West region

Questions? Ask Rey
Realmo’s AI knows this listing — price, zoning, demand, history. Ask anything.




Frequently Asked Questions
What type of property is this?
Mixed-use property - Three detached buildings combine five residences with three commercial units in a walkable downtown Long Beach setting.
Where is this mixed-use property located?
The property is located at 406 E 7th Long Beach, CA.
What is the asking price?
The asking price for this property is $1,850,000.
What are key features of this property?
This property features: Eight units across three detached buildings: five residential and three commercial; Unit mix includes a 2‑bedroom, 1‑bathroom bungalow, two apartments, three retail units, and a residential duplex; 150 feet of frontage along E 7th Street


