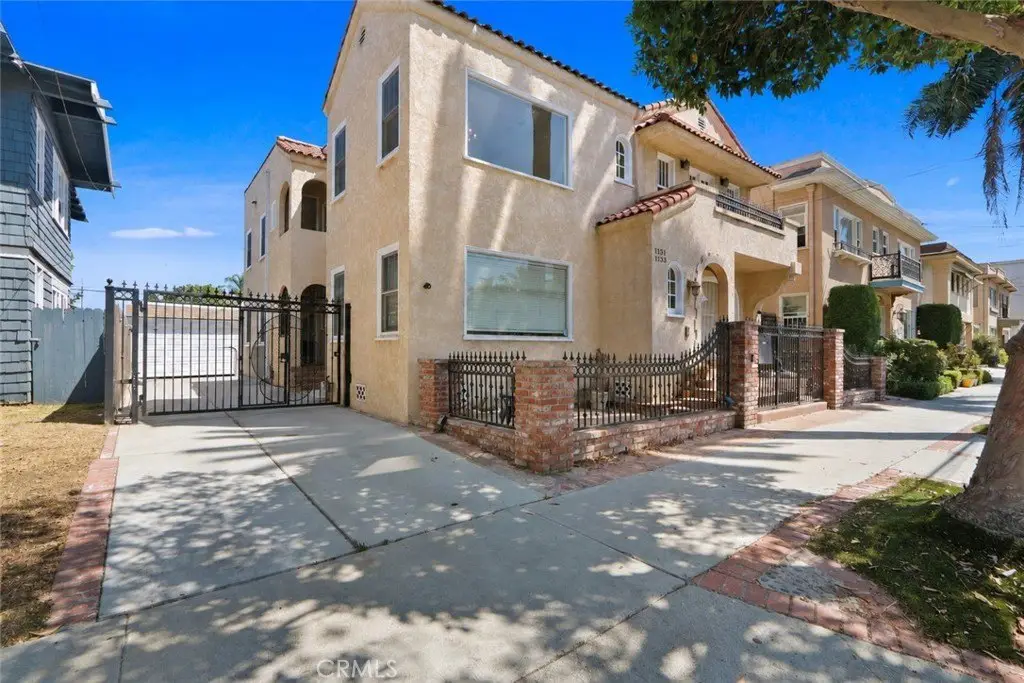
Renovated Spanish Duplex with
For Sale
$1,625,000
1131 E 2nd, Long Beach, CA 90802
Long Beach, CA
Property Size3,284 SF
Lot Size0.10 Acres
Price / SF$494.82
Days on Market49
Property Features for 1131 E 2nd
General Information
Property type
Residential Multi Family
Property subtype
Duplex
Bedrooms
4
Bathrooms
4
Full bathrooms
4
Rooms
Laundry Room, Bathroom 1, Bedroom 4, Bedroom 2, Bathroom 2, Bathroom 3, Bathroom 4, Bedroom 1, Bedroom 3
Parking
2
Interior features
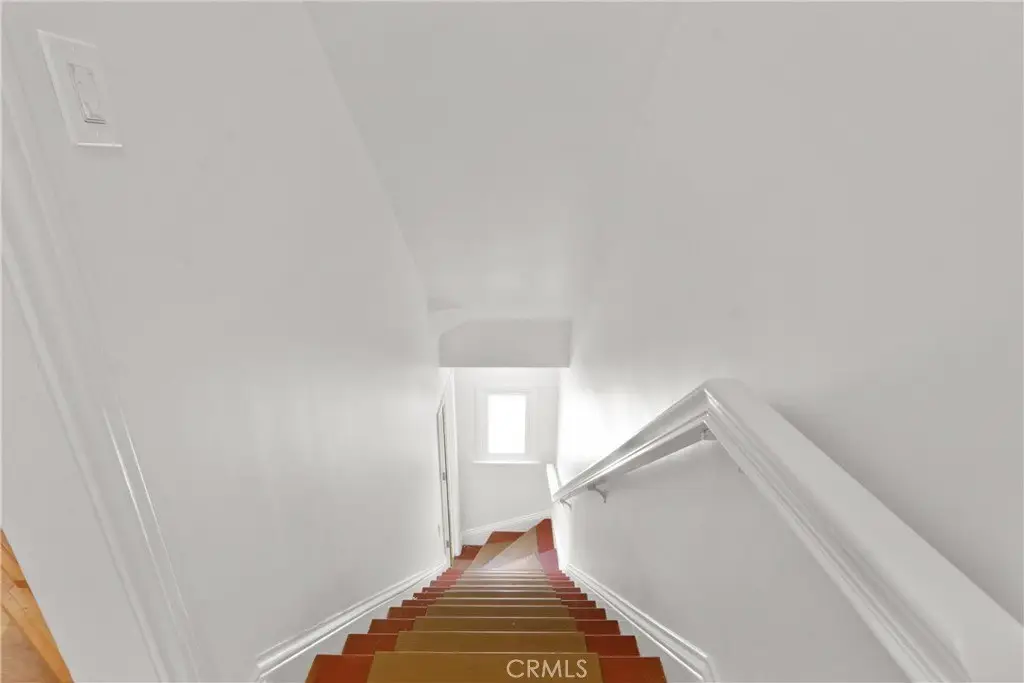
Balcony, 2 Staircases
Fireplace
1
Subdivision
Alamitos Beach (AB)
Lot features
Back Yard
Elementary school district
Long Beach Unified
Middle school district
Long Beach Unified
High school district
Long Beach Unified
Directions
On 2nd Street
Standard status
Active
APN
7265010030
Size
3,284 SF
Lot size
0.10 Acres
Utilities
Sewer type
Public Sewer
Heating system
Central
Cooling system
Window Unit(s), Wall/Window Unit(s)
Water source
Public
Amenities
central heat
whole-house speaker system
fireplace
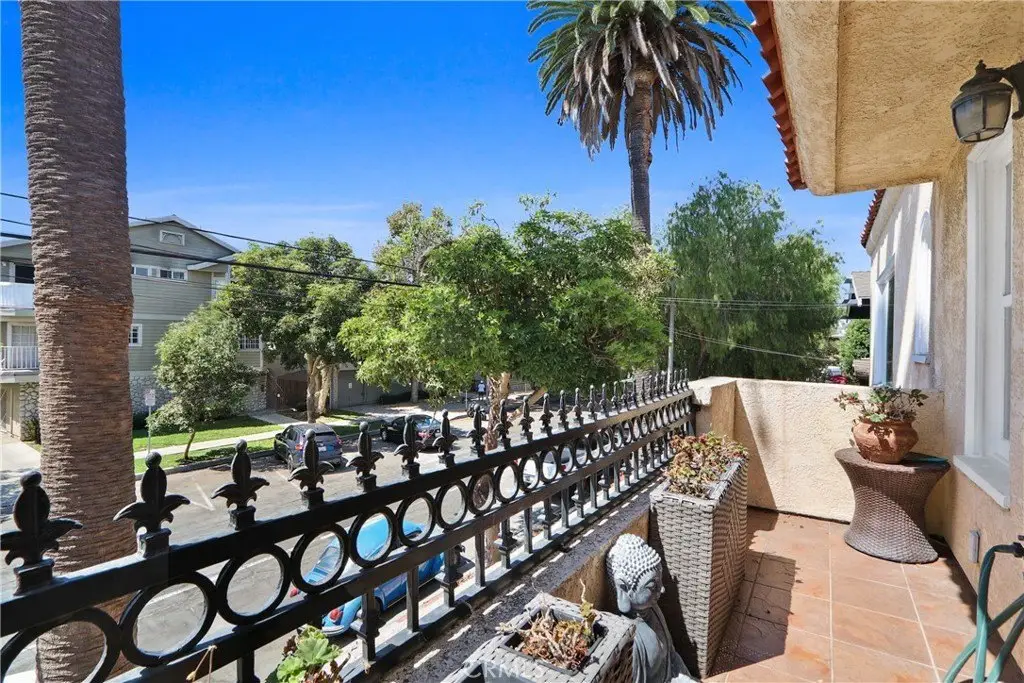
private balcony
laundry room
roof access
private backyard patio
automatic security gate
EV 240v plug
Building Details
Year built
1926
Floors in Building
3
Number of units
2
Listing Agency:
eXp Realty of California Inc
(888) 584-9427
Listed By:
William Lenocker · License #01357888
(714) 270-7355
Added: Aug 27
Changed: Oct 14
Last Checked: Oct 14 at 12:06PM
MLS# PW26188186
Copyright © 2026 California Regional Multiple Listing Service, Inc. All rights reserved. All information provided by the listing agent/broker is deemed reliable but is not guaranteed and should be independently verified.
Investment Insights
Based on property information with market context.
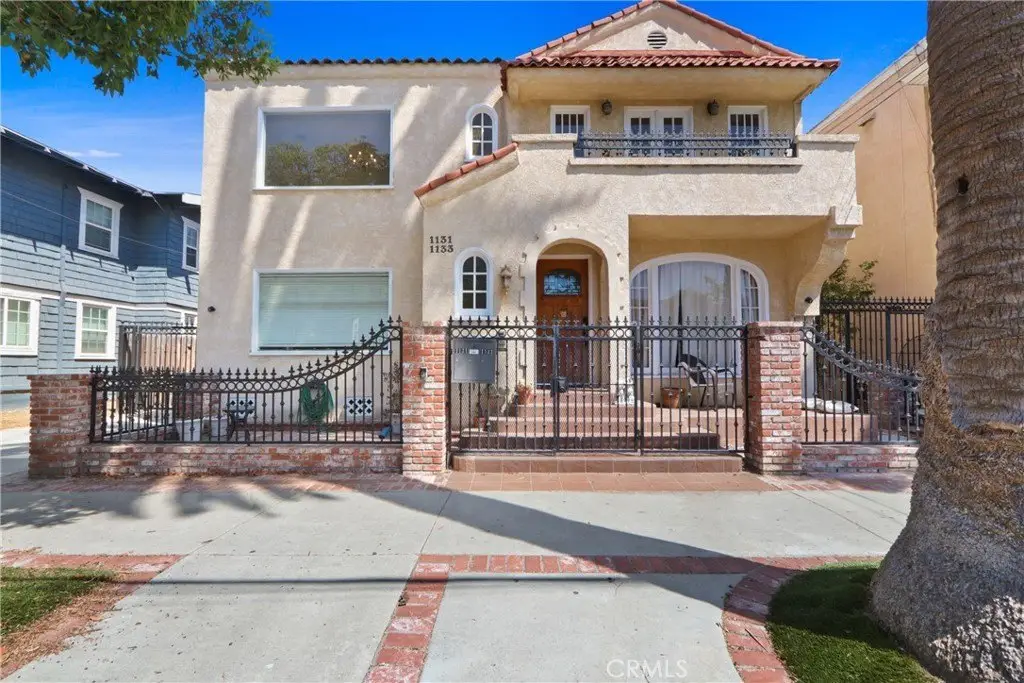
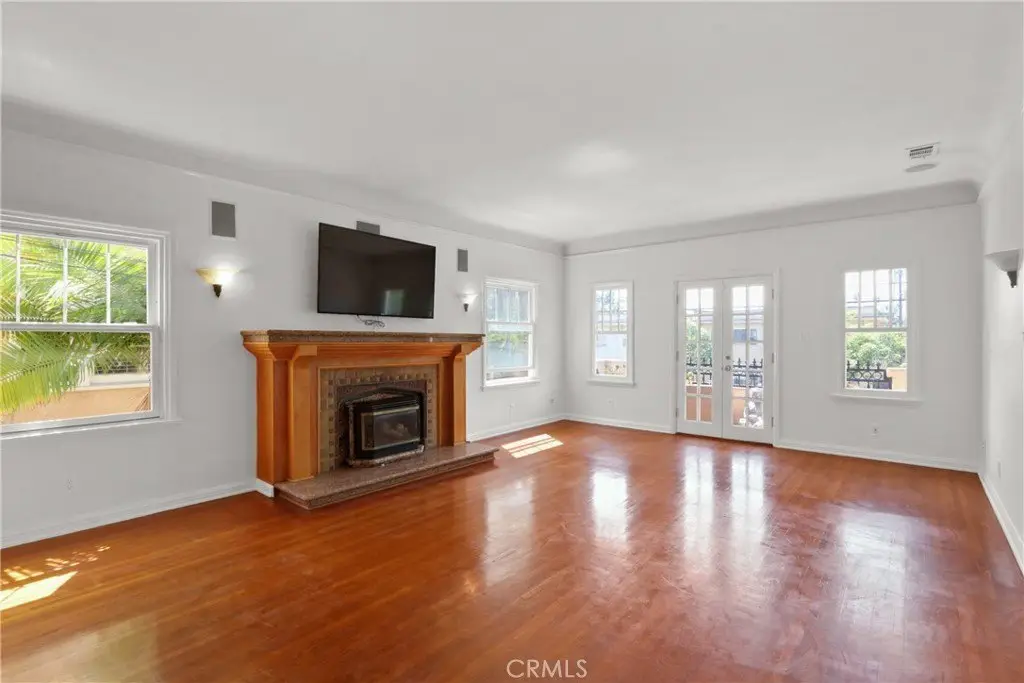
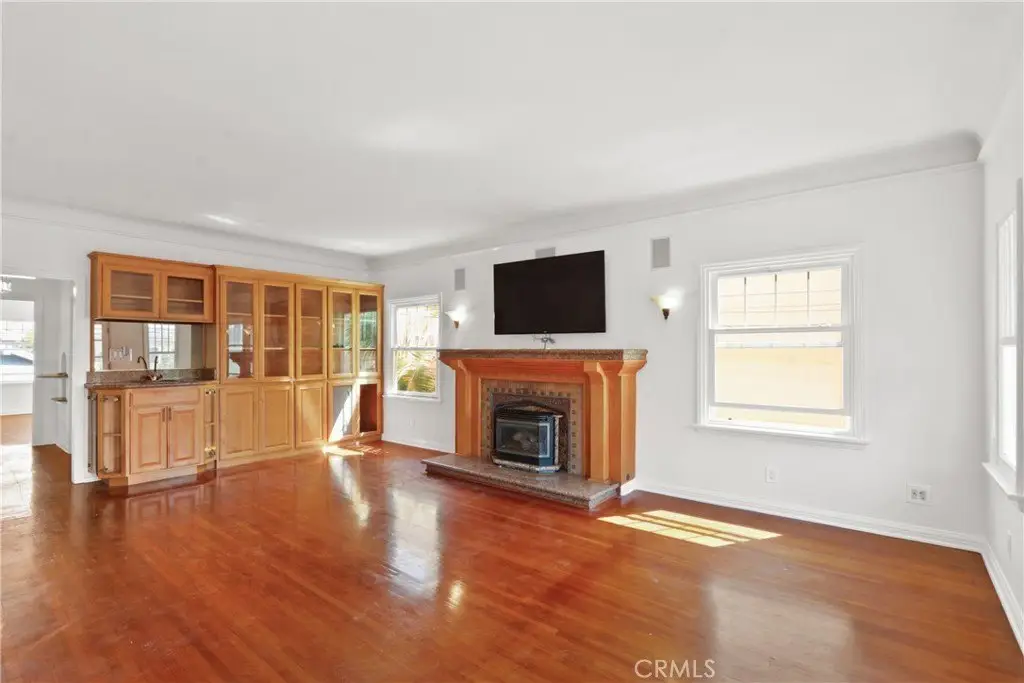
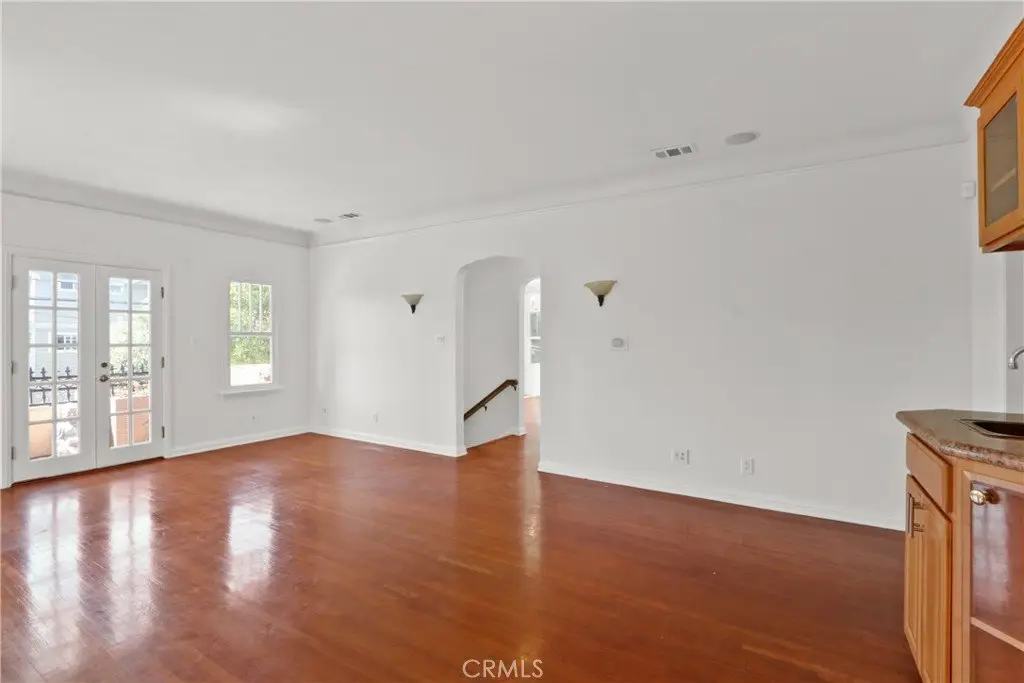
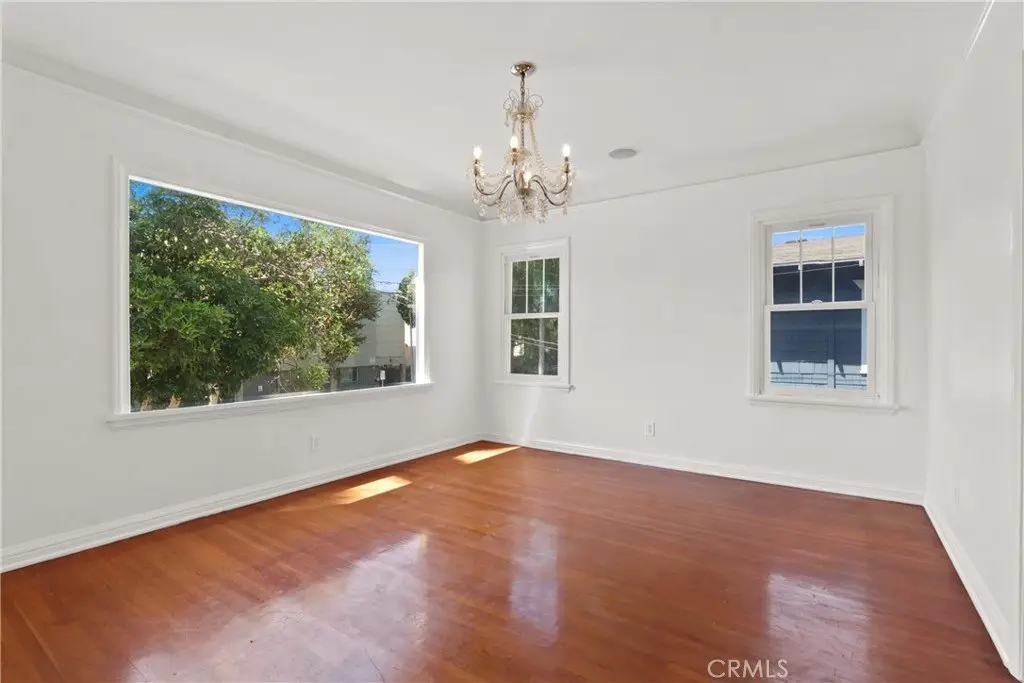
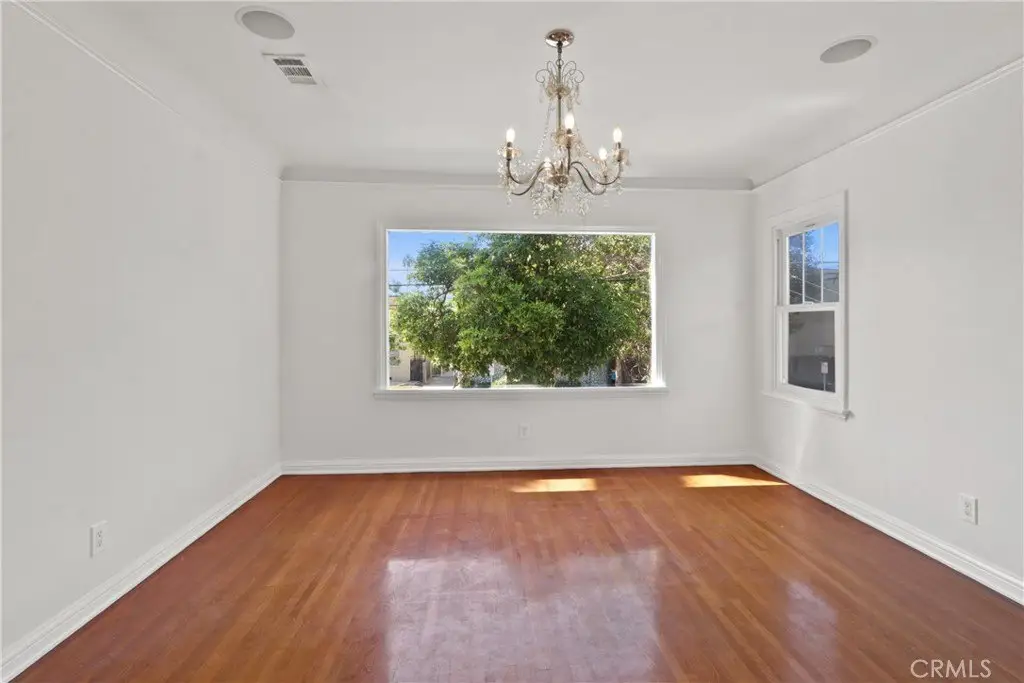
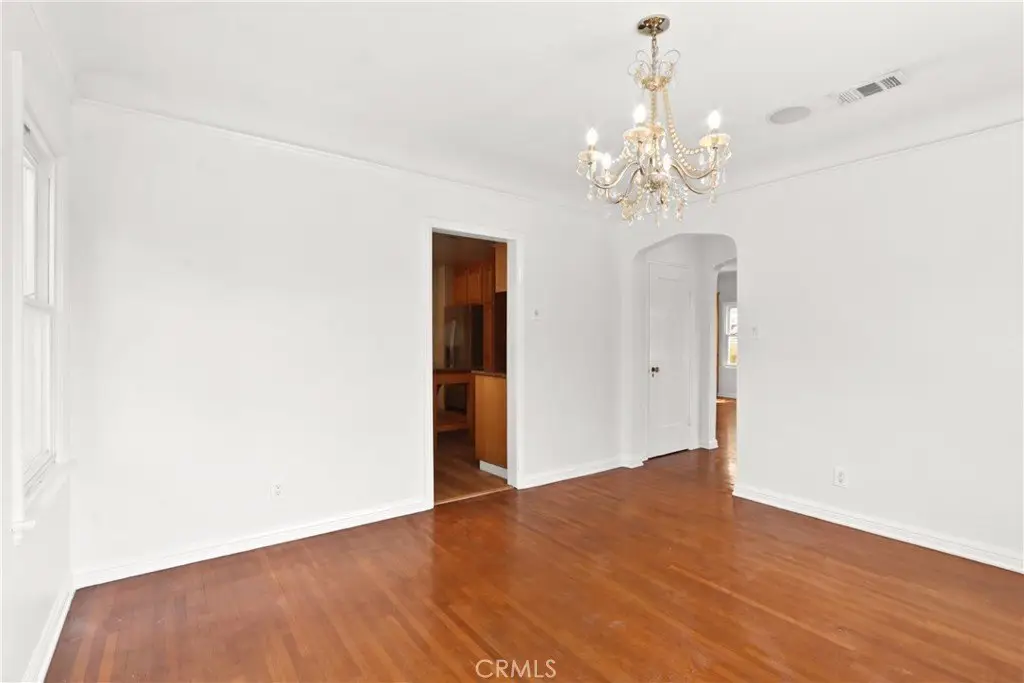
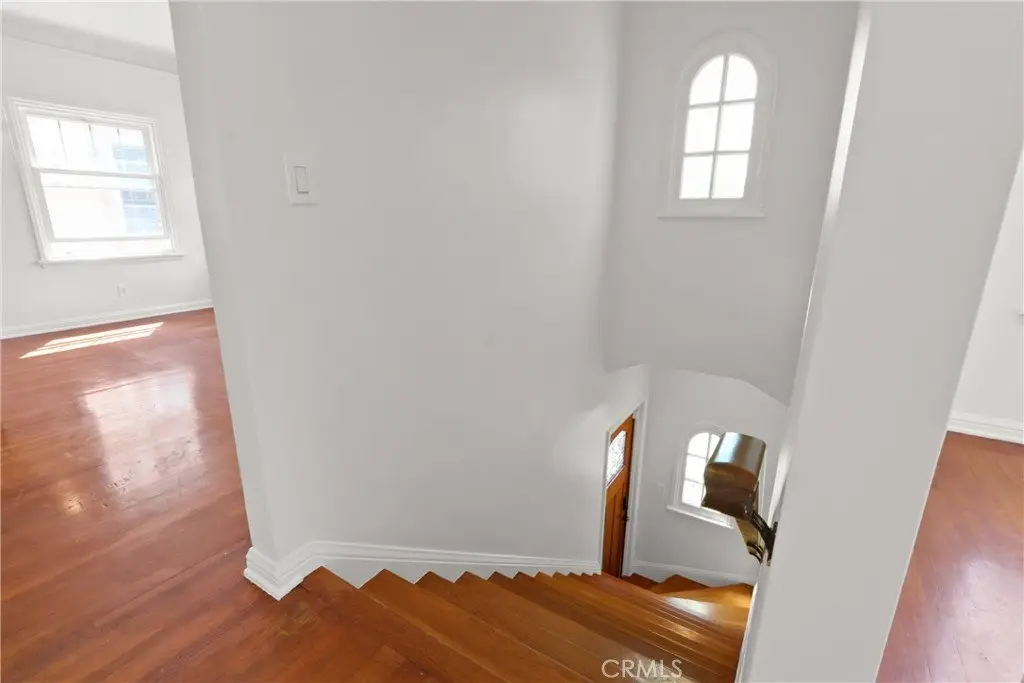
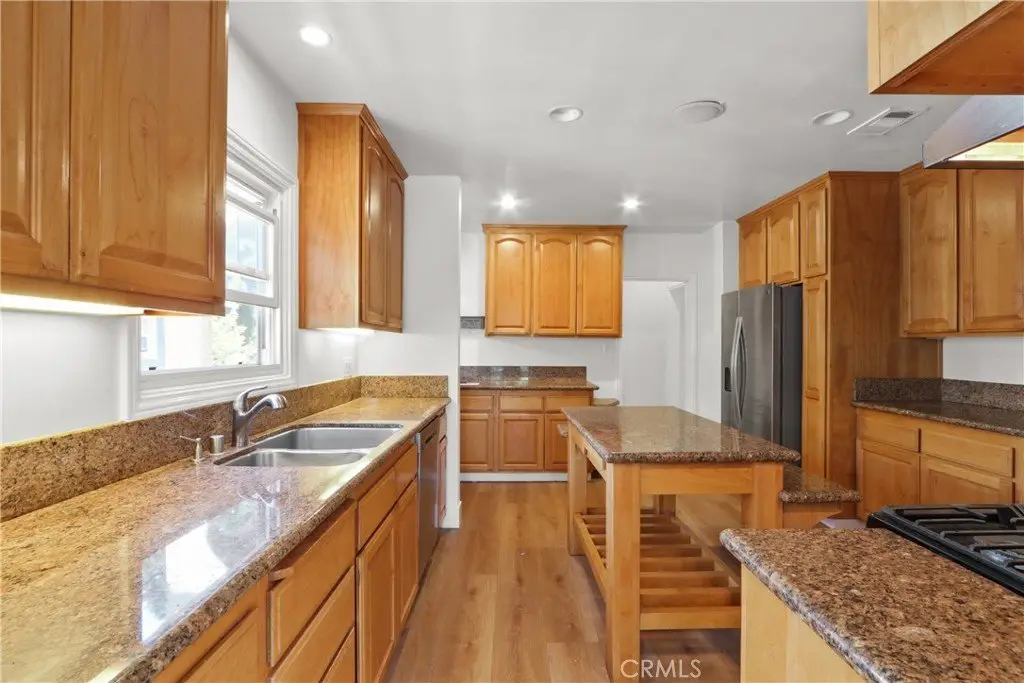
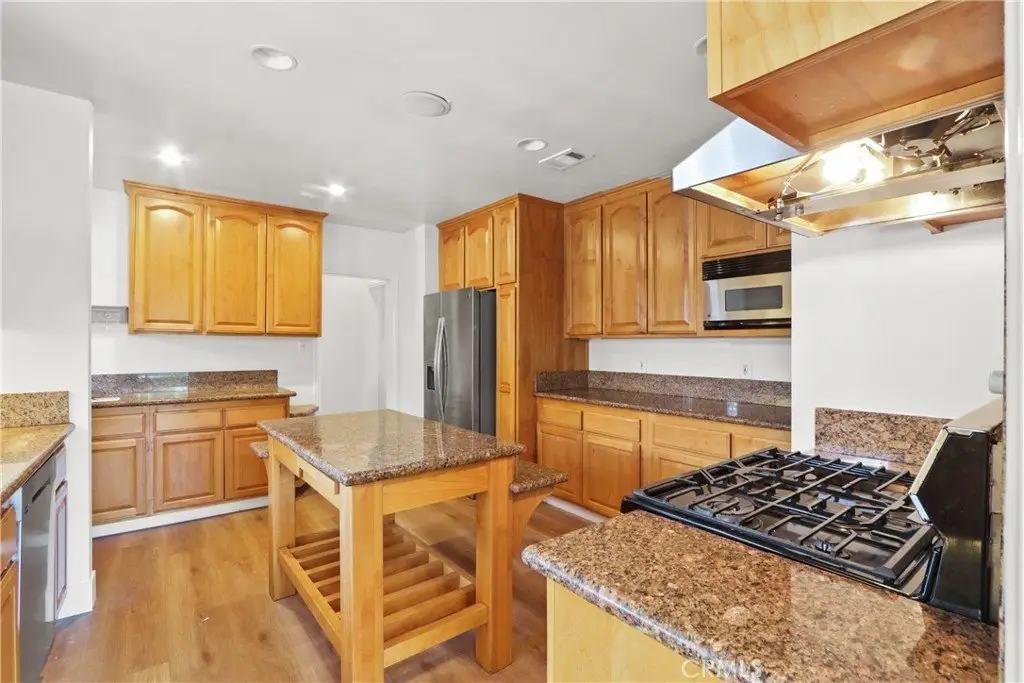
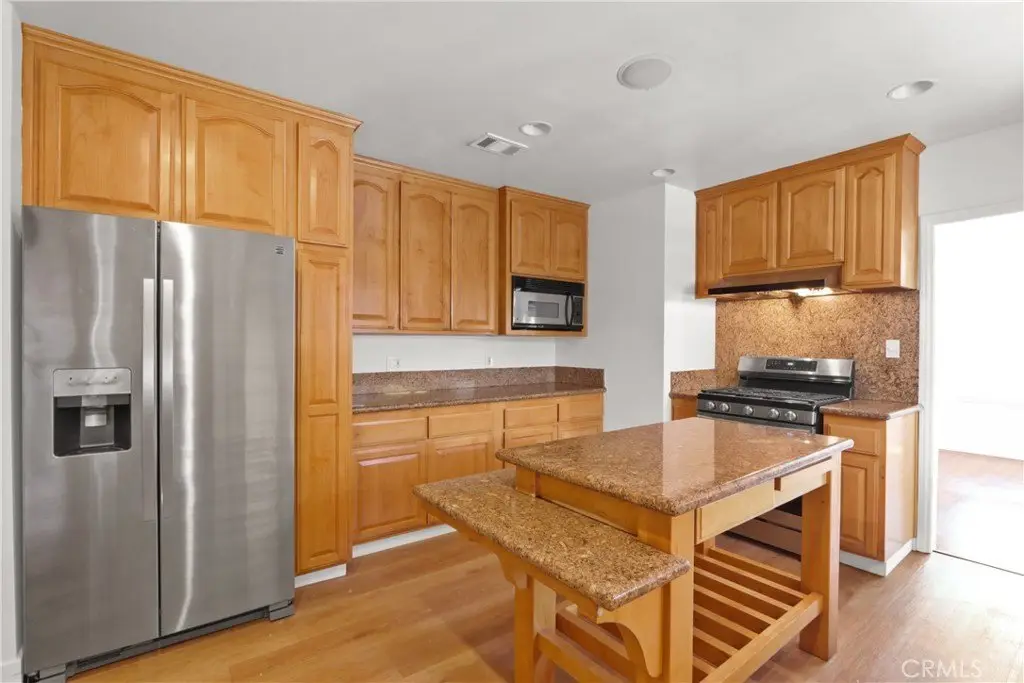
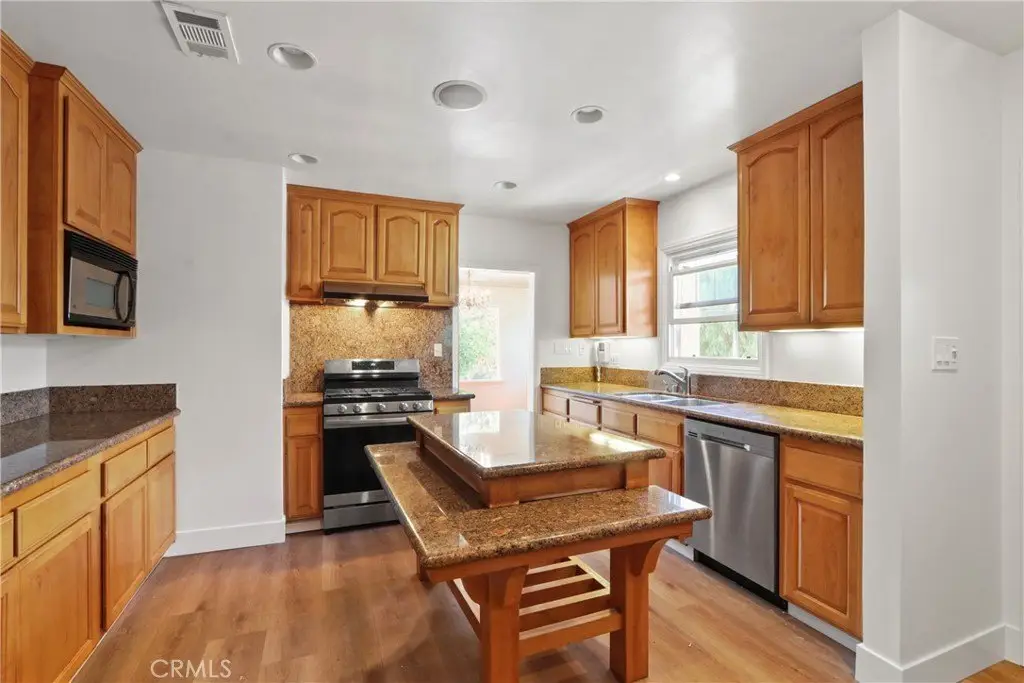
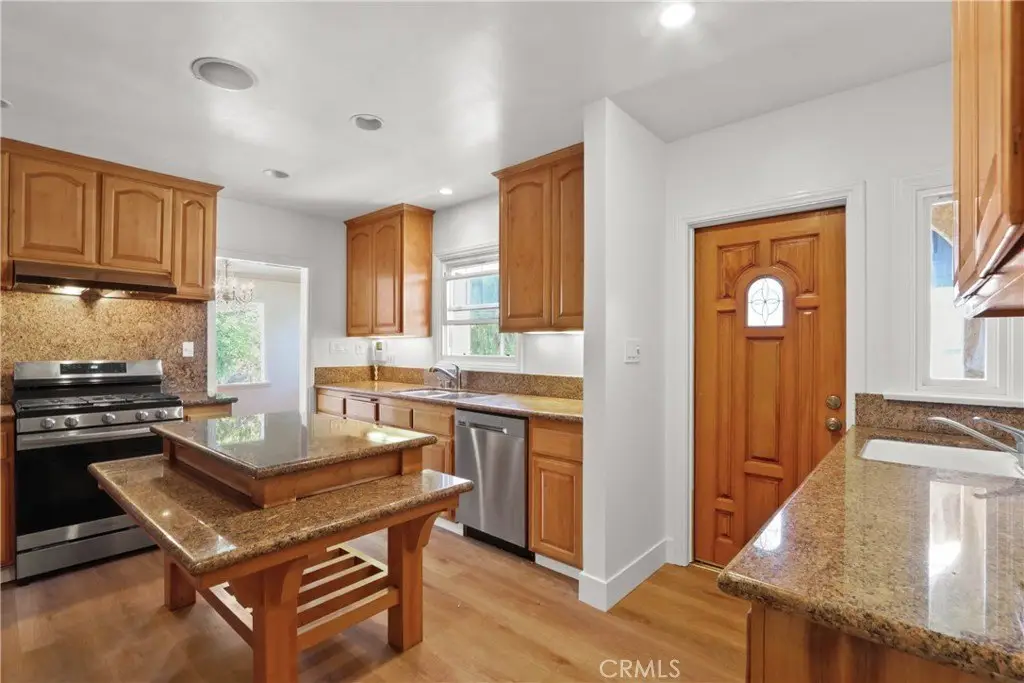
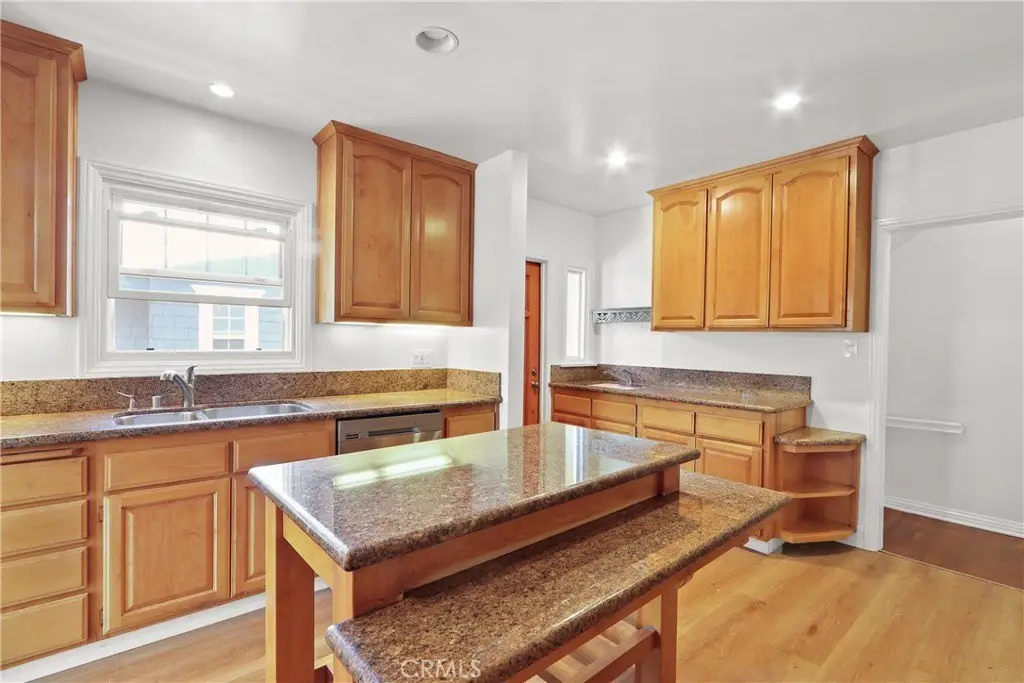
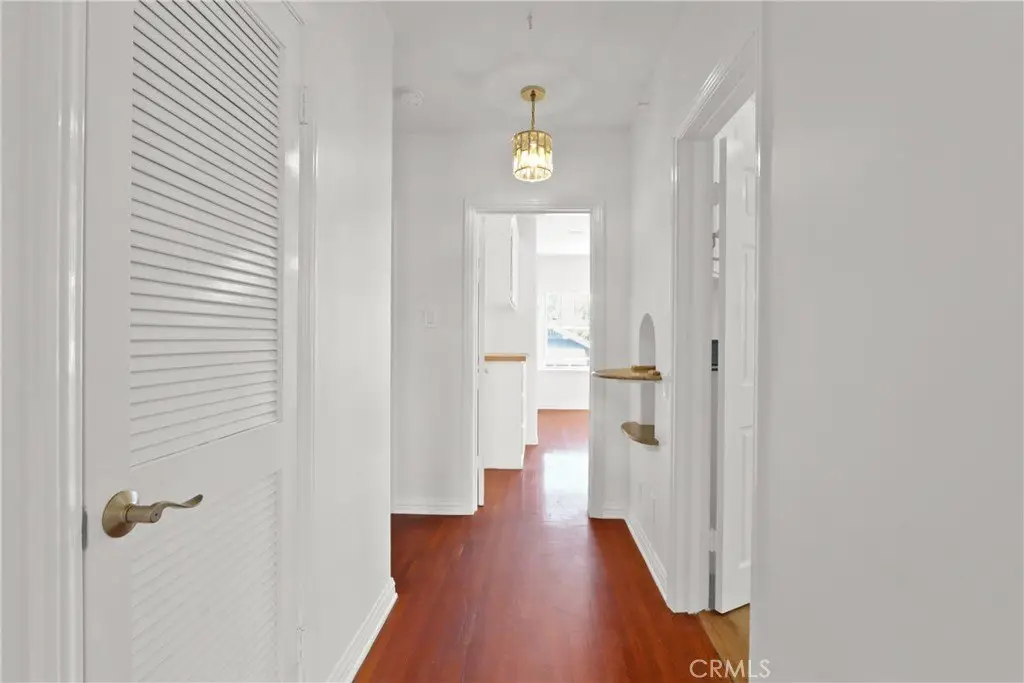
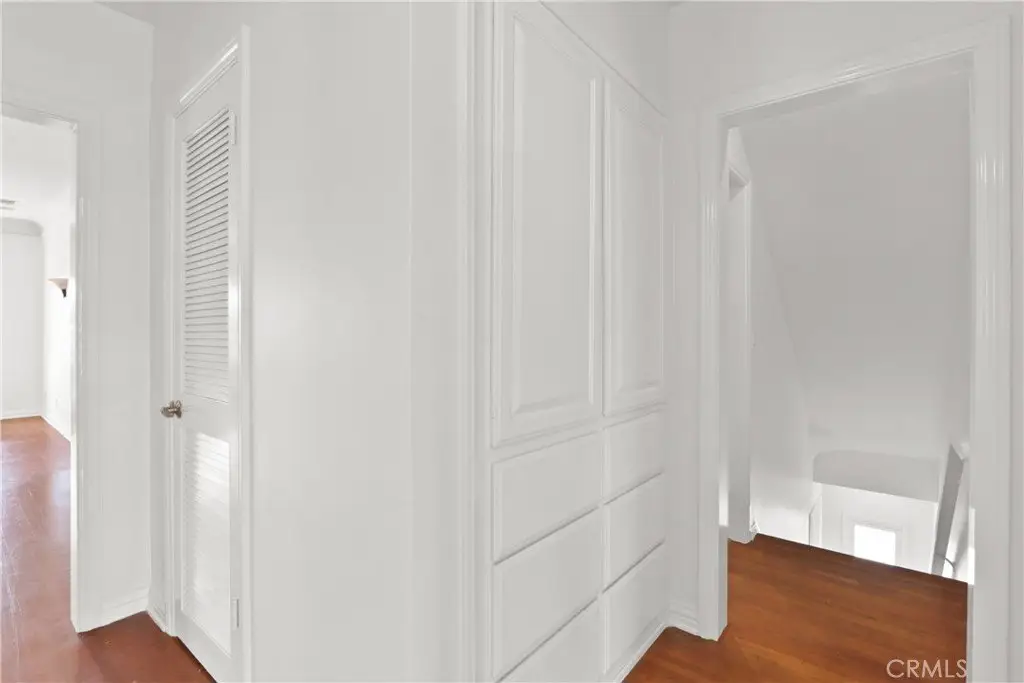
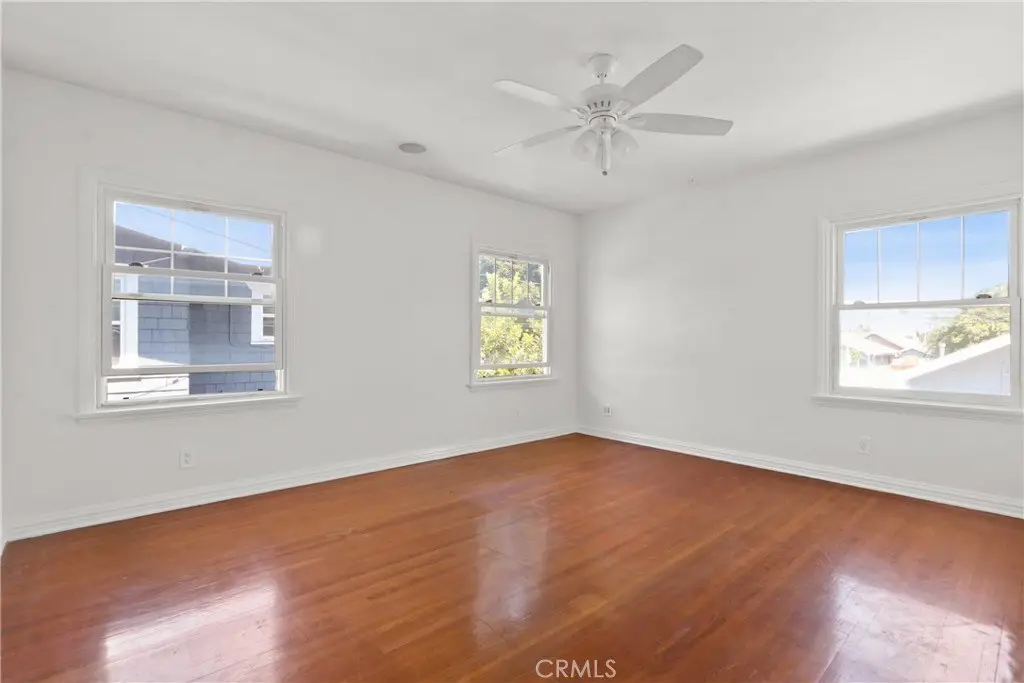
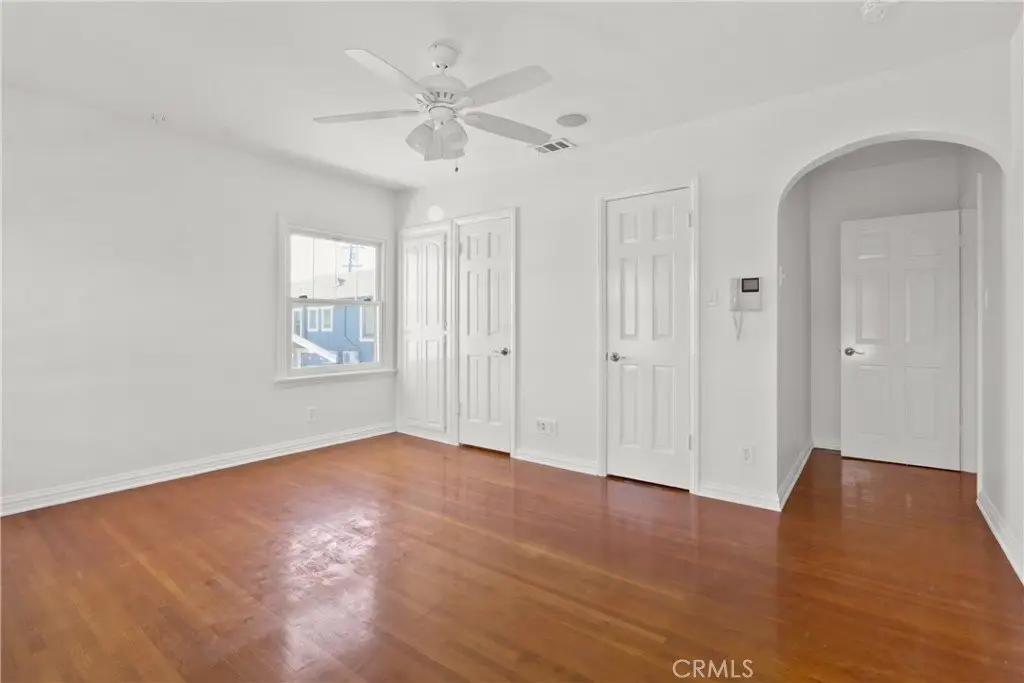
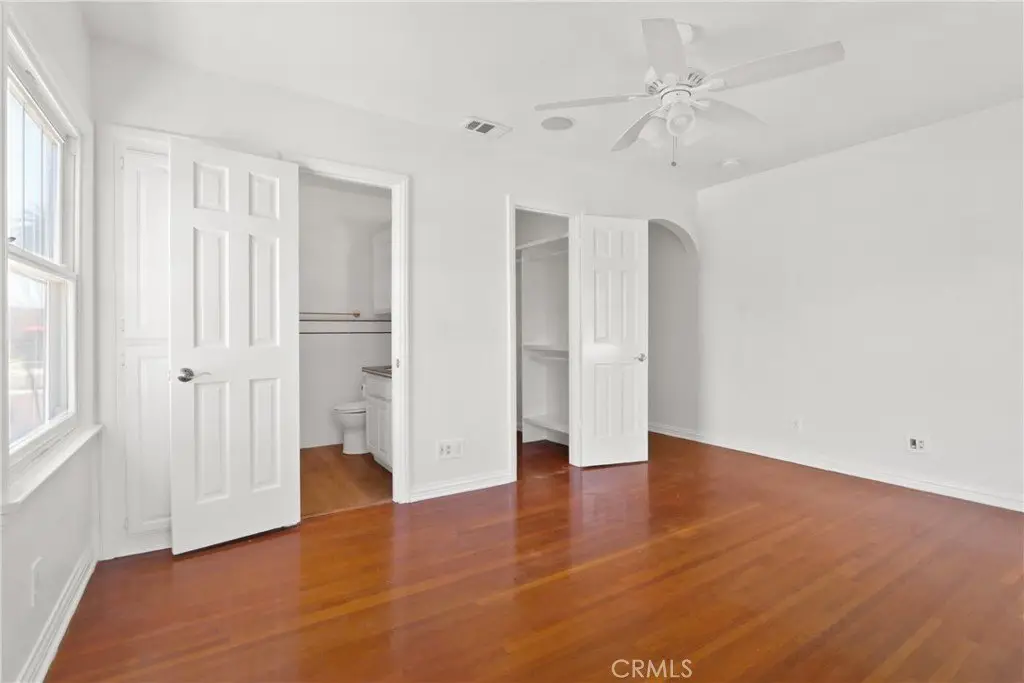
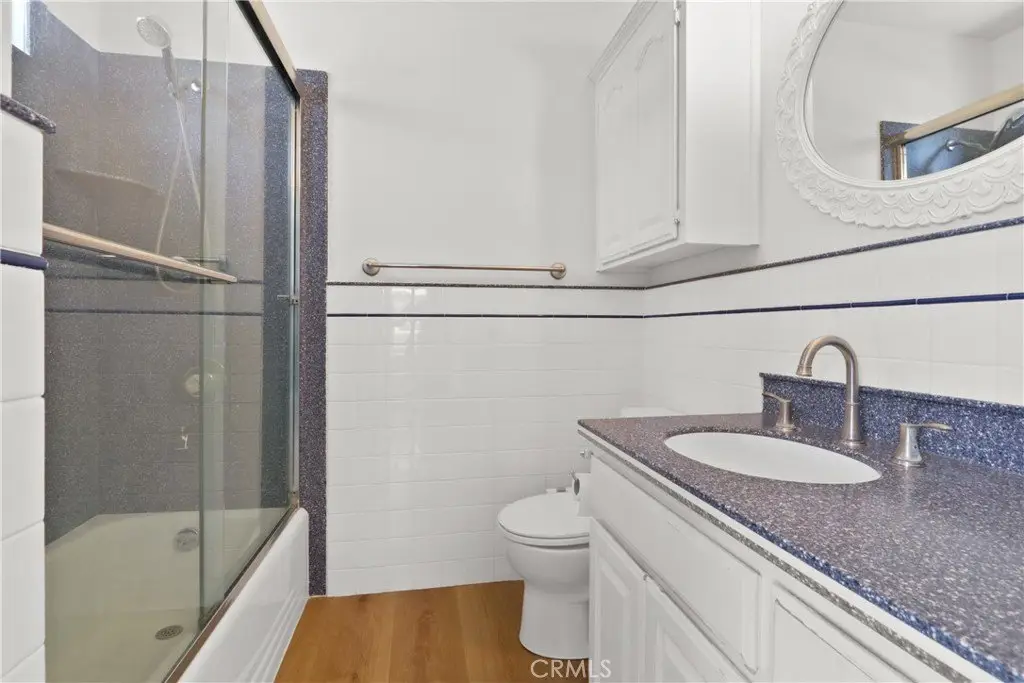
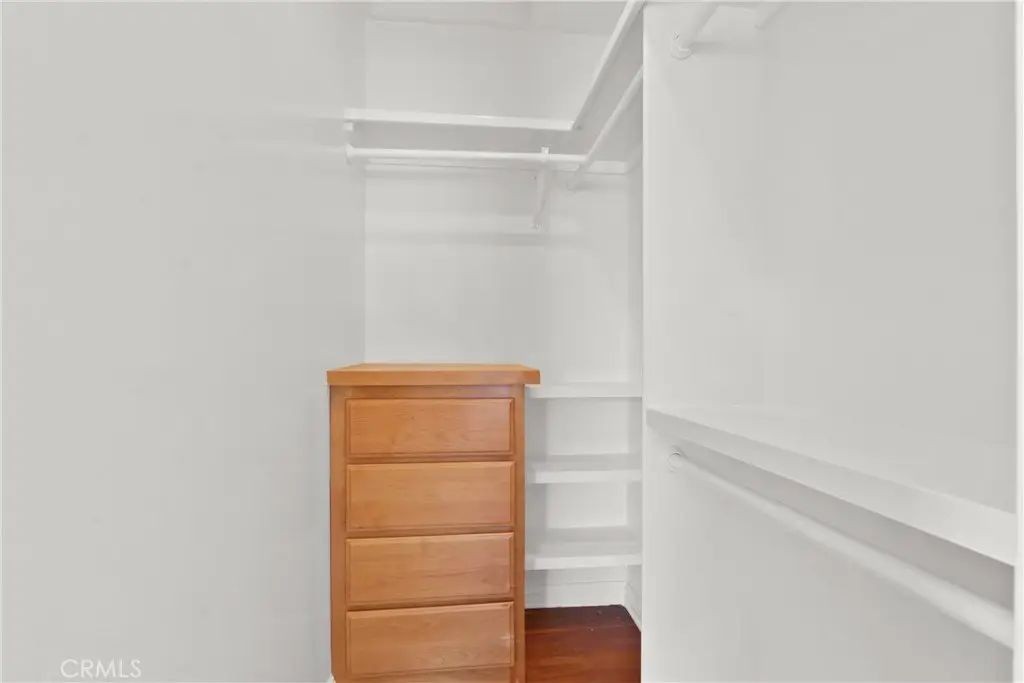
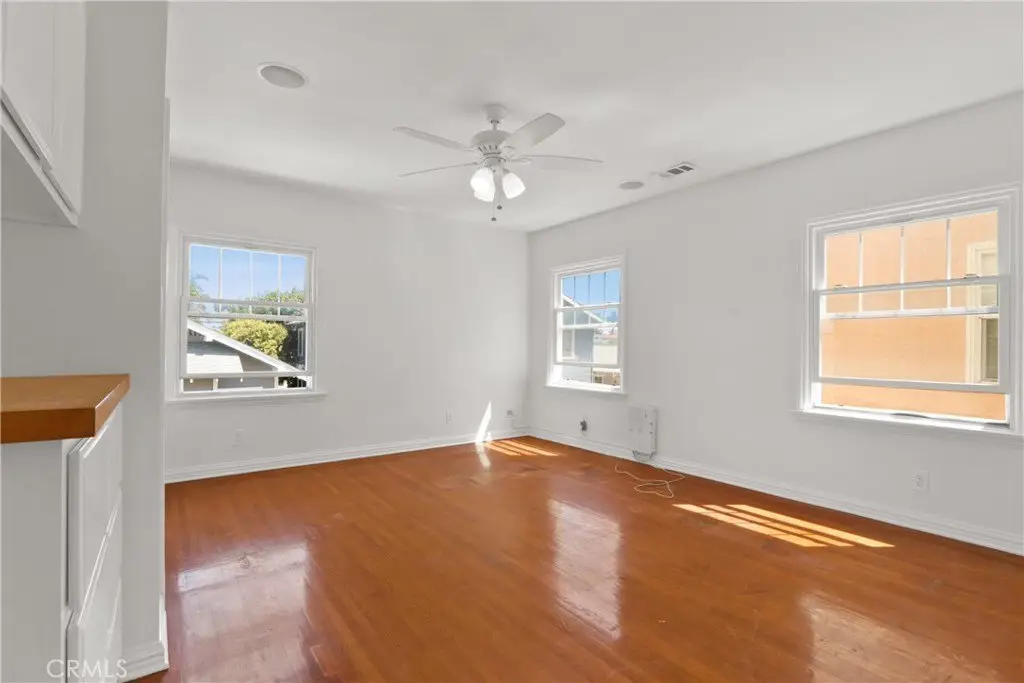
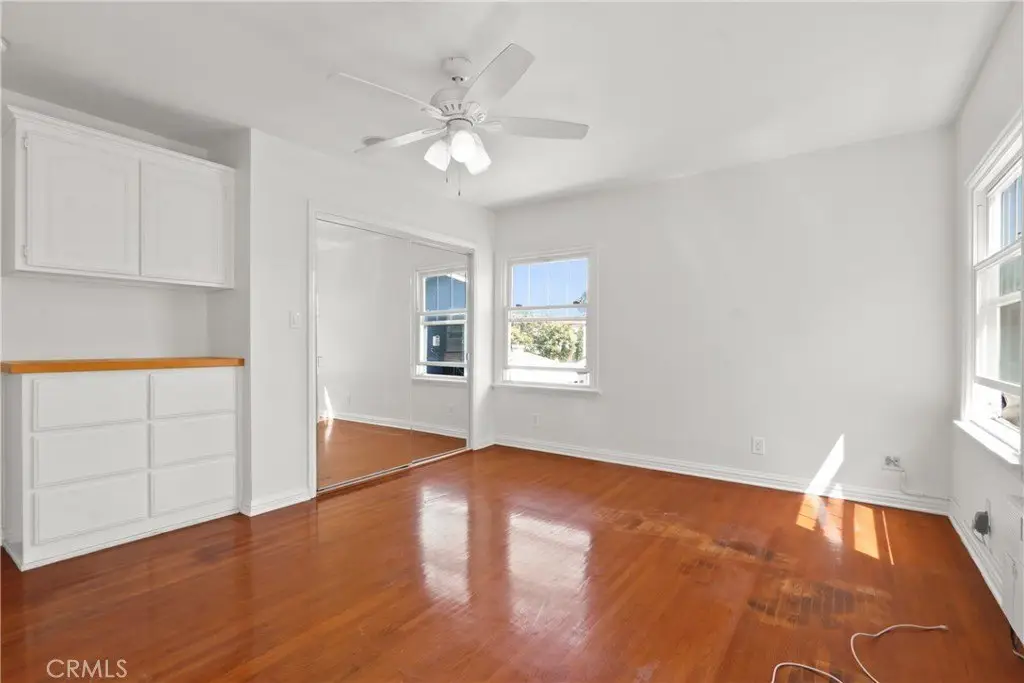
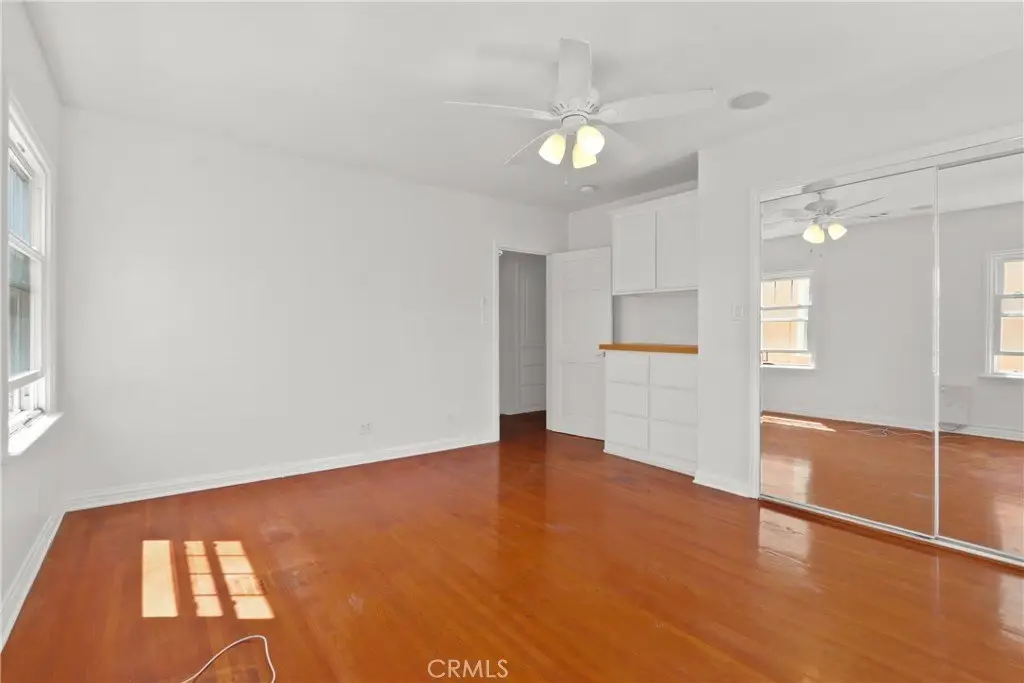
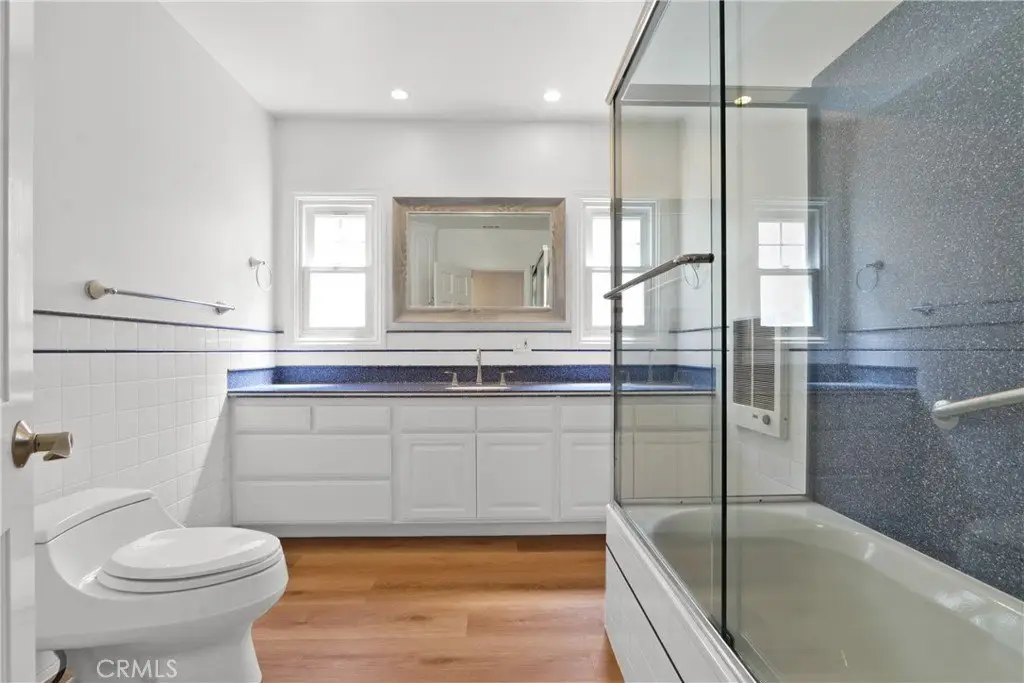
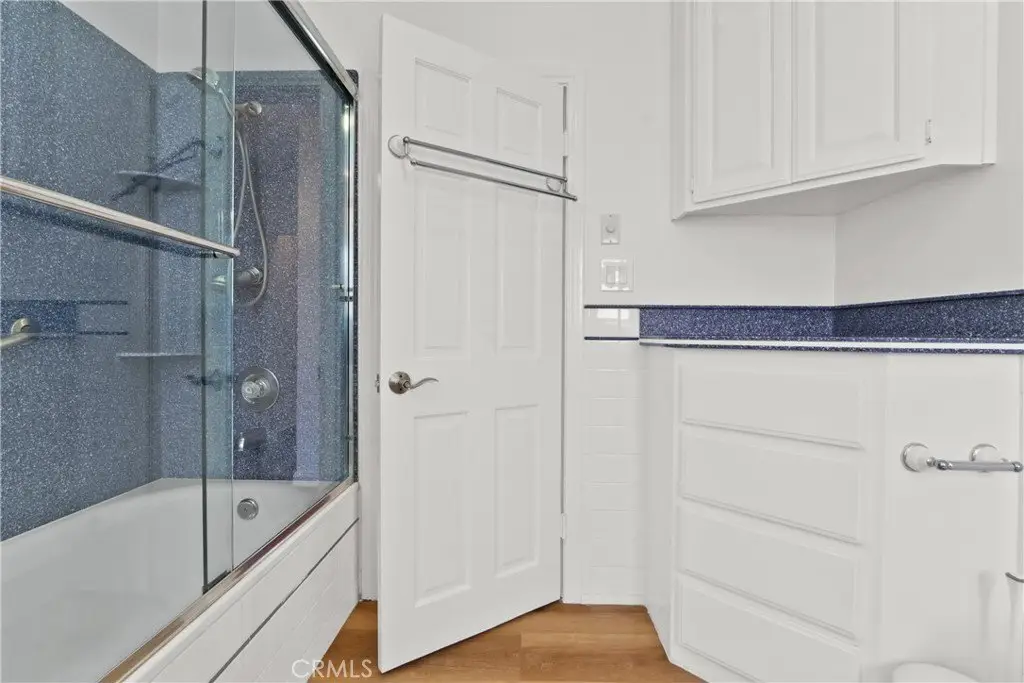
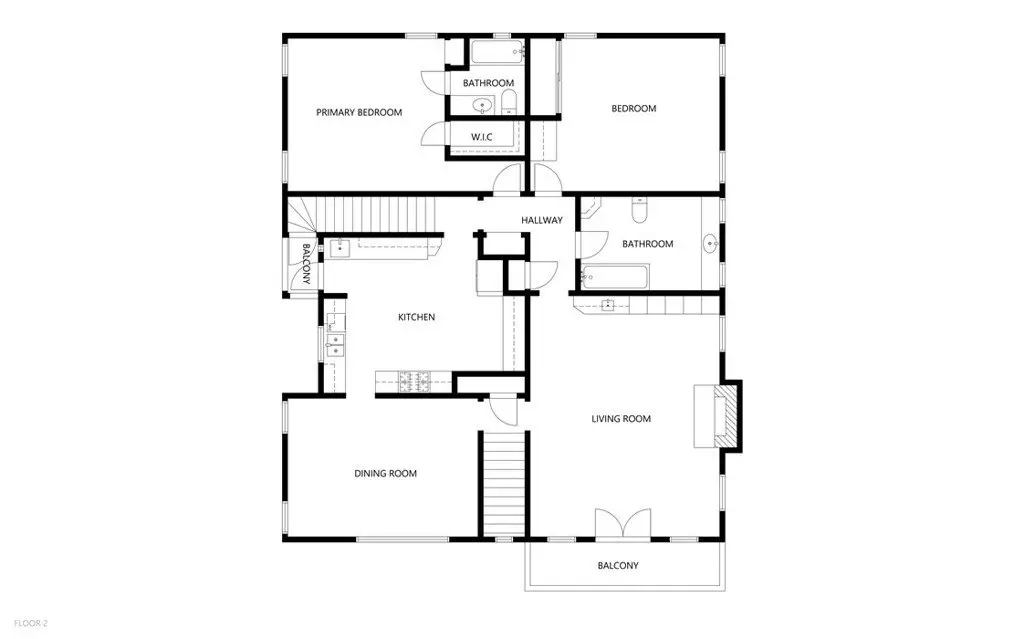
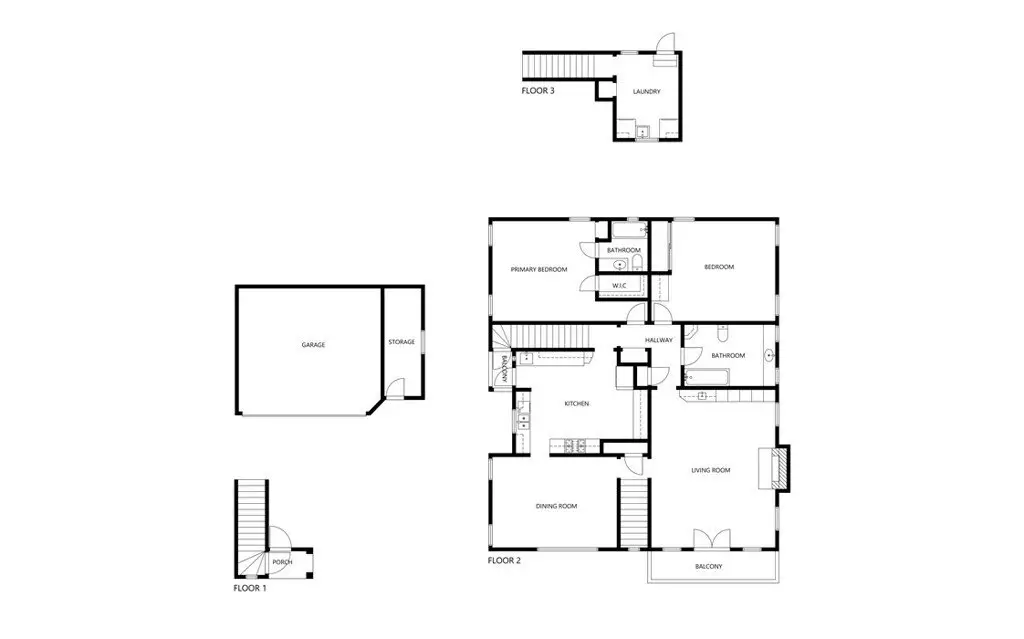
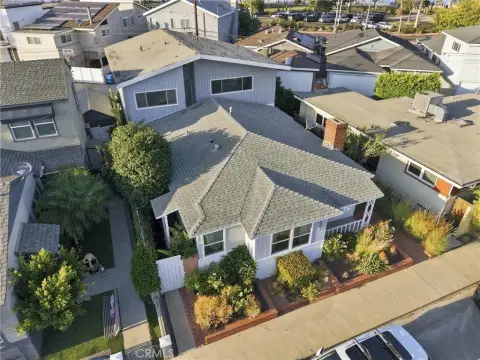
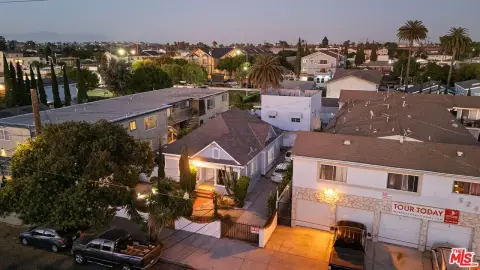
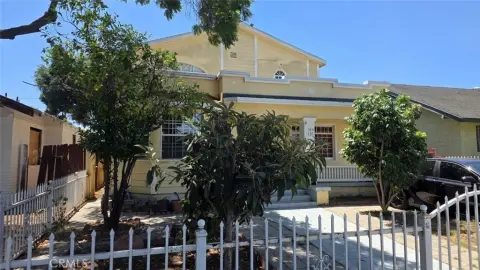
Built in 1926, this 3,284-square-foot Spanish duplex contains two approximately 1,600-square-foot residences arranged on separate levels. Each home includes two bedrooms, two bathrooms, a formal dining room, an oversized living room, and an eat-in kitchen with granite counters, an island, stainless appliances, and substantial storage. The dining areas can be adapted for third bedrooms. Original character remains through arched windows, coved ceilings, and hardwood floors, while the property has updated wiring, electrical panels, plumbing, ducting, cabinetry, lighting, and other finishes.
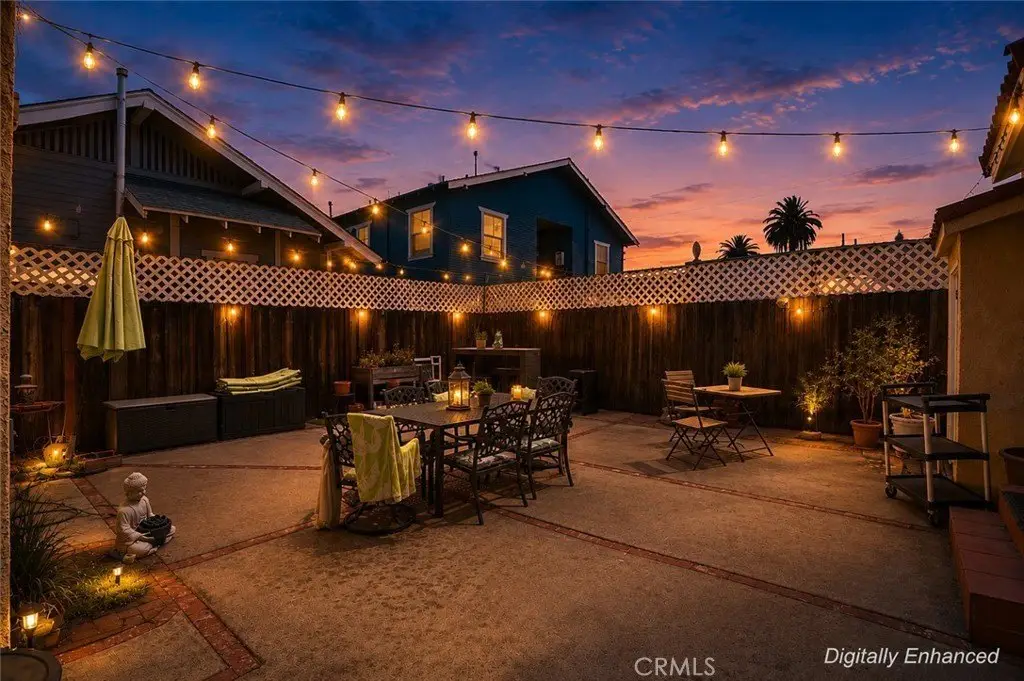
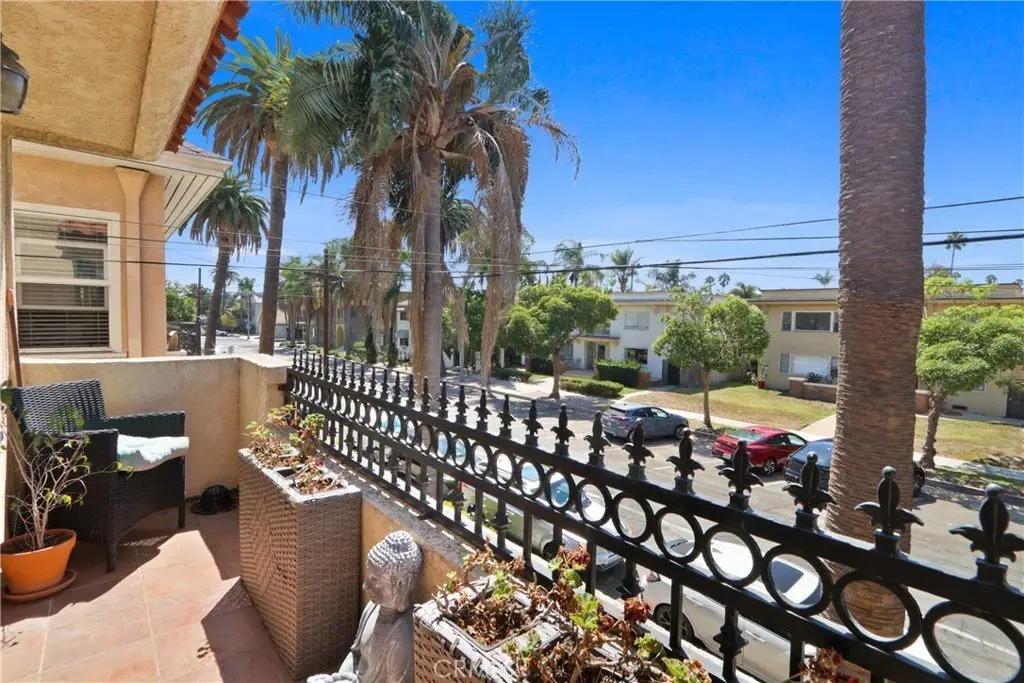
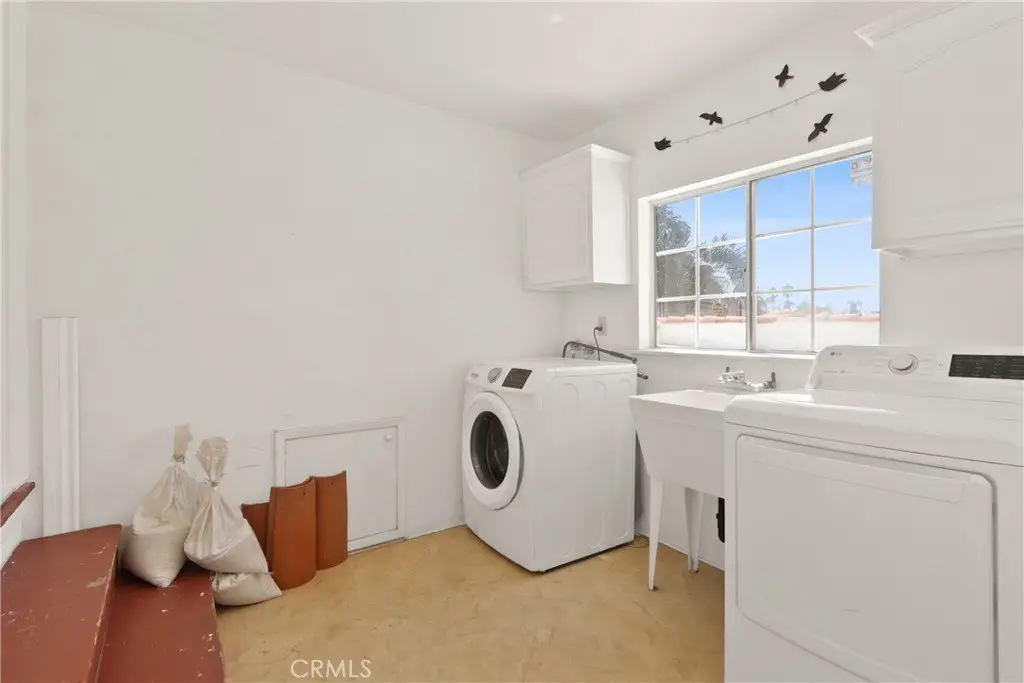
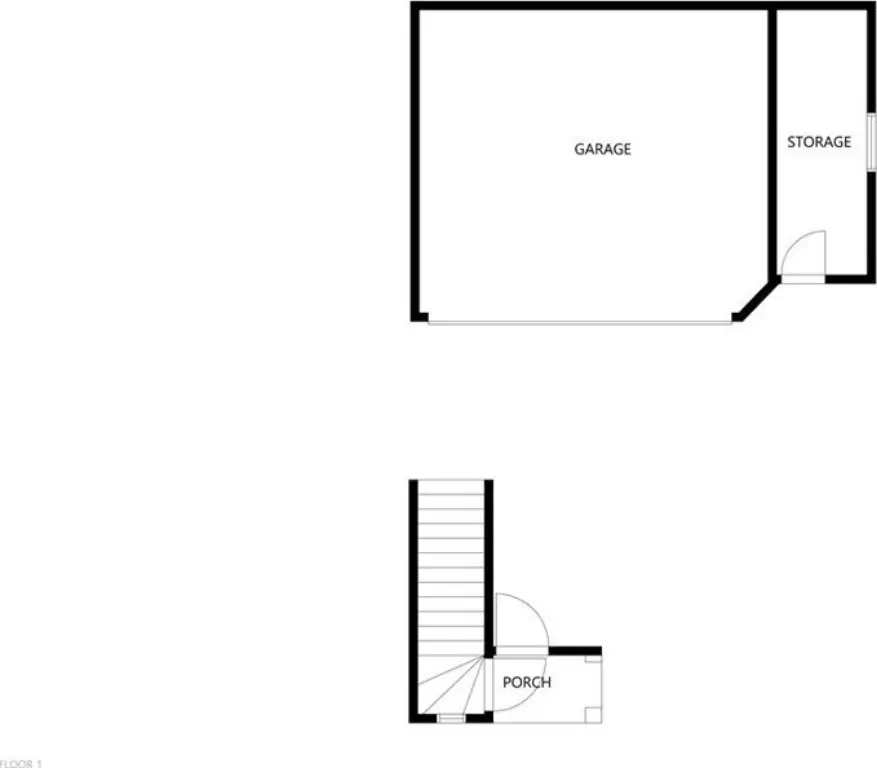
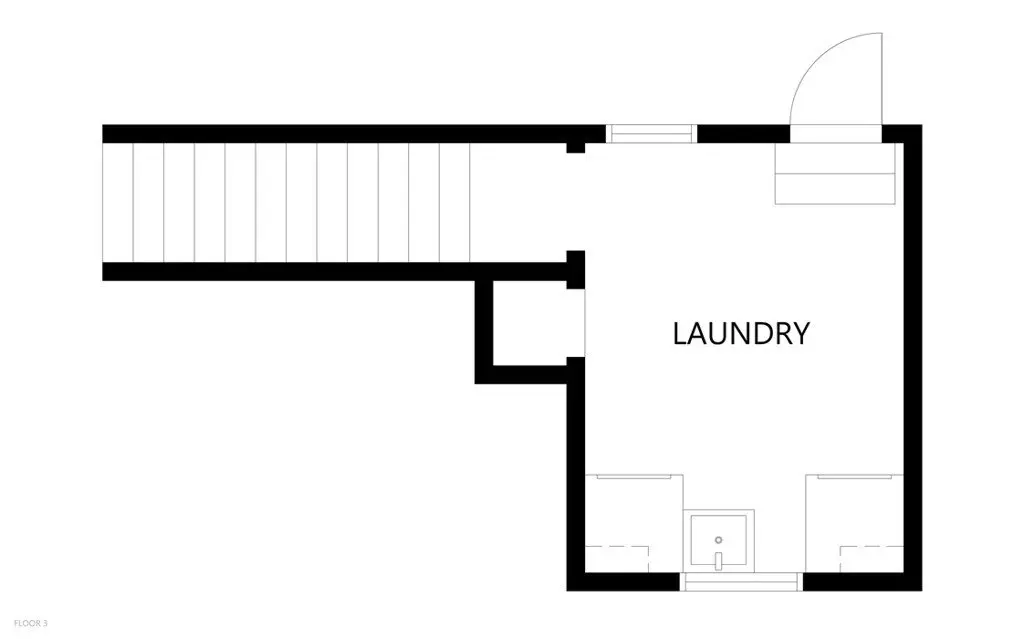
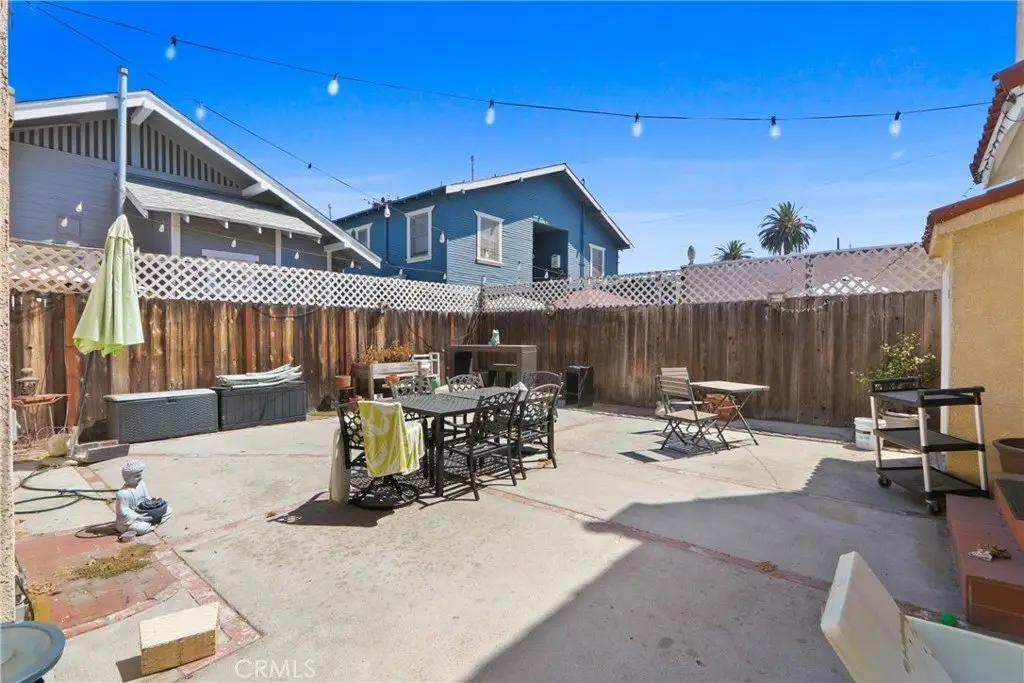
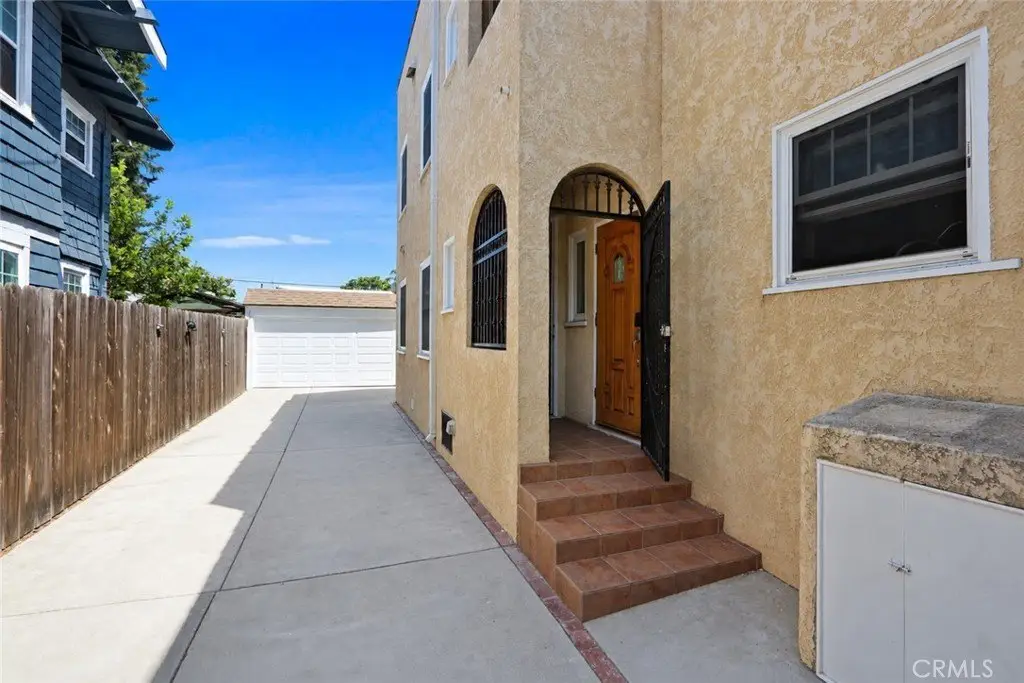
The upper residence adds a fireplace, private balcony, and a third-floor laundry room with a sink and roof access. Separate utility infrastructure includes two 50-gallon water heaters, two gas meters, two water meters, and three electric meters. Exterior features include a gated driveway, two-car garage, additional parking area, EV 240v plug, and private backyard patio. The property is one block from the beach and within walking distance of East Village, downtown waterfront amenities, shops, and restaurants.
The upper residence adds a fireplace, private balcony, and a third-floor laundry room with a sink and roof access. Separate utility infrastructure includes two 50-gallon water heaters, two gas meters, two water meters, and three electric meters. Exterior features include a gated driveway, two-car garage, additional parking area, EV 240v plug, and private backyard patio. The property is one block from the beach and within walking distance of East Village, downtown waterfront amenities, shops, and restaurants.
Key Highlights
- 3,284‑square‑foot duplex on a 0.1014‑acre lot
- Two approximately 1,600‑square‑foot residences, each with 2 bedrooms and 2 bathrooms
- Updated wiring, electrical panels, plumbing, ducting, cabinetry, lighting, and finishes
Financial Insights
Estimated NOI and Cap Rate
NOI / Yr
$70,608
Cap Rate
4.35%
Suggested Prices Based on Cap Rates
Cap Rate 5%
$1,412,160
$1.4M
Cap Rate 7%
$1,008,686
$1.0M
Cap Rate 9%
$784,533
$784.5K
Market Conditions
NOI Build-Up for 3,284 SF
Gross rent
$106.4K $32.40/SF
− Vacancy
−$5.5K −$1.68/SF
EGI
$100.9K $30.72/SF
− OpEx
−$30.3K −$9.21/SF
NOI
$70.6K $21.50/SF
Area
Long Beach, CA
Vacancy
5.20%
Lease Rate
$32.40 /SF/Yr
Expense Ratio
30.00%
Simulate Cap Rate and NOI
Suggested Prices Based on Cap Rates
Cap Rate 5%
$1,412,160
Cap Rate 7%
$1,008,686
Cap Rate 9%
$784,533
Alternative Uses
Best Use
Multifamily LT 5
$1.01M
$882.6K – $1.18M
NOI $70,608 @ 7.0% cap · market cap 4.35%
Second Best
Apartment 5plus
$897.2K
$785.0K – $1.05M
NOI $62,802 @ 7.0% cap · market cap 3.86%
Theoretical Best
Office A
$1.76M
$1.54M – $2.05M
NOI $123,077 @ 7.0% cap · market cap 7.57%
Zoning and permitted uses should be independently verified with authorities.
How Realmo checks its estimates
Property Analytics
Unlock full access to Insights
Subscribe to Realmo Intelligence
Open Analytics
Current Use
Lease Details
2
Residential units
Yes
Utilities to site
Location Intelligence
Trade Area within ½ mile
2,545
Businesses Nearby
Explore this area
Business Placement
Demographics for 90802, CA
41,686
Population
25,055
Households
1.7
Avg Household Size
37
Median Age
44%
College-Educated
88%
High-School Grad
6.5 sq mi
ZIP Area
6,413
Density / Sq Mi
$72,152
Median Household Income
$52,011
Median Earnings
$1,855
Median Rent
$546,700
Median Home Value
Check the figures for this property
Cap Rate, Value Estimation, Potential NOI and more
View Realmo Analytics
Market
Vacancy Rate% for Multifamily in West region

Questions? Ask Rey
Realmo’s AI knows this listing — price, zoning, demand, history. Ask anything.






Frequently Asked Questions
What type of property is this?
Duplex - Fully renovated Spanish duplex with separate utilities, flexible layouts, parking, and original architectural details.
Where is this duplex located?
The property is located at 1131 E 2nd Long Beach, CA.
What is the asking price?
The asking price for this property is $1,625,000.
What are key features of this property?
This property features: 3,284‑square‑foot duplex on a 0.1014‑acre lot; Two approximately 1,600‑square‑foot residences, each with 2 bedrooms and 2 bathrooms; Updated wiring, electrical panels, plumbing, ducting, cabinetry, lighting, and finishes


