Two-Story Mixed-Use Property with
For Sale
Contact for pricing
939 E 4th Street, Long Beach, CA 90802
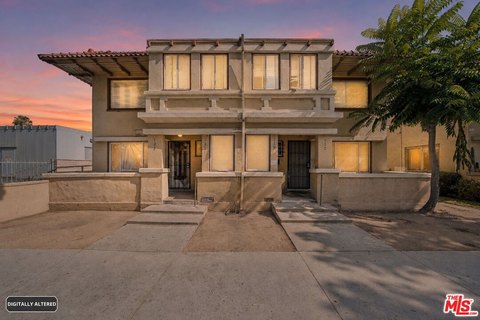
Two restaurant/bar tenancies front E 4th Street, with 5 residential units upstairs.
Property Size4,000 SF
Lot Size0.06 Acres
Price / SF$381.25
Days on Market71
Property Features for 939 E 4th Street
General Information
Standard status
Active
Size
4,000 SF
Lot size
0.06 Acres
Property subtype
Mixed Use
Zoning
LBCO
Occupancy
100%
Investment Type
Stabilized
Net Operating Income
$96,333
Building Details
Year Built
1913
Buildings
1
Stories
2
Units
6
Tenancy
Multi
Listing Agency:
Marcus & Millichap - South Bay
Listed By:
Kevin King · License #CA 01158184
(562) 257-1246
Source:
Crexi
Added: Jul 28
Changed: Sep 28
Last Checked: Oct 5 at 5:27PM
Displayed information is deemed reliable but is not guaranteed and should be independently verified. All listing content including descriptions, pricing, images are the copyrighted material of Marcus & Millichap - South Bay
Investment Insights
Based on property information with market context.
This two-story vintage mixed-use property is approximately 4,000 sq. ft. on approximately 2,465 sq. ft. of land, built in 1913. The ground level includes approximately 2,080 sq. ft. of commercial space divided into 2 restaurant/bar tenancies that front E 4th Street. The residential portion totals approximately 1,920 sq. ft. and includes 2-1-bedroom and 1-bathroom units, plus 2-studio and 1-bathroom units, with an interior corridor.
The current ground-level tenant concept includes Stache Bar, a type-48 licensed local bar that originally opened in July 2009. In 2020, the operator expanded into the adjoining space and created Sideburns Hamburger Grill.
Located in the Alamitos Beach neighborhood, the property is adjacent to the East Village Arts District of Downtown Long Beach and adjacent to 4th Street Retro Row, a retail corridor featuring independent retailers, galleries, cafes, restaurants, salons, and creative businesses.
The current ground-level tenant concept includes Stache Bar, a type-48 licensed local bar that originally opened in July 2009. In 2020, the operator expanded into the adjoining space and created Sideburns Hamburger Grill.
Located in the Alamitos Beach neighborhood, the property is adjacent to the East Village Arts District of Downtown Long Beach and adjacent to 4th Street Retro Row, a retail corridor featuring independent retailers, galleries, cafes, restaurants, salons, and creative businesses.
Key Highlights
- Approximately 4,000 sq. ft. two‑story vintage mixed‑use building built in 1913
- Approximately 2,465 sq. ft. land area
- 2 restaurant/bar tenancies front E 4th Street with approximately 2,080 sq. ft. commercial space
Financial Insights
Estimated NOI and Cap Rate
NOI / Yr
$86,003
Cap Rate
5.64%
Suggested Prices Based on Cap Rates
Cap Rate 5%
$1,720,060
$1.7M
Cap Rate 7%
$1,228,614
$1.2M
Cap Rate 9%
$955,589
$955.6K
Market Conditions
NOI Build-Up for 4,000 SF
Gross rent
$129.6K $32.40/SF
− Vacancy
−$6.7K −$1.68/SF
EGI
$122.9K $30.72/SF
− OpEx
−$36.9K −$9.21/SF
NOI
$86.0K $21.50/SF
Area
Long Beach, CA
Vacancy
5.20%
Lease Rate
$32.40 /SF/Yr
Expense Ratio
30.00%
Simulate Cap Rate and NOI
Suggested Prices Based on Cap Rates
Cap Rate 5%
$1,720,060
Cap Rate 7%
$1,228,614
Cap Rate 9%
$955,589
Alternative Uses
Best Use
Multifamily LT 5
$1.23M
$1.08M – $1.43M
NOI $86,003 @ 7.0% cap · market cap 5.64%
Second Best
Apartment 5plus
$1.09M
$956.2K – $1.27M
NOI $76,494 @ 7.0% cap · market cap 5.02%
Theoretical Best
Office A
$2.14M
$1.87M – $2.50M
NOI $149,911 @ 7.0% cap · market cap 9.83%
Zoning and permitted uses should be independently verified with authorities.
Property Analytics
Unlock full access to Insights
Subscribe to Realmo Intelligence
Open Analytics
Current Use
Location Intelligence
Trade Area within ½ mile
3,484
Businesses Nearby
Explore this area
Business Placement
Demographics for 90802, CA
41,686
Population
25,055
Households
1.7
Avg Household Size
37
Median Age
44%
College-Educated
88%
High-School Grad
6.5 sq mi
ZIP Area
6,413
Density / Sq Mi
$72,152
Median Household Income
$52,011
Median Earnings
$1,855
Median Rent
$546,700
Median Home Value
Check the figures for this property
Cap Rate, Value Estimation, Potential NOI and more
View Realmo Analytics
Market
Vacancy Rate% for Multifamily in West region

Questions? Ask Rey
Realmo’s AI knows this listing — price, zoning, demand, history. Ask anything.




Frequently Asked Questions
What type of property is this?
Mixed-use property - Two restaurant/bar tenancies front E 4th Street, with 5 residential units upstairs.
Where is this mixed-use property located?
The property is located at 939 E 4th Street Long Beach, CA.
What is the asking price?
The asking price for this property is $1,525,000.
What are key features of this property?
This property features: Approximately 4,000 sq. ft. two‑story vintage mixed‑use building built in 1913; Approximately 2,465 sq. ft. land area; 2 restaurant/bar tenancies front E 4th Street with approximately 2,080 sq. ft. commercial space



