Three-Story Mixed-Use
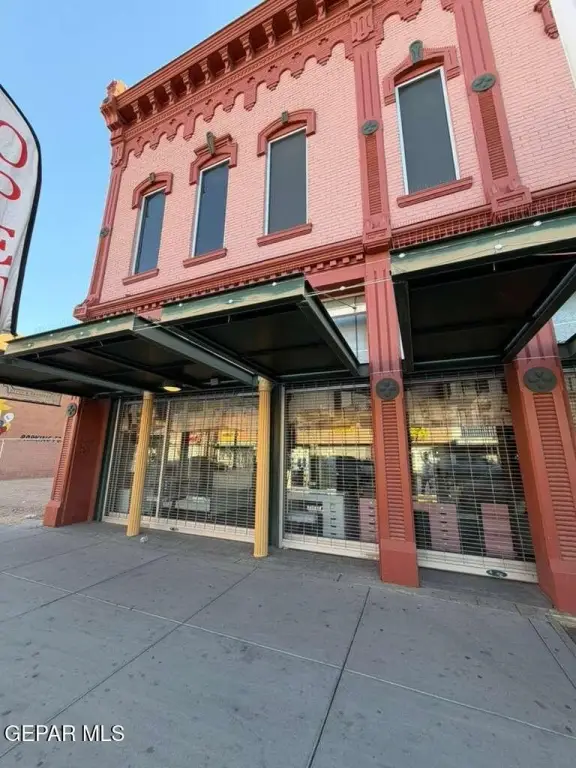
For Sale
$2,600,000
402 S EL PASO Street, El Paso, TX 79901
Commercial Sale, El Paso, TX
Property Size22,200 SF
Lot Size0.28 Acres
Price / SF$117.12
Days on Market269

Ask AI about this property
Review the available facts, identify missing information and prepare questions for the agent.
Property Features for 402 S EL PASO Street
General Information
Property type
Commercial Sale
Property subtype
Other
Zoning
C5
Fireplace
1
Standard status
Active
APN
M47399903404500
Lot size
0.28 Acres
Taxes and HOA fees
Tax Description
34 MILLS 102.00 FT ON EL PASO X 120.00 FT BEG 158.00 N OF SWC (12240.00 SQ FT)
Legal Description
34 MILLS 102.00 FT ON EL PASO X 120.00 FT BEG 158.00 N OF SWC (12240.00 SQ FT)
Utilities
Sewer type
Public Sewer
Heating system
Central
Cooling system
Central Air
Building Details
Floors in Building
3
Building materials
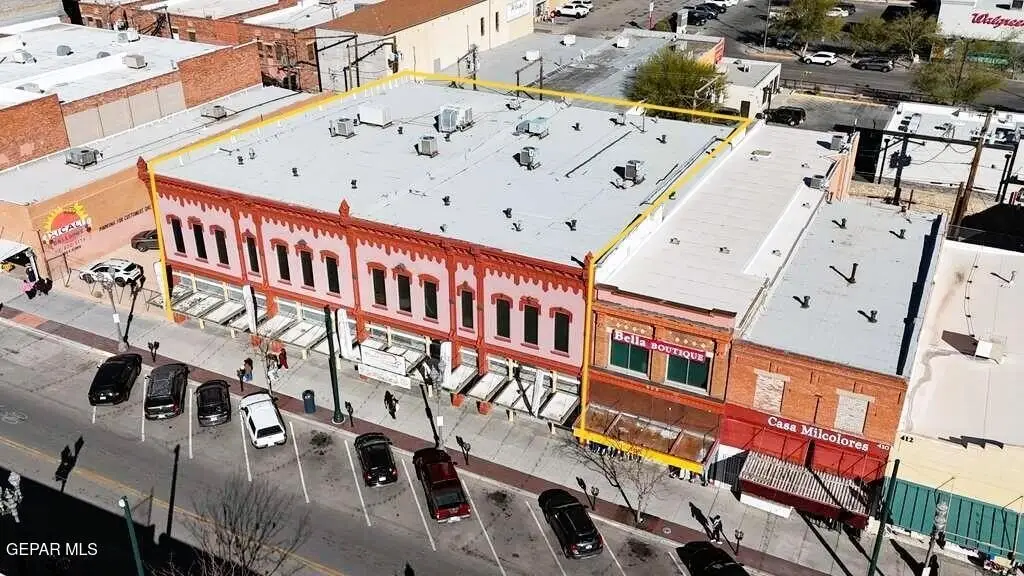
Brick
Listing Agency:
Keller Williams Realty
(915) 603-5293
Listed By:
Armando Sarti
(915) 288-5287
Added: Jan 19
Changed: Oct 2
Last Checked: Oct 15 at 2:06PM
MLS# 936803
Copyright © 2026 Greater El Paso Association of Realtors. All rights reserved. All information provided by the listing agent/broker is deemed reliable but is not guaranteed and should be independently verified.
Investment Insights
Based on property information with market context.
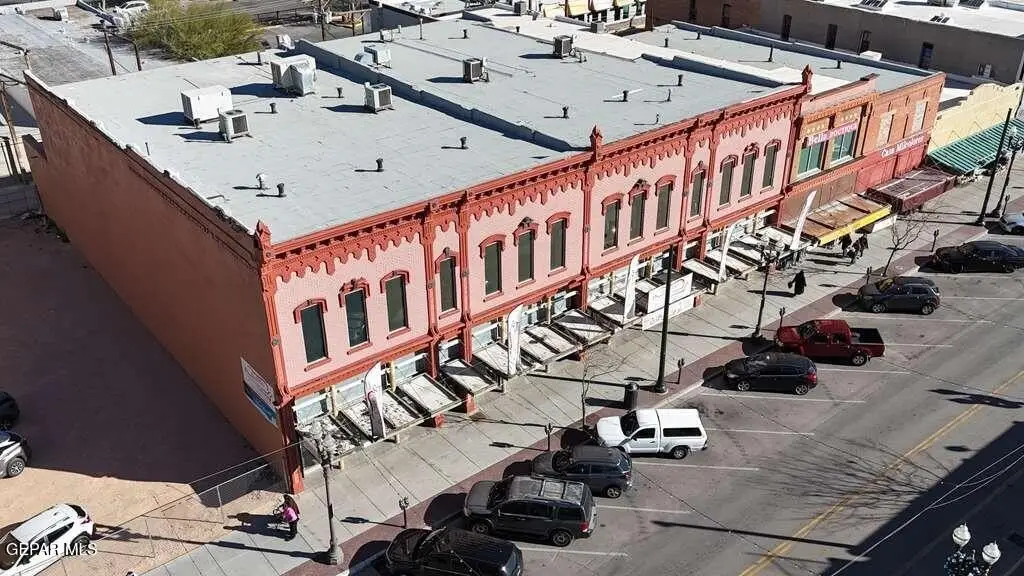
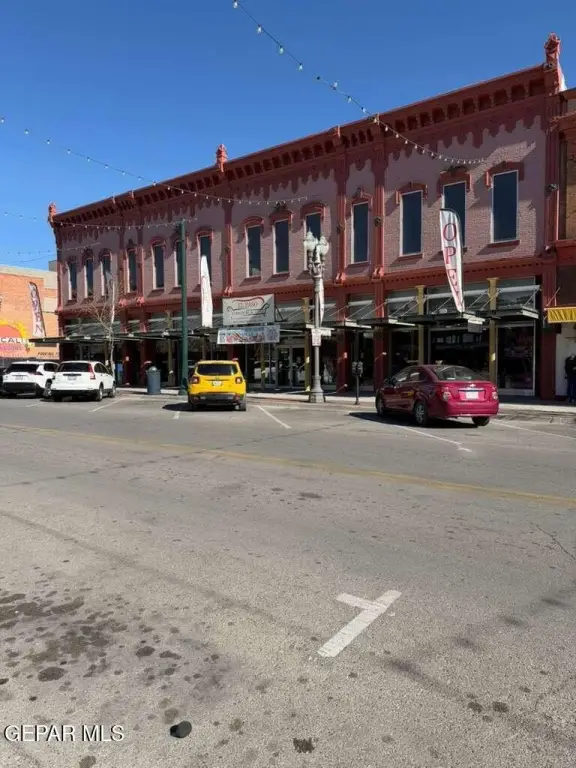
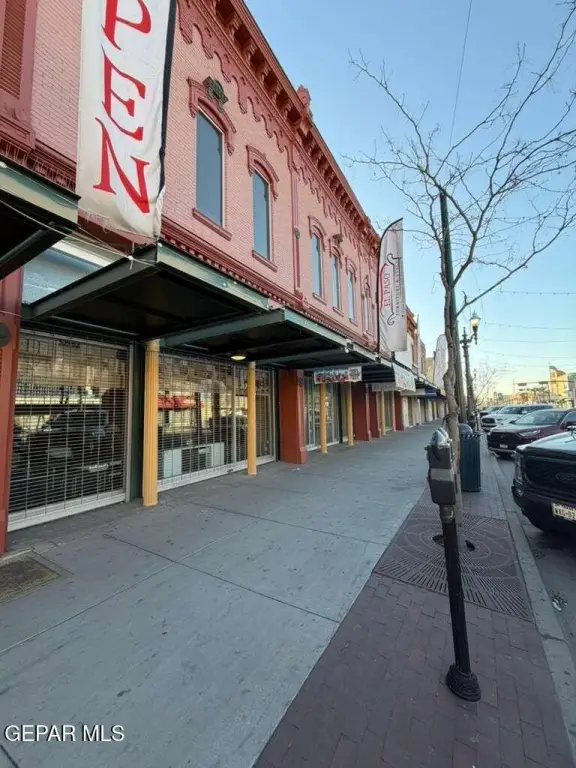
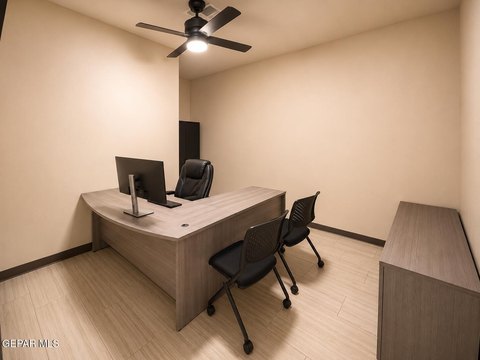
This three-story mixed-use commercial building contains approximately 22,200 square feet of rentable space. The layout includes 10,200 SF on the first floor, 1,800 SF on the second floor, and 10,200 SF on the third floor. Brick construction and central heating and air conditioning serve the building, while public sewer supports the property. The asset is currently income-producing, with vacant or underutilized areas noted within the building.
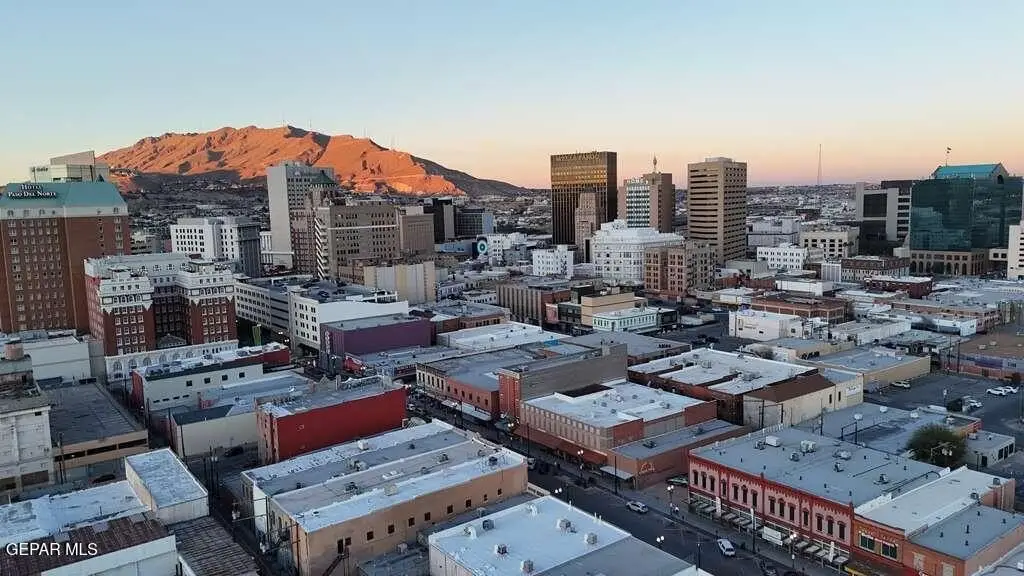
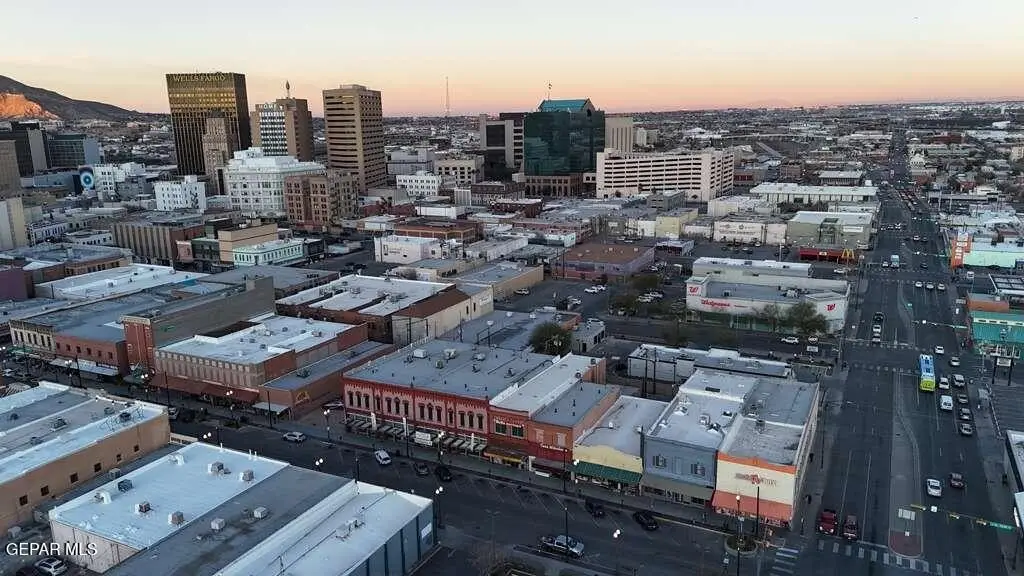
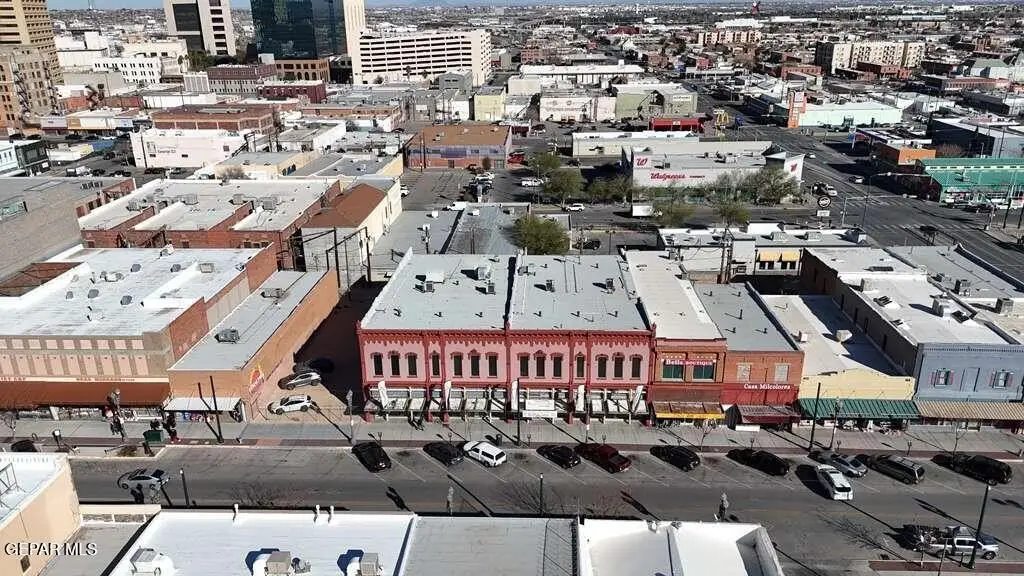
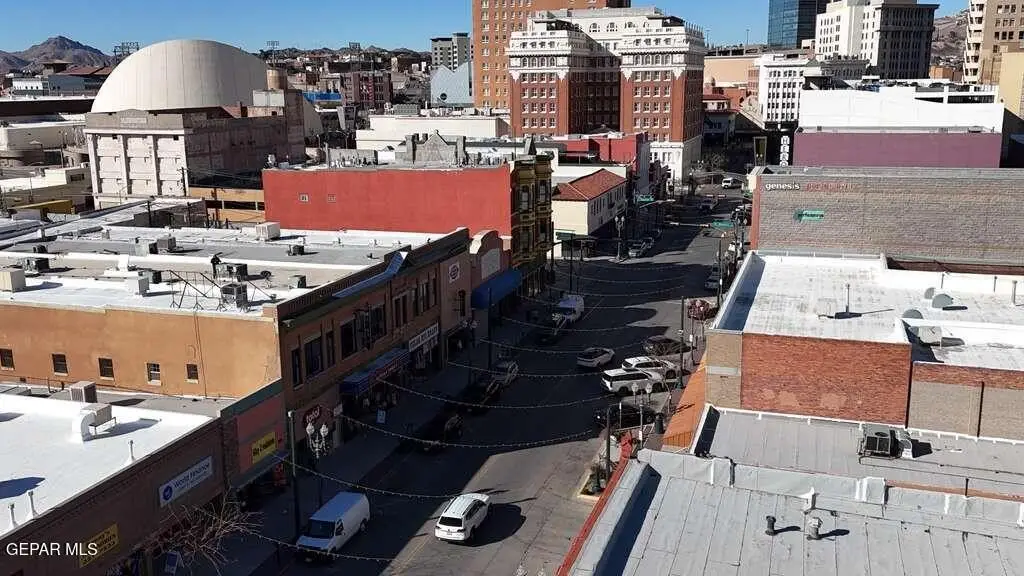
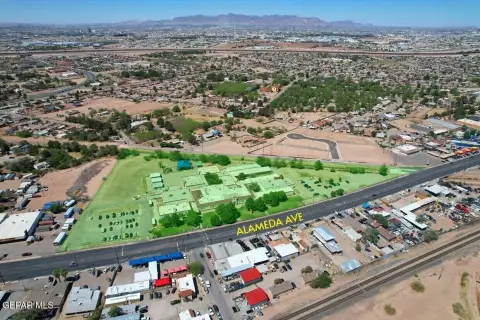
The property is located at 402 S. El Paso Street in Downtown El Paso, near the international bridge and Plaza Lagartos. The surrounding setting includes hotels, restaurants, retail businesses, downtown attractions, local shoppers, commuters, and cross-border pedestrian activity. C5 zoning and the existing three-level configuration support consideration of office, retail, hospitality, or other mixed-use concepts as described for the property.
The property is located at 402 S. El Paso Street in Downtown El Paso, near the international bridge and Plaza Lagartos. The surrounding setting includes hotels, restaurants, retail businesses, downtown attractions, local shoppers, commuters, and cross-border pedestrian activity. C5 zoning and the existing three-level configuration support consideration of office, retail, hospitality, or other mixed-use concepts as described for the property.
Key Highlights
- Approximately 22,200 square feet of rentable space across three floors
- Floor areas include 10,200 SF on the first floor, 1,800 SF on the second floor, and 10,200 SF on the third floor
- C5 zoning in Downtown El Paso at 402 S. El Paso Street
Property Analytics
Unlock full access to Insights
Subscribe to Realmo Intelligence
Open Analytics
Current Use
Location Intelligence
Trade Area within ½ mile
3,525
Businesses Nearby
Explore this area
Business Placement
Demographics for 79901, TX
10,027
Population
4,571
Households
2.2
Avg Household Size
40
Median Age
7%
College-Educated
46%
High-School Grad
2.2 sq mi
ZIP Area
4,558
Density / Sq Mi
$13,984
Median Household Income
$19,026
Median Earnings
$517
Median Rent
$93,100
Median Home Value
Check the figures for this property
Cap Rate, Value Estimation, Potential NOI and more
View Realmo Analytics
Market
Vacancy Rate% for Office in El Paso, TX





Frequently Asked Questions
What type of property is this?
Mixed-use property - C5-zoned commercial property with central heating and cooling throughout and an income-producing operating profile.
Where is this mixed-use property located?
The property is located at 402 S EL PASO Street El Paso, TX.
What is the asking price?
The asking price for this property is $2,600,000.
What are key features of this property?
This property features: Approximately 22,200 square feet of rentable space across three floors; Floor areas include 10,200 SF on the first floor, 1,800 SF on the second floor, and 10,200 SF on the third floor; C5 zoning in Downtown El Paso at 402 S. El Paso Street


