Downtown El Paso Executive
For Sale
Contact for pricing
641 N Stanton St, El Paso, TX 79901
Prime downtown El Paso office building for sale or lease.
Property Size15,684 SF
Price / SF$255.04
Days on Market216
Property Features for 641 N Stanton St
General Information
Standard status
Active
Size
15,684 SF
Class
B
Total Parking Spaces
35
Property subtype
Office
Zoning
C-5
Lease Type
NNN
Building Details
Year Built
2000
Year Renovated
2023
Buildings
1
Stories
3
Tenancy
Multi
Listing Agency:
Heritage Group
Listed By:
Nadia Baem · License #637396
(915) 317-8845
Source:
Crexi
Added: Mar 14
Changed: Oct 10
Last Checked: Oct 14 at 11:28PM
Displayed information is deemed reliable but is not guaranteed and should be independently verified. All listing content including descriptions, pricing, images are the copyrighted material of Heritage Group
Investment Insights
Based on property information with market context.
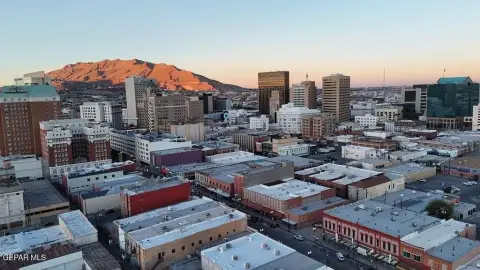
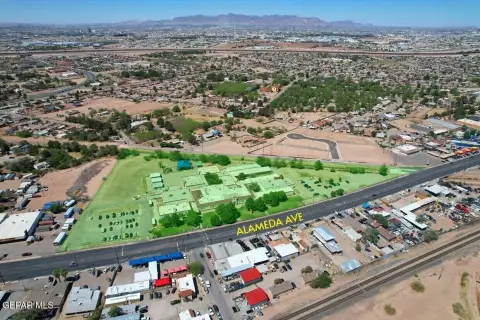
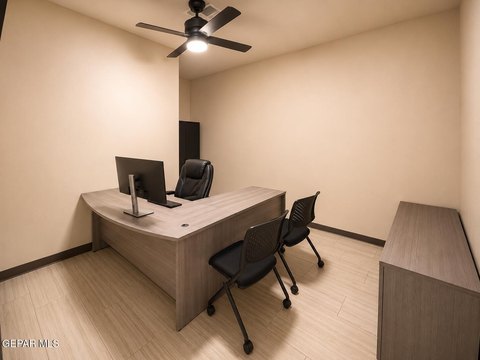
Located in downtown El Paso, 641 N Stanton is an executive office building available for sale or lease. The property is situated in the heart of downtown El Paso, offering walkable access to businesses, restaurants, bars, and the Chihuahua baseball stadium. Its location fronts the I-10 E ramp, enhancing convenience and connectivity. The property features a covered parking garage with 20 indoor and 20 outdoor parking spaces, remote control access, and enhanced security systems. An outdoor terrace provides views of Uptown and overlooks the proposed Downtown Deck Park. The second floor is a newly renovated office space with an efficient horseshoe layout. The third floor is currently occupied by First National Bank. The building has a total size of 15684 square feet.
Key Highlights
- Prime downtown El Paso location with walkable access to businesses, restaurants, bars, and the baseball stadium.
- On‑site covered parking garage with 20 indoor and 20 outdoor spaces, remote control access, and enhanced security.
- Direct access to I‑10 E ramp, enhancing connectivity.
Financial Insights
Estimated NOI and Cap Rate
NOI / Yr
$198,535
Cap Rate
4.96%
Suggested Prices Based on Cap Rates
Cap Rate 5%
$3,970,700
$4.0M
Cap Rate 7%
$2,836,214
$2.8M
Cap Rate 9%
$2,205,944
$2.2M
Market Conditions
NOI Build-Up for 15,684 SF
Gross rent
$325.6K $20.76/SF
− Vacancy
−$60.9K −$3.88/SF
EGI
$264.7K $16.88/SF
− OpEx
−$66.2K −$4.22/SF
NOI
$198.5K $12.66/SF
Area
El Paso, TX
Vacancy
18.70%
Lease Rate
$20.76 /SF/Yr
Expense Ratio
25.00%
Simulate Cap Rate and NOI
Suggested Prices Based on Cap Rates
Cap Rate 5%
$3,970,700
Cap Rate 7%
$2,836,214
Cap Rate 9%
$2,205,944
Alternative Uses
Best Use
Office B
$2.84M
$2.48M – $3.31M
NOI $198,535 @ 7.0% cap · market cap 4.96%
Second Best
—
—
no second resolved use
Theoretical Best
Office A
$3.93M
$3.44M – $4.59M
NOI $275,433 @ 7.0% cap · market cap 6.89%
Zoning and permitted uses should be independently verified with authorities.
How Realmo checks its estimates
Property Analytics
Unlock full access to Insights
Subscribe to Realmo Intelligence
Open Analytics
Current Use
Location Intelligence
Trade Area within ½ mile
4,215
Businesses Nearby
Explore this area
Business Placement
Demographics for 79901, TX
10,027
Population
4,571
Households
2.2
Avg Household Size
40
Median Age
7%
College-Educated
46%
High-School Grad
2.2 sq mi
ZIP Area
4,558
Density / Sq Mi
$13,984
Median Household Income
$19,026
Median Earnings
$517
Median Rent
$93,100
Median Home Value
Check the figures for this property
Cap Rate, Value Estimation, Potential NOI and more
View Realmo Analytics
Market
Vacancy Rate% for Office in El Paso, TX

Questions? Ask Rey
Realmo’s AI knows this listing — price, zoning, demand, history. Ask anything.





Frequently Asked Questions
What type of property is this?
Office building - Prime downtown El Paso office building for sale or lease.
Where is this office building located?
The property is located at 641 N Stanton St El Paso, TX.
What is the asking price?
The asking price for this property is $4,000,000.
What are key features of this property?
This property features: Prime downtown El Paso location with walkable access to businesses, restaurants, bars, and the baseball stadium.; On‑site covered parking garage with 20 indoor and 20 outdoor spaces, remote control access, and enhanced security.; Direct access to I‑10 E ramp, enhancing connectivity.


