Duplex with Pool and RV
For Sale
$960,000
3795 N 33rd St, Boise, ID 83703
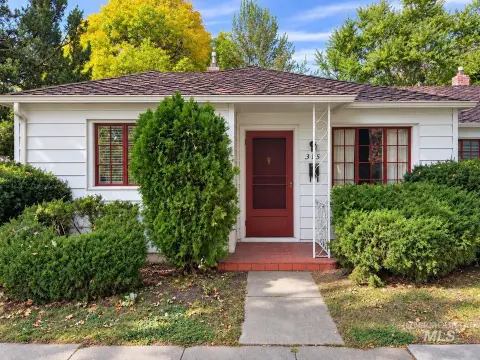
Two distinct living areas support owner-occupant, multigenerational, or investment use, subject to buyer verification.
Property Size3,256 SF
Price / SF$294.84
Days on Market56
Property Features for 3795 N 33rd St
General Information
Standard status
Active
Size
3,256 SF
Additional Details
Multifamily Units
2
Amenities
pool
built-in BBQ
covered outdoor living
low-maintenance yard
30-amp RV hookup
shared laundry
Building Details
Year Built
1965
Listing Agency:
Fathom Realty
Listed By:
Misty Rose · License #28445
(888) 455-6040
Source:
208doors
Added: Aug 21
Changed: Oct 6
Last Checked: Oct 7 at 2:04PM
Displayed information is deemed reliable but is not guaranteed and should be independently verified. All listing content including descriptions, pricing, images are the copyrighted material of Fathom Realty
Investment Insights
Based on property information with market context.
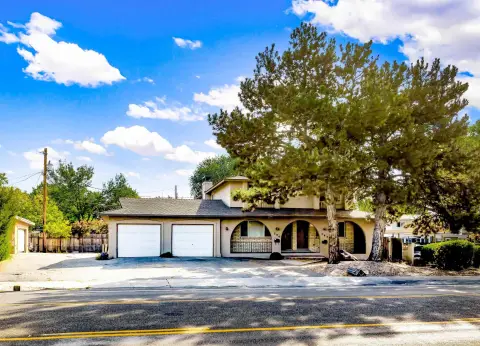
This 3,256-square-foot duplex, built in 1965, provides two distinct living areas with separate access and flexible functionality. The lower level includes a kitchen, bedroom, family or recreation room, two full baths, walk-in closet, locking interior separation, exterior entrance, and patio access. The main level offers a kitchen, multiple living areas, two bedrooms, bonus space, and a private-entry office. Shared laundry is separately accessible.
Outdoor improvements include a pool, built-in barbecue, covered living area, low-maintenance yard, and 30-amp RV hookup. Major updates include a new main sewer line, 2026 AC, and a roof, boiler, solar system, updated windows, and radiant floor and ceiling heat completed in 2018. The property is located at 3795 N 33rd St in Boise, Idaho.
Outdoor improvements include a pool, built-in barbecue, covered living area, low-maintenance yard, and 30-amp RV hookup. Major updates include a new main sewer line, 2026 AC, and a roof, boiler, solar system, updated windows, and radiant floor and ceiling heat completed in 2018. The property is located at 3795 N 33rd St in Boise, Idaho.
Key Highlights
- 3,256 SF duplex with two distinct living areas
- Lower level includes kitchen, bedroom, family/rec room, two full baths, WIC, and separate exterior entrance
- Main level has two bedrooms, multiple living areas, bonus space, and private‑entry office
Financial Insights
Estimated NOI and Cap Rate
NOI / Yr
$39,246
Cap Rate
4.09%
Suggested Prices Based on Cap Rates
Cap Rate 5%
$784,920
$784.9K
Cap Rate 7%
$560,657
$560.7K
Cap Rate 9%
$436,067
$436.1K
Market Conditions
NOI Build-Up for 3,256 SF
Gross rent
$56.7K $17.40/SF
− Vacancy
−$589 −$0.18/SF
EGI
$56.1K $17.22/SF
− OpEx
−$16.8K −$5.17/SF
NOI
$39.2K $12.05/SF
Area
Ada County, ID
Vacancy
1.04%
Lease Rate
$17.40 /SF/Yr
Expense Ratio
30.00%
Simulate Cap Rate and NOI
Suggested Prices Based on Cap Rates
Cap Rate 5%
$784,920
Cap Rate 7%
$560,657
Cap Rate 9%
$436,067
Alternative Uses
Best Use
Multifamily LT 5
$560.7K
$490.6K – $654.1K
NOI $39,246 @ 7.0% cap · market cap 4.09%
Second Best
Apartment 5plus
$488.9K
$427.8K – $570.4K
NOI $34,221 @ 7.0% cap · market cap 3.56%
Theoretical Best
Office A
$899.2K
$786.8K – $1.05M
NOI $62,945 @ 7.0% cap · market cap 6.56%
Zoning and permitted uses should be independently verified with authorities.
How Realmo checks its estimates
Property Analytics
Unlock full access to Insights
Subscribe to Realmo Intelligence
Open Analytics
Current Use
Lease Details
2
Residential units
Location Intelligence
Trade Area within ½ mile
187
Businesses Nearby
Explore this area
Business Placement
Demographics for 83703, ID
18,163
Population
7,971
Households
2.3
Avg Household Size
40
Median Age
54%
College-Educated
97%
High-School Grad
8.1 sq mi
ZIP Area
2,242
Density / Sq Mi
$74,415
Median Household Income
$41,938
Median Earnings
$1,336
Median Rent
$477,000
Median Home Value
Check the figures for this property
Cap Rate, Value Estimation, Potential NOI and more
View Realmo Analytics
Market
Vacancy Rate% for Multifamily in West region

Questions? Ask Rey
Realmo’s AI knows this listing — price, zoning, demand, history. Ask anything.





Frequently Asked Questions
What type of property is this?
Duplex - Two distinct living areas support owner-occupant, multigenerational, or investment use, subject to buyer verification.
Where is this duplex located?
The property is located at 3795 N 33rd St Boise, ID.
What is the asking price?
The asking price for this property is $960,000.
What are key features of this property?
This property features: 3,256 SF duplex with two distinct living areas; Lower level includes kitchen, bedroom, family/rec room, two full baths, WIC, and separate exterior entrance; Main level has two bedrooms, multiple living areas, bonus space, and private‑entry office


