Mixed-Use Property with Hospitality
For Sale
$1,798,000
3542 Lake Tahoe Boulevard, South Lake Tahoe, CA 96150
Comm/Ind/BusOpp, South Lake Tahoe, CA
Property Size5,591 SF
Lot Size0.43 Acres
Price / SF$321.59
Days on Market179
Property Features for 3542 Lake Tahoe Boulevard
General Information
Property type
Commercial Sale
Property subtype
Other
Zoning
Commercial
Window features
Double Pane Windows
Directions
Down LT Blvd towards Stateline, the property will be on your right.
Subdivision
Bijou 1
Standard status
Active
APN
027101002000
Lot size
0.43 Acres
Utilities
Utilities
Cable Available
Heating system
Forced Air, Electric (Heating), Natural Gas
Building Details
Year built
1937
Flooring type
Concrete, Carpet, Tile
Building materials
Wood Frame, Masonry, Wood Siding
Roof type
Composition, Metal
Listing Agency:
Compass
(530) 645-2777
Listed By:
Mark Salmon · License #01485376
(310) 230-5478
Added: Apr 12
Changed: Sep 23
Last Checked: Oct 7 at 1:06AM
MLS# 142716
Copyright © 2026 South Tahoe Association of REALTORS®. All rights reserved. All information provided by the listing agent/broker is deemed reliable but is not guaranteed and should be independently verified.
Investment Insights
Based on property information with market context.
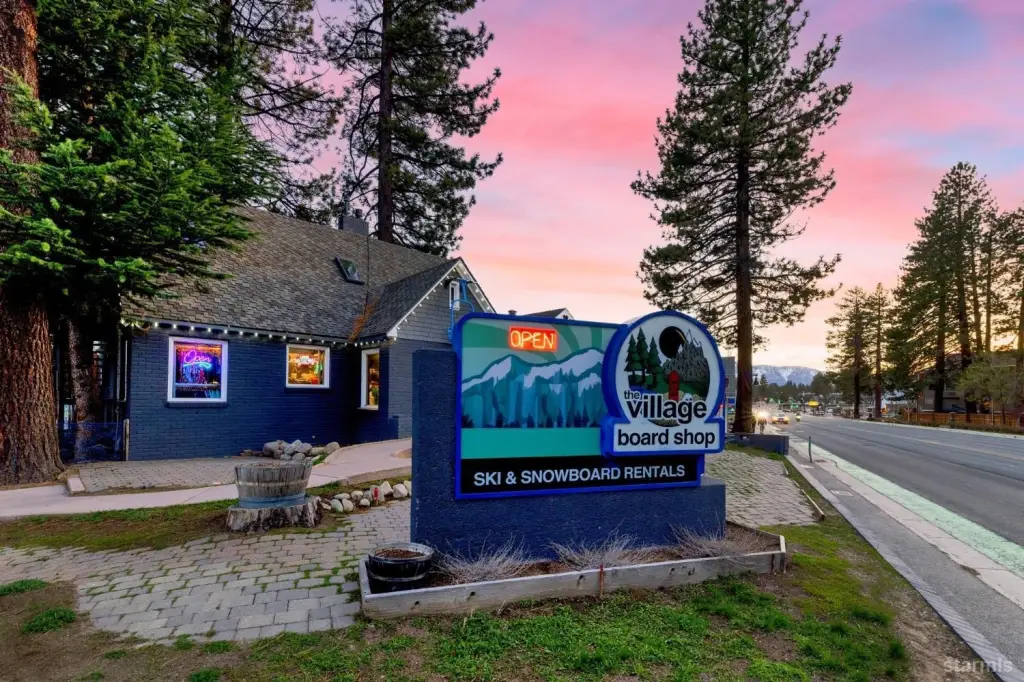
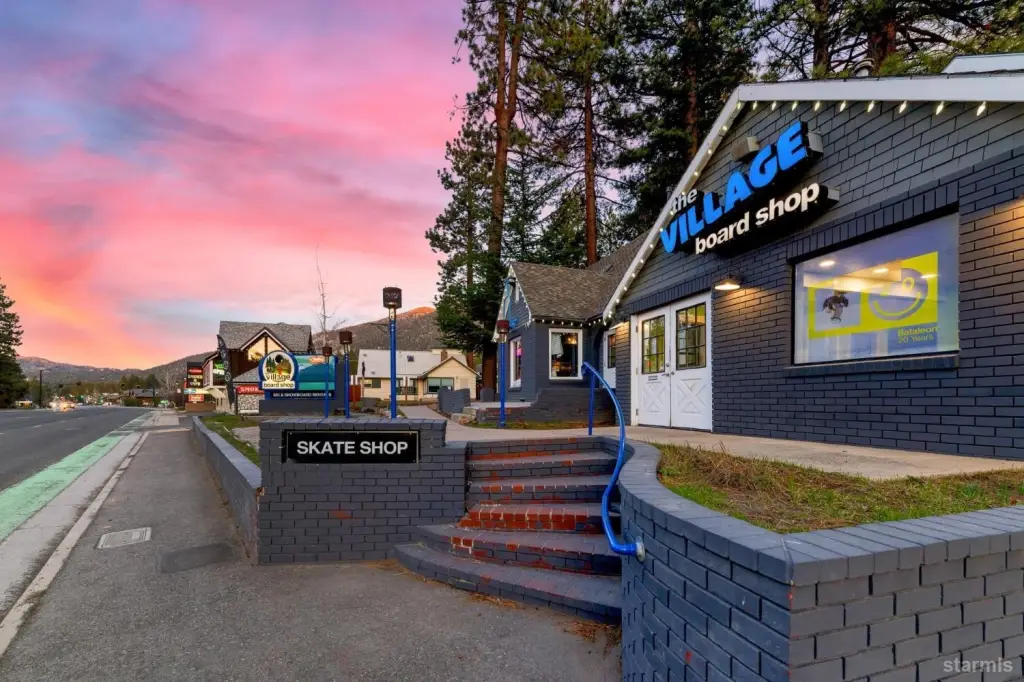
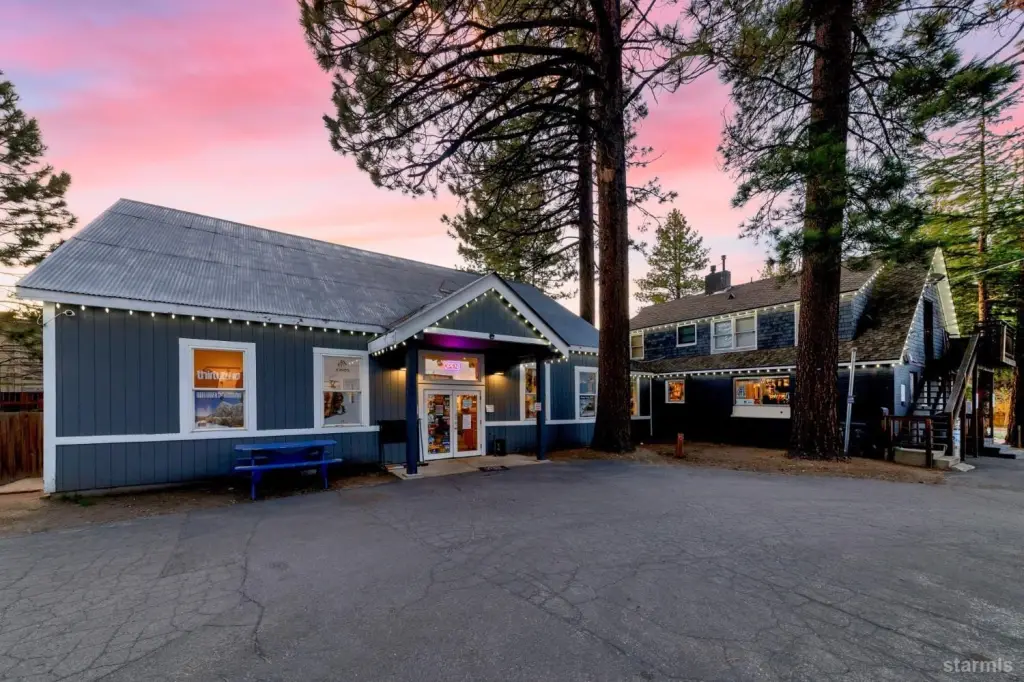
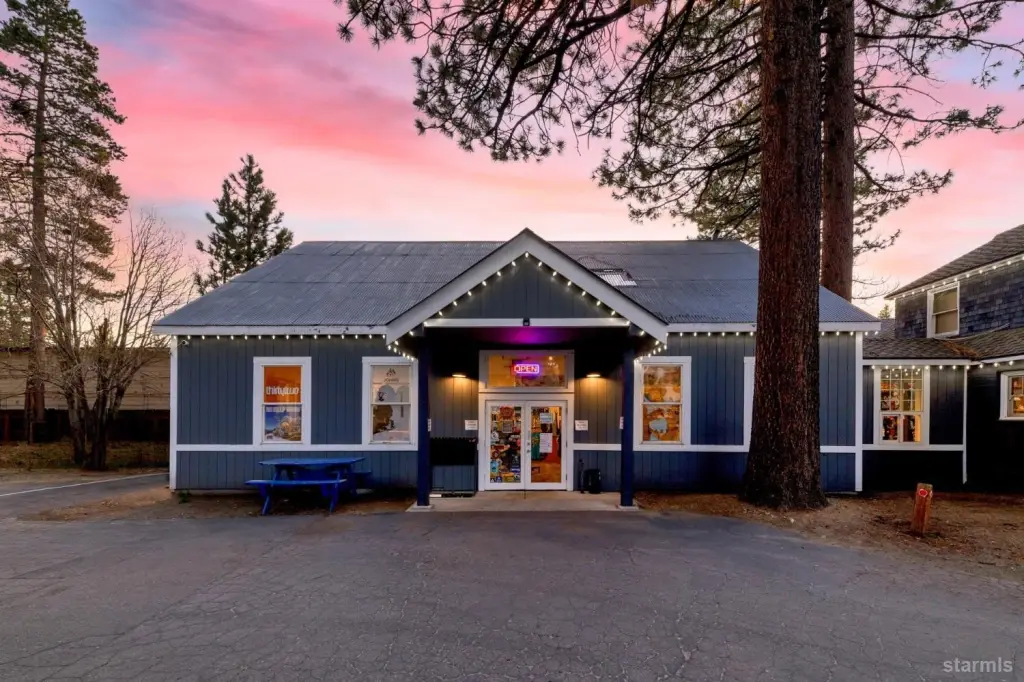
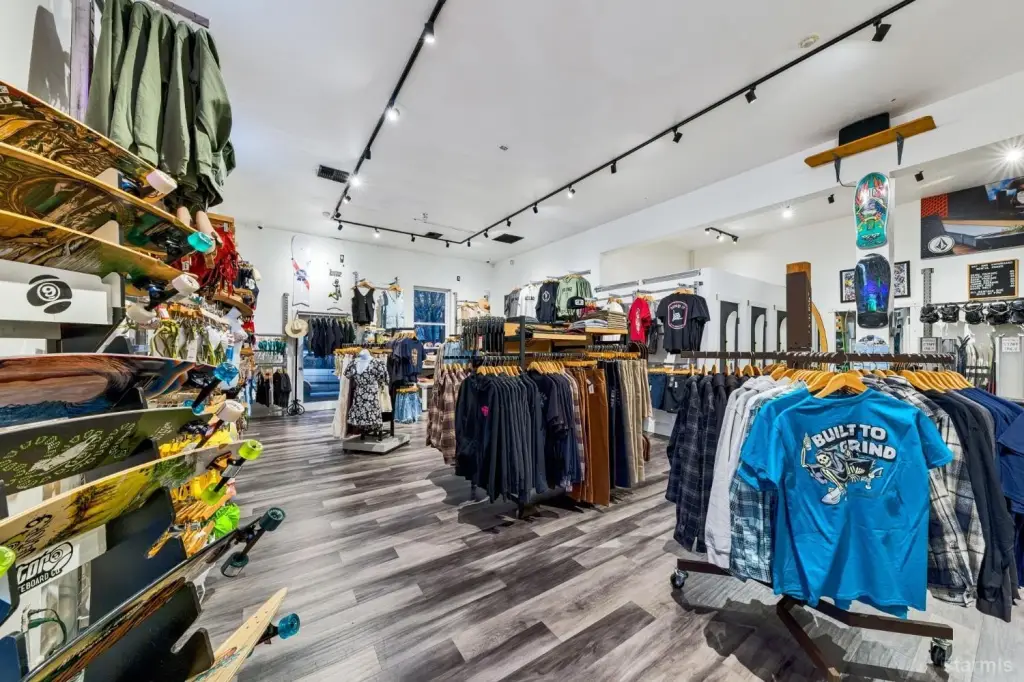
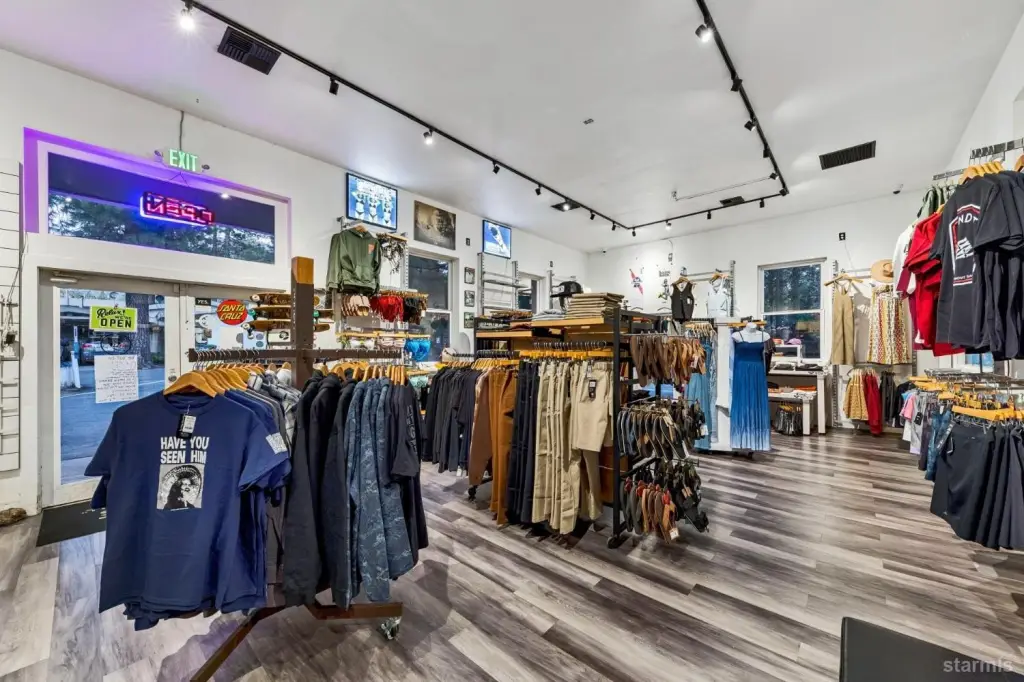
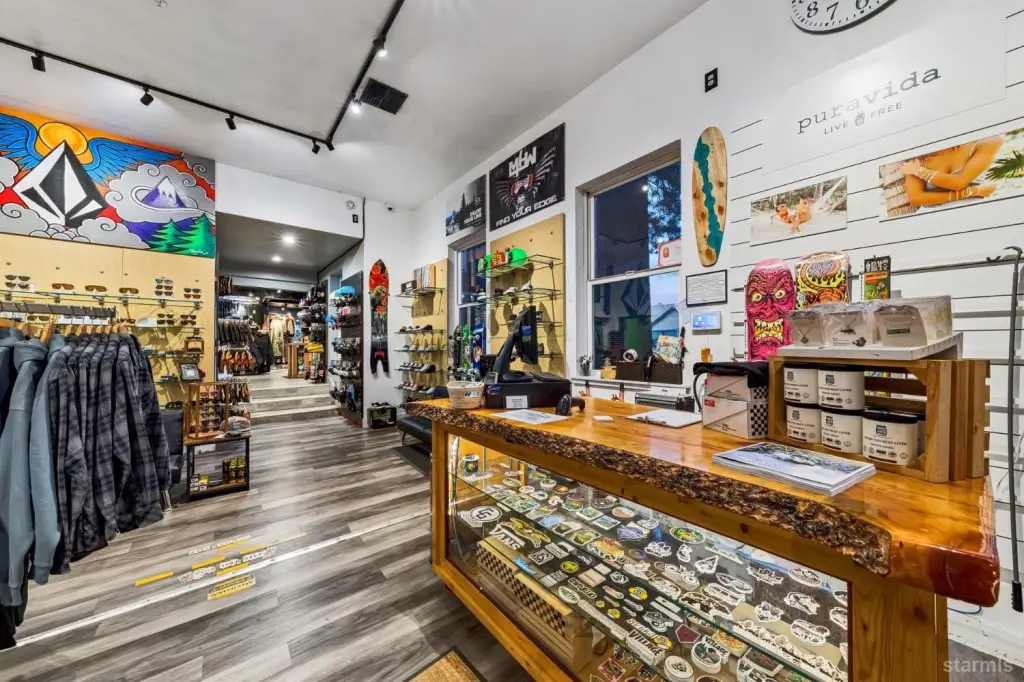
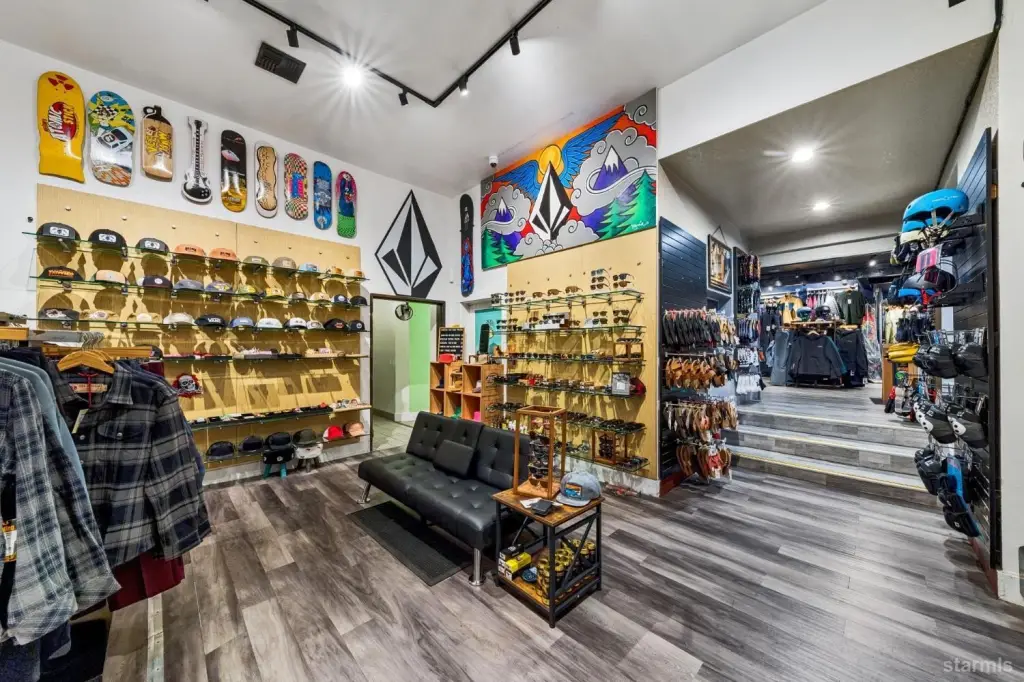
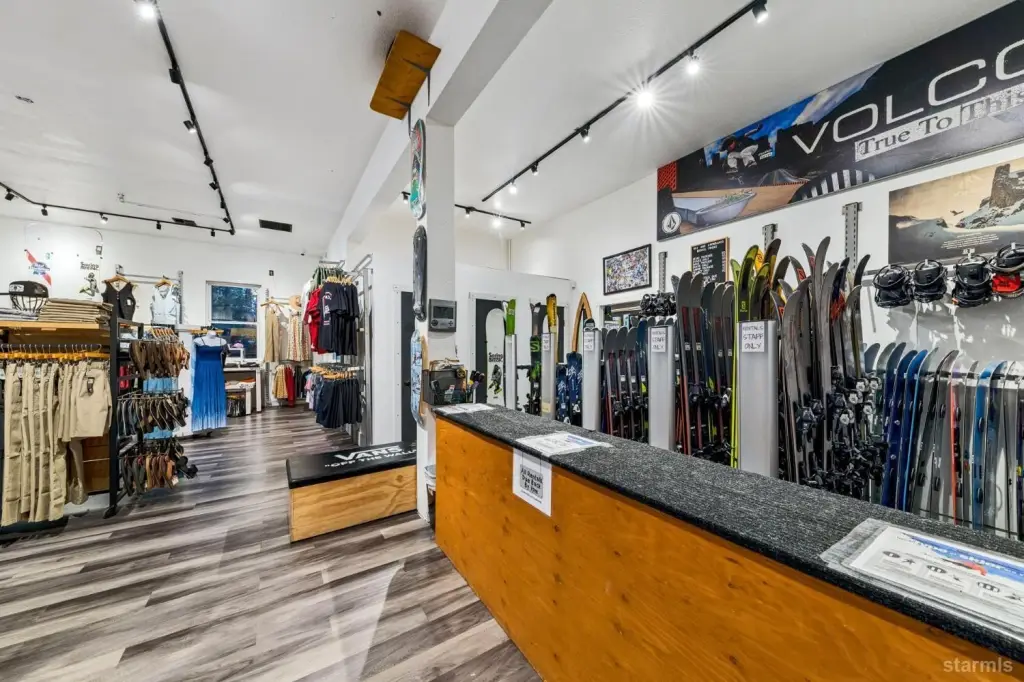
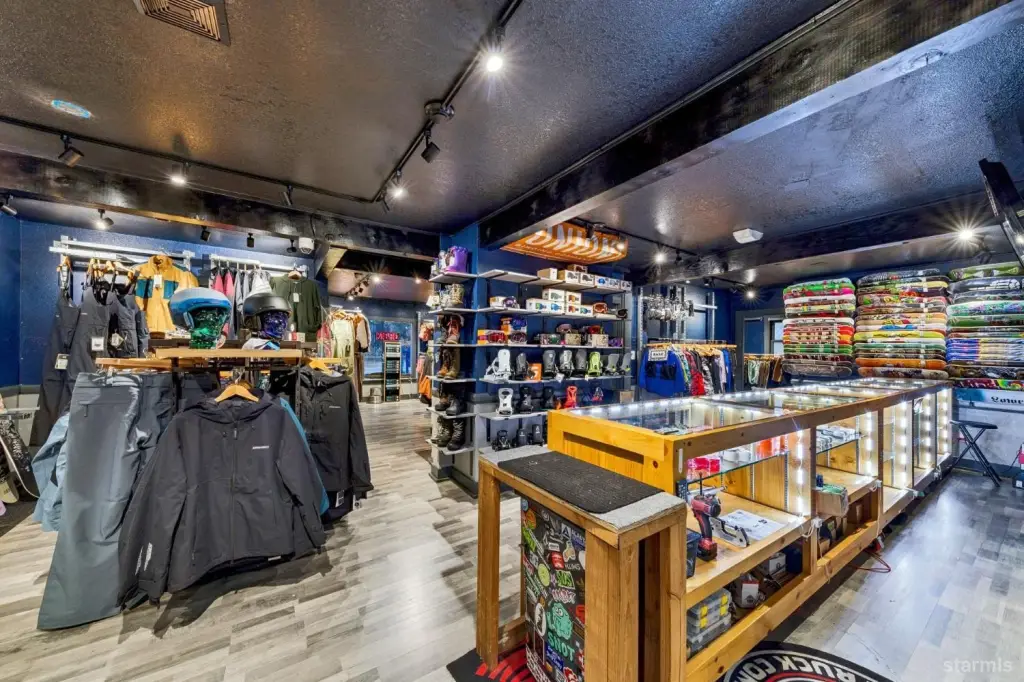
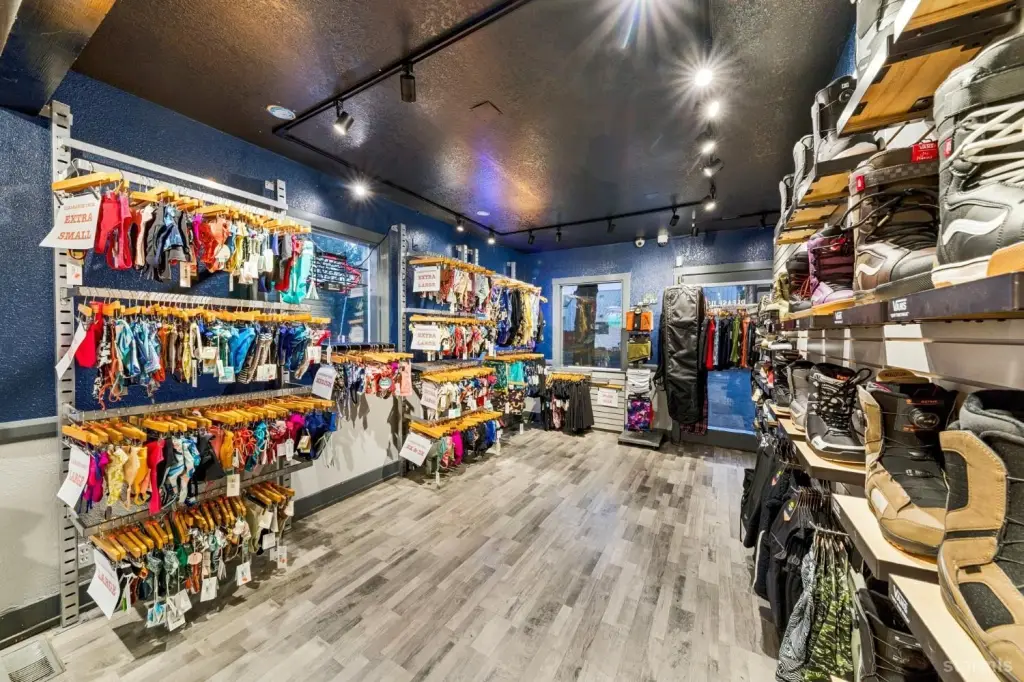
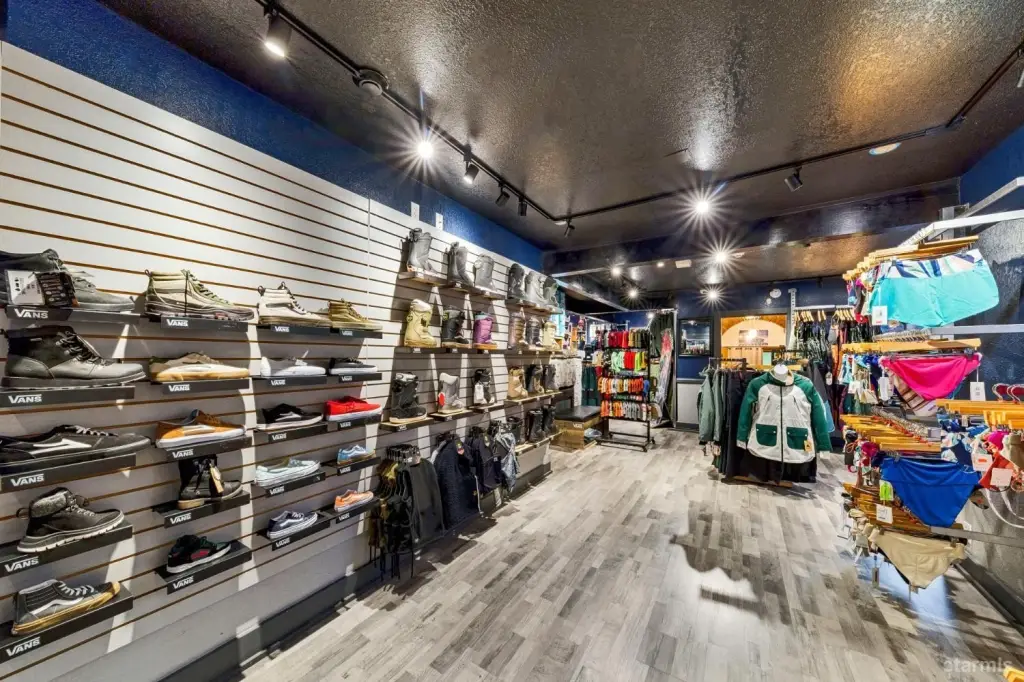
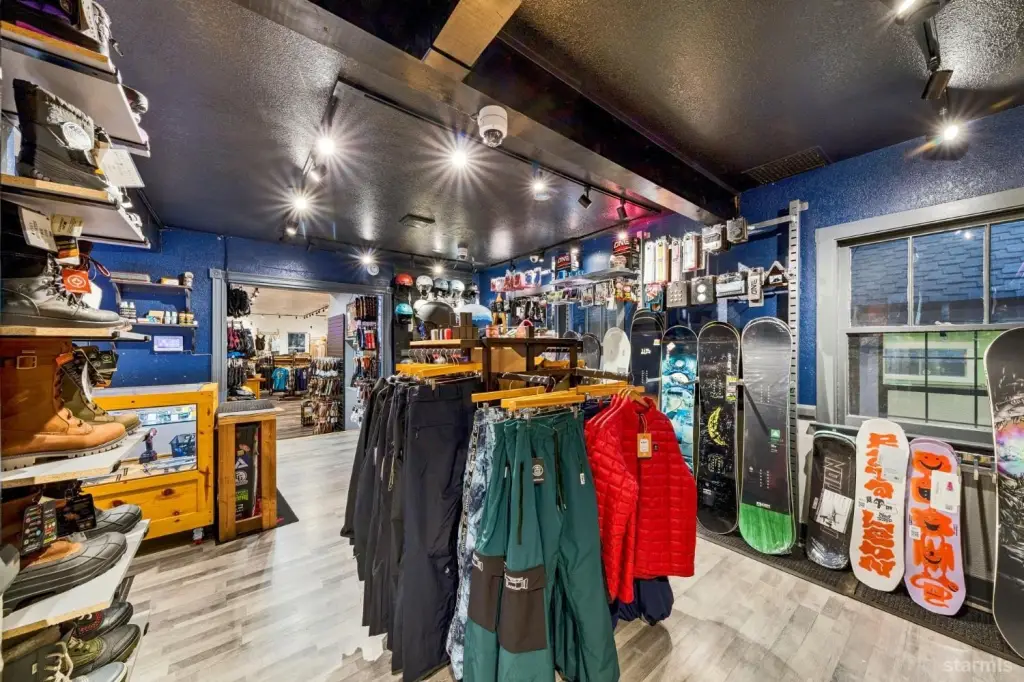
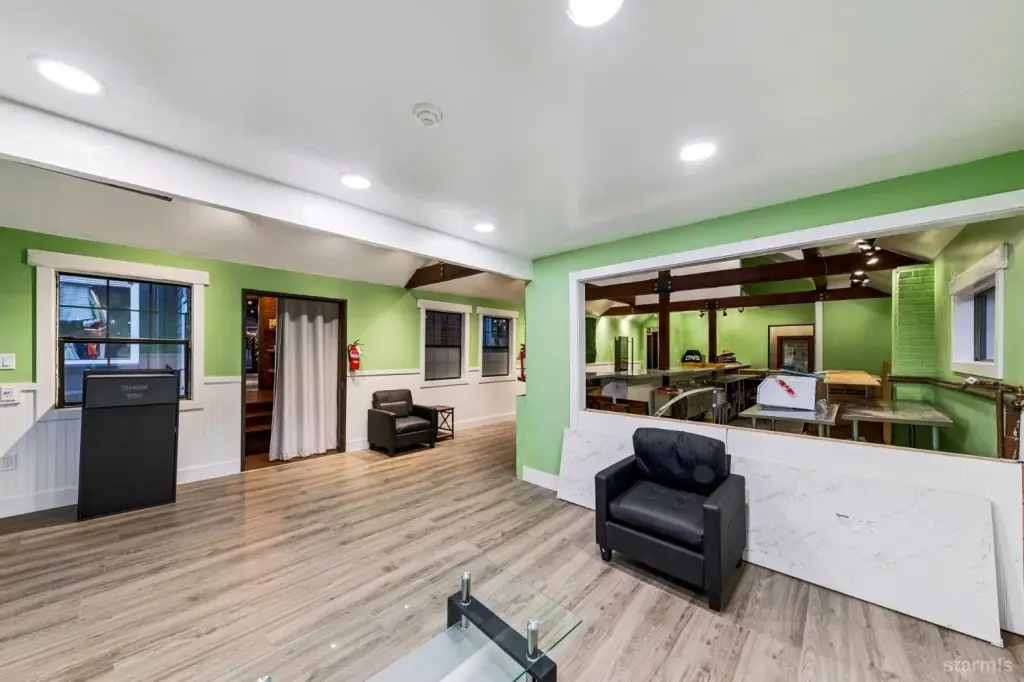
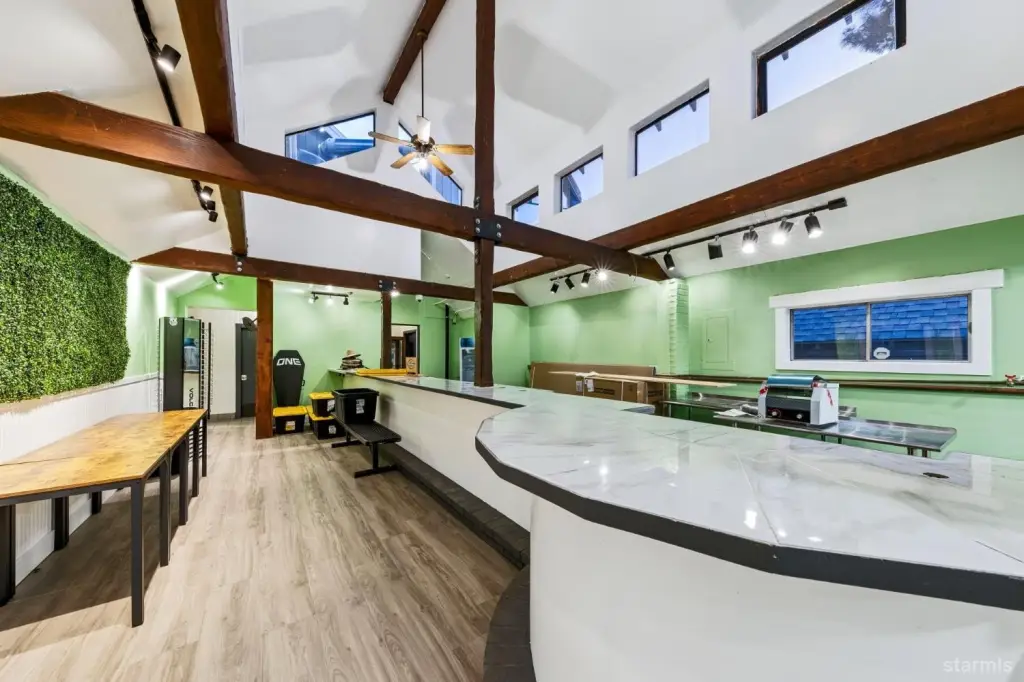
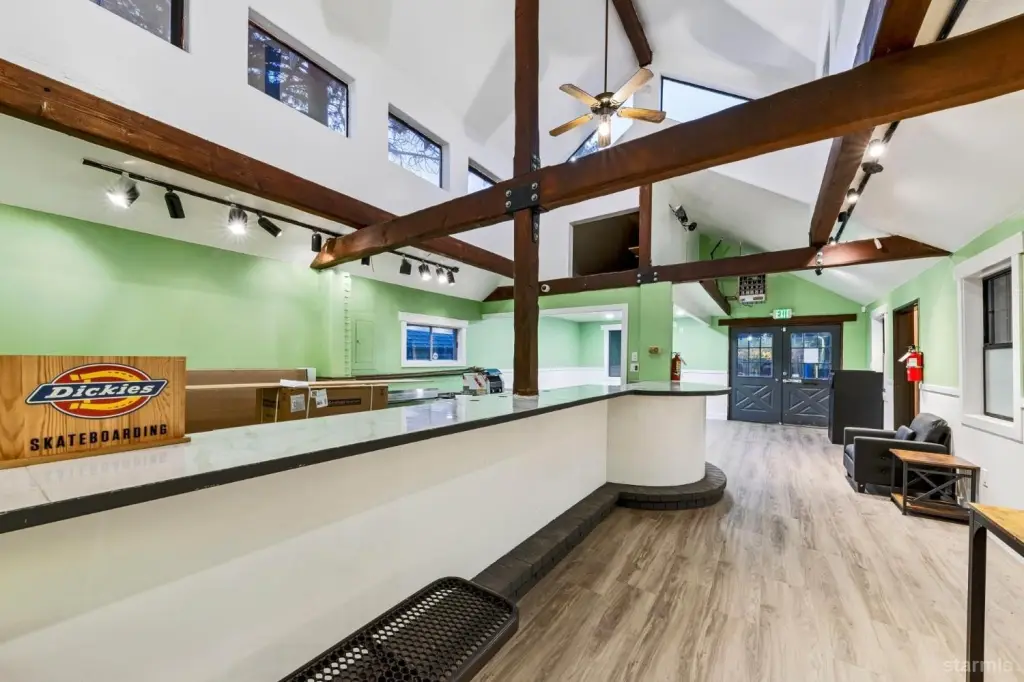
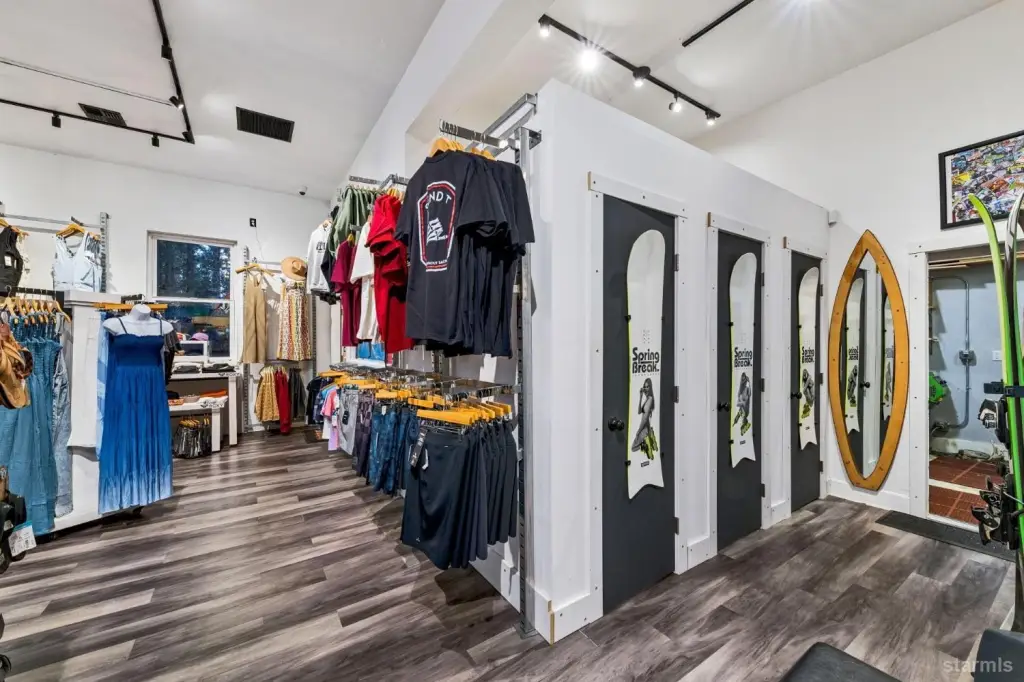
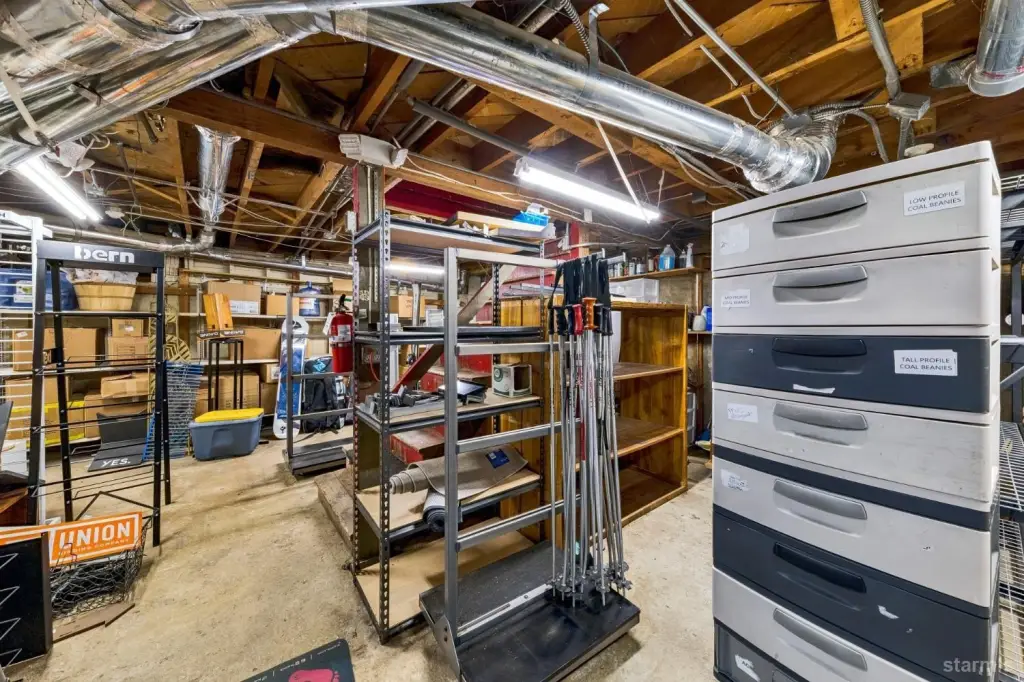
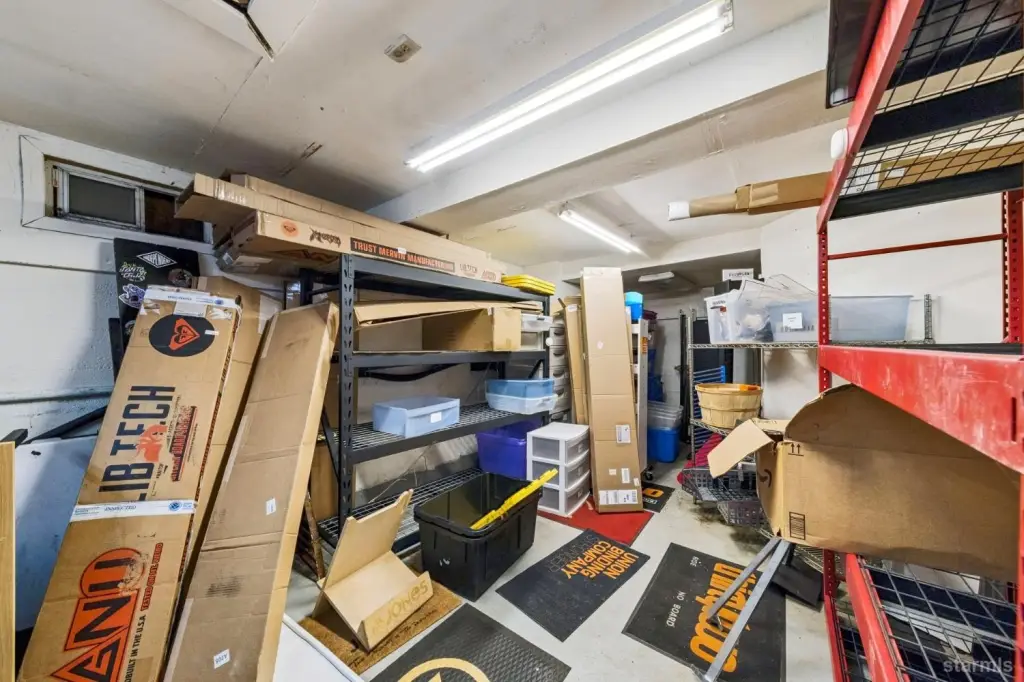
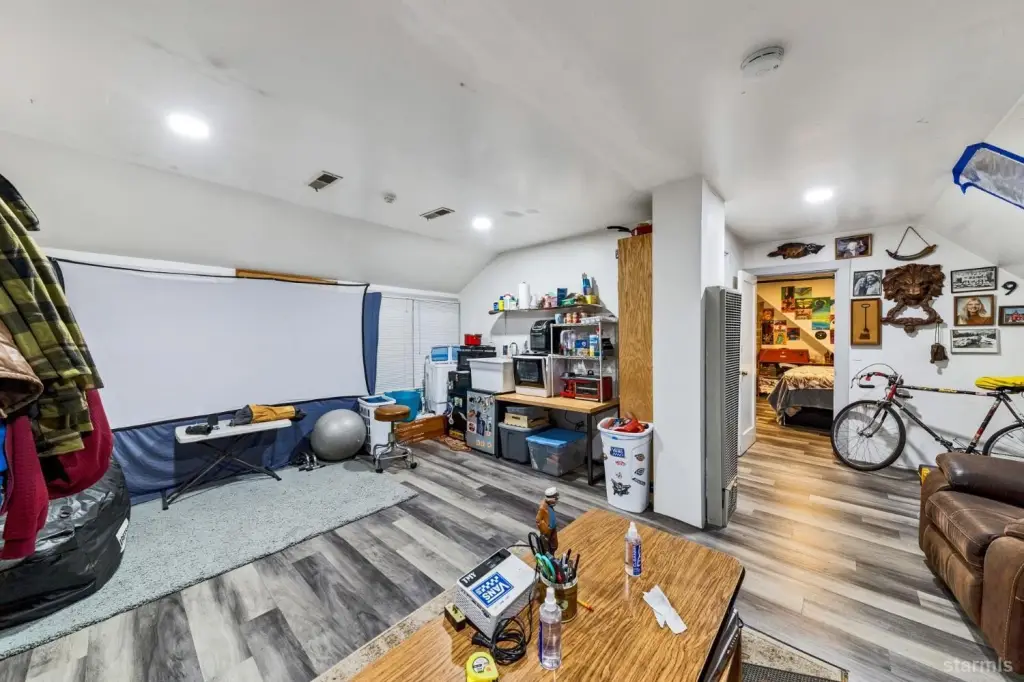
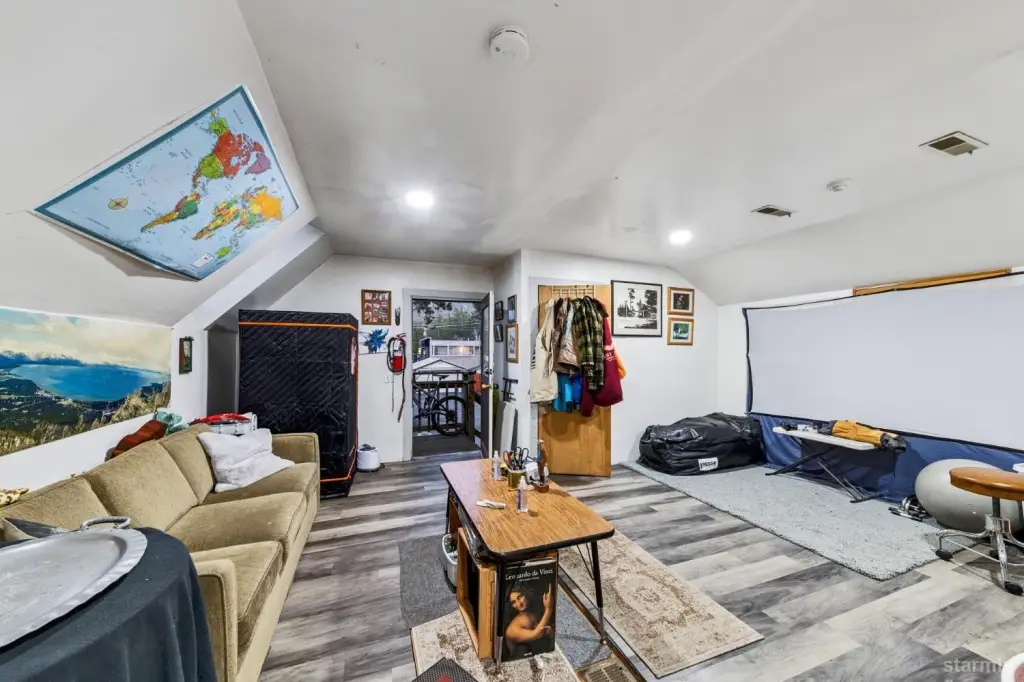
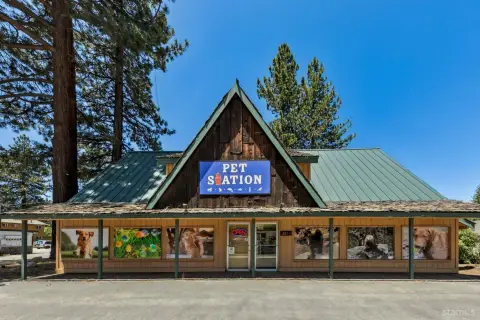
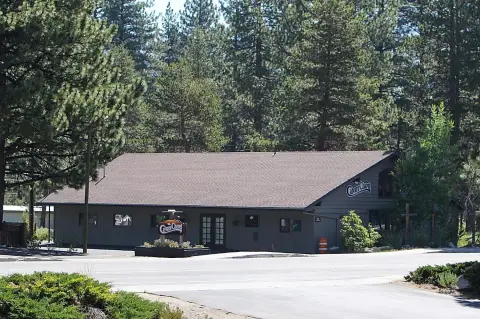
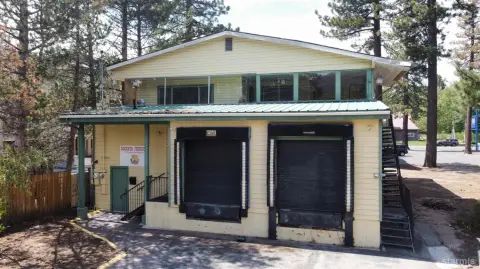
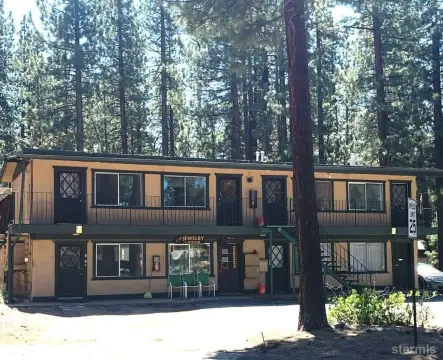
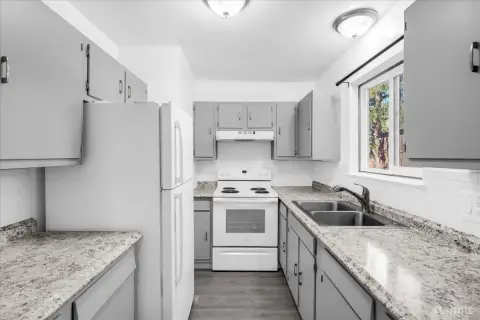
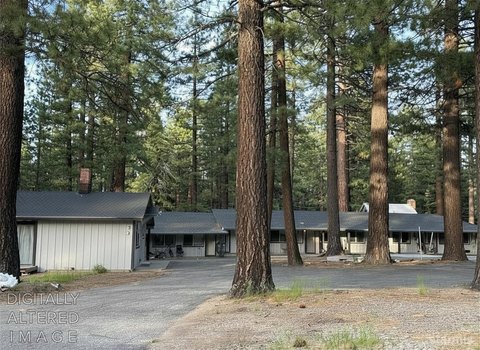
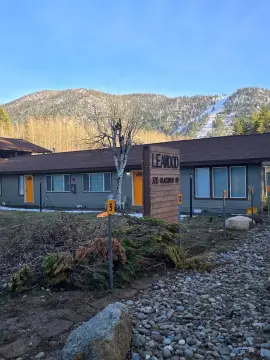
This mixed-use property comprises three buildings with retail, open-floor, hospitality, basement, and unfinished studio components. One building includes a former brewery bar with an ADA-compliant counter, upgraded electrical and plumbing, intact floor drainage, overhead ventilation infrastructure, and a capped fresh water well. Another offers 12-foot ceilings and flexible open space, while the historic commercial building includes a semi-finished basement with independent access potential and an unfinished studio apartment above. Construction includes wood frame, masonry, and wood siding, with metal and composition roofing and forced-air, electric, and natural gas heating.
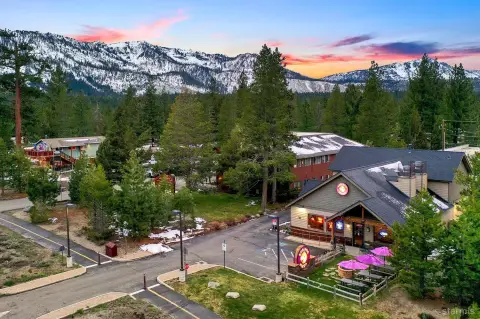
The property sits on Highway 50 in South Lake Tahoe’s Tourist Core, a quarter mile from the Heavenly Ski Resort gondola and near Ski Run Marina. The 0.43-acre site includes on-site parking and commercial zoning. The buildings date to 1937, and the current occupant has operated a board sports retail business at the property since 1984.
The property sits on Highway 50 in South Lake Tahoe’s Tourist Core, a quarter mile from the Heavenly Ski Resort gondola and near Ski Run Marina. The 0.43-acre site includes on-site parking and commercial zoning. The buildings date to 1937, and the current occupant has operated a board sports retail business at the property since 1984.
Key Highlights
- Three‑building mixed‑use property on a 0.43‑acre site
- Direct Highway 50 location in South Lake Tahoe’s Tourist Core
- Quarter mile from the Heavenly Ski Resort gondola
Financial Insights
Estimated NOI and Cap Rate
NOI / Yr
$139,922
Cap Rate
7.78%
Suggested Prices Based on Cap Rates
Cap Rate 5%
$2,798,440
$2.8M
Cap Rate 7%
$1,998,886
$2.0M
Cap Rate 9%
$1,554,689
$1.6M
Market Conditions
NOI Build-Up for 5,591 SF
Gross rent
$208.0K $37.20/SF
− Vacancy
−$21.4K −$3.83/SF
EGI
$186.6K $33.37/SF
− OpEx
−$46.6K −$8.34/SF
NOI
$139.9K $25.03/SF
Area
El Dorado County, CA
Vacancy
10.30%
Lease Rate
$37.20 /SF/Yr
Expense Ratio
25.00%
Simulate Cap Rate and NOI
Suggested Prices Based on Cap Rates
Cap Rate 5%
$2,798,440
Cap Rate 7%
$1,998,886
Cap Rate 9%
$1,554,689
Alternative Uses
Best Use
Specialty Retail
$2.00M
$1.75M – $2.33M
NOI $139,922 @ 7.0% cap · market cap 7.78%
Second Best
Retail
$1.14M
$994.4K – $1.33M
NOI $79,548 @ 7.0% cap · market cap 4.42%
Theoretical Best
—
—
same as Best Use
Zoning and permitted uses should be independently verified with authorities.
Property Analytics
Unlock full access to Insights
Subscribe to Realmo Intelligence
Open Analytics
Current Use
Lease Details
Yes
Highway access
Yes
Paved road access
Yes
Utilities to site
Location Intelligence
Trade Area within ½ mile
570
Businesses Nearby
229k
Monthly Visits Nearby
Explore this area
Business Placement
Foot Traffic Nearby
Groceries 48%
Dining 25%
Shops & Services 24%
Electronics 2%
Safeway
Groceries
78,796 visits/mo
0.4 miles
Whole Foods Market
Groceries
31,672 visits/mo
0.1 miles
Safeway Gas
Shops & Services
28,961 visits/mo
0.4 miles
McDonald's
Dining
27,814 visits/mo
0.4 miles
IHOP
Dining
9,802 visits/mo
0.4 miles
Demographics for 96150, CA
29,518
Population
23,472
Households
1.3
Avg Household Size
40
Median Age
39%
College-Educated
92%
High-School Grad
163.2 sq mi
ZIP Area
181
Density / Sq Mi
$83,738
Median Household Income
$45,582
Median Earnings
$1,497
Median Rent
$649,100
Median Home Value
Check the figures for this property
Cap Rate, Value Estimation, Potential NOI and more
View Realmo Analytics
Market
Vacancy Rate% for Retail in West region

Questions? Ask Rey
Realmo’s AI knows this listing — price, zoning, demand, history. Ask anything.



Frequently Asked Questions
What type of property is this?
Mixed-use property - Three buildings combine retail, open-floor, bar, basement, and unfinished studio components within a commercial-zoned property.
Where is this mixed-use property located?
The property is located at 3542 Lake Tahoe Boulevard South Lake Tahoe, CA.
What is the asking price?
The asking price for this property is $1,798,000.
What are key features of this property?
This property features: Three‑building mixed‑use property on a 0.43‑acre site; Direct Highway 50 location in South Lake Tahoe’s Tourist Core; Quarter mile from the Heavenly Ski Resort gondola



