Fully Occupied Residential Income
For Sale
Contact for pricing
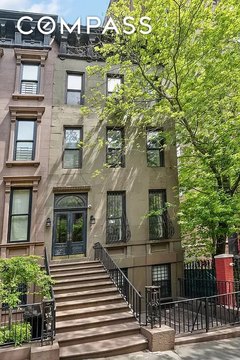
334 East 106th Street, New York, NY 10029
Fully occupied East Harlem rental property offered for sale with immediate in-place occupancy.
Property Size5,092 SF
Price / SF$736.45
Days on Market115
Property Features for 334 East 106th Street
General Information
Standard status
Active
Size
5,092 SF
Property subtype
Multifamily, Mixed Use
Zoning
R7A
Occupancy
100%
Investment Type
Stabilized
Net Operating Income
$229,098
Building Details
Year Built
1920
Stories
4
Units
7
Tenancy
Multi
Listing Agency:
JA Cohen Advisory Group LLC
Listed By:
Jack A. Cohen · License #NY 10491209522
(917) 533-8905
Source:
Crexi
Added: Jun 15
Changed: Sep 13
Last Checked: Oct 5 at 6:53PM
Displayed information is deemed reliable but is not guaranteed and should be independently verified. All listing content including descriptions, pricing, images are the copyrighted material of JA Cohen Advisory Group LLC
Investment Insights
Based on property information with market context.
This fully occupied residential income property is offered for sale at 334 East 106th Street in New York, NY 10029. The building is presented as a straightforward, occupied asset within the residential income category, designed for buyers seeking current utilization rather than a value tied to leasing-up.
Located in East Harlem, the property is described as benefiting from strong residential and commercial demand and transportation connectivity. With the asset already in place and fully occupied, day-to-day operations can be focused on maintaining resident experience and continued performance of the existing income stream.
For investors and buyers evaluating residential income holdings, the key consideration here is that the property is currently fully occupied. That means there is no leasing-up period reflected in the offering premise, and the buyer can underwrite the asset based on existing occupancy. As presented, it may also appeal to those looking to pair current income with a long-term view toward how neighborhood conditions can influence rental markets over time.
Located in East Harlem, the property is described as benefiting from strong residential and commercial demand and transportation connectivity. With the asset already in place and fully occupied, day-to-day operations can be focused on maintaining resident experience and continued performance of the existing income stream.
For investors and buyers evaluating residential income holdings, the key consideration here is that the property is currently fully occupied. That means there is no leasing-up period reflected in the offering premise, and the buyer can underwrite the asset based on existing occupancy. As presented, it may also appeal to those looking to pair current income with a long-term view toward how neighborhood conditions can influence rental markets over time.
Key Highlights
- Fully occupied rental property for sale with in‑place occupancy
- Located in East Harlem
- Built in 1920
Financial Insights
Estimated NOI and Cap Rate
NOI / Yr
$194,182
Cap Rate
5.18%
Suggested Prices Based on Cap Rates
Cap Rate 5%
$3,883,640
$3.9M
Cap Rate 7%
$2,774,029
$2.8M
Cap Rate 9%
$2,157,578
$2.2M
Market Conditions
NOI Build-Up for 5,092 SF
Gross rent
$366.6K $72.00/SF
− Vacancy
−$13.6K −$2.66/SF
EGI
$353.1K $69.34/SF
− OpEx
−$158.9K −$31.20/SF
NOI
$194.2K $38.13/SF
Area
ZIP 10029
Vacancy
3.70%
Lease Rate
$72.00 /SF/Yr
Expense Ratio
45.00%
Simulate Cap Rate and NOI
Suggested Prices Based on Cap Rates
Cap Rate 5%
$3,883,640
Cap Rate 7%
$2,774,029
Cap Rate 9%
$2,157,578
Alternative Uses
Best Use
Apartment 5plus
$2.77M
$2.43M – $3.24M
NOI $194,182 @ 7.0% cap · market cap 5.18%
Second Best
—
—
no second resolved use
Theoretical Best
Specialty Retail
$18.17M
$15.90M – $21.20M
NOI $1,271,727 @ 7.0% cap · market cap 33.91%
Zoning and permitted uses should be independently verified with authorities.
Property Analytics
Unlock full access to Insights
Subscribe to Realmo Intelligence
Open Analytics
Current Use
Location Intelligence
Trade Area within ½ mile
6,535
Businesses Nearby
Explore this area
Business Placement
Demographics for 10029, NY
78,141
Population
36,955
Households
2.1
Avg Household Size
36
Median Age
36%
College-Educated
78%
High-School Grad
1.2 sq mi
ZIP Area
65,118
Density / Sq Mi
$38,308
Median Household Income
$41,951
Median Earnings
$1,183
Median Rent
$818,100
Median Home Value
Check the figures for this property
Cap Rate, Value Estimation, Potential NOI and more
View Realmo Analytics

Questions? Ask Rey
Realmo’s AI knows this listing — price, zoning, demand, history. Ask anything.






Frequently Asked Questions
What type of property is this?
Residential income property - Fully occupied East Harlem rental property offered for sale with immediate in-place occupancy.
Where is this residential income property located?
The property is located at 334 East 106th Street New York, NY.
What is the asking price?
The asking price for this property is $3,750,000.
What are key features of this property?
This property features: Fully occupied rental property for sale with in‑place occupancy; Located in East Harlem; Built in 1920



