Move-in Ready Income
For Sale
$3,450,000
353 W 120th St, New York, NY 10027
Townhouse near Morningside Park with owner's triplex and rental units.
Property Size4,878 SF
Days on Market147
Property Features for 353 W 120th St
General Information
Standard status
Active
Size
4,878 SF
Property subtype
Multi Family
Taxes and HOA fees
Annual Taxes
$3,151
Building Details
Building Size
4,878 SF
Year Built
1899
Units
3
Listed By:
Dexter A Guerrieri
(212) 769-9600
Source:
Elliman
Added: May 21
Changed: Oct 10
Last Checked: Oct 12 at 8:48PM
Displayed information is deemed reliable but is not guaranteed and should be independently verified. All listing content including descriptions, pricing, images are the copyrighted material of Dexter A Guerrieri
Investment Insights
Based on property information with market context.
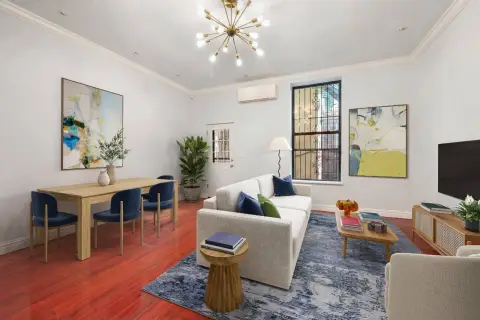
This townhouse, located half a block from Morningside Park, offers generous proportions, refined finishes, and natural light. The property is configured as an owner’s triplex with two full-floor rental residences above, presenting an opportunity for end users and investors. The owner’s residence includes entertaining areas, indoor-outdoor living, and renovated interiors, while the upper floor-through units provide layouts with rental appeal. Recent capital improvements include a new boiler, upgraded heating, and replaced windows. The garden level serves as a private retreat with access to the approximately 850-square-foot garden, two bedrooms, a large hallway storage closet, and a full bath. The primary suite includes an en-suite bathroom with a soaking tub and a walk-in closet. The parlor floor features a 60-foot-long living and dining area, a wood-burning fireplace, and an open kitchen. An additional flexible room can function as a bedroom, library, or home office. The finished cellar level offers approximately 575 square feet of flexible space designed for storage, recreation, and everyday utility, including a dedicated gym area, laundry with washer and dryer, and three separate utility rooms. The third-floor rental unit is a floor-through residence with northern garden views, a pass-through kitchen, a living and dining area with exposed brick detail and three oversized windows, two north-facing bedrooms, a full bathroom, and a hallway utility closet. The fourth-floor rental unit is a floor-through apartment with south-facing exposures and private outdoor access. It includes a living room with three large south-facing windows, a pass-through kitchen, a full hallway bathroom, an entry foyer, a primary suite with direct access to a private terrace and two closets, and an in-unit washer and dryer. The property has a bike score of 70, a walk score of 91, and a transit score of 100.
Key Highlights
- Live‑with‑Income Townhouse: Owner's triplex with two full‑floor rental units offering income potential.
- Exceptionally Low Taxes: Significant cost savings due to low multi‑family taxes.
- Prime Location: Half a block from Morningside Park, close to green space, culture, dining, and convenient transportation (Transit Score: 100).
Financial Insights
Estimated NOI and Cap Rate
NOI / Yr
$165,089
Cap Rate
4.79%
Suggested Prices Based on Cap Rates
Cap Rate 5%
$3,301,780
$3.3M
Cap Rate 7%
$2,358,414
$2.4M
Cap Rate 9%
$1,834,322
$1.8M
Market Conditions
NOI Build-Up for 4,878 SF
Gross rent
$248.8K $51.00/SF
− Vacancy
−$12.9K −$2.65/SF
EGI
$235.8K $48.35/SF
− OpEx
−$70.8K −$14.50/SF
NOI
$165.1K $33.84/SF
Area
New York, NY
Vacancy
5.20%
Lease Rate
$51.00 /SF/Yr
Expense Ratio
30.00%
Simulate Cap Rate and NOI
Suggested Prices Based on Cap Rates
Cap Rate 5%
$3,301,780
Cap Rate 7%
$2,358,414
Cap Rate 9%
$1,834,322
Alternative Uses
Best Use
Multifamily LT 5
$2.36M
$2.06M – $2.75M
NOI $165,089 @ 7.0% cap · market cap 4.79%
Second Best
Apartment 5plus
$2.18M
$1.91M – $2.54M
NOI $152,619 @ 7.0% cap · market cap 4.42%
Theoretical Best
Specialty Retail
$12.14M
$10.62M – $14.17M
NOI $849,943 @ 7.0% cap · market cap 24.64%
Zoning and permitted uses should be independently verified with authorities.
How Realmo checks its estimates
Property Analytics
Unlock full access to Insights
Subscribe to Realmo Intelligence
Open Analytics
Current Use
Location Intelligence
Trade Area within ½ mile
9,585
Businesses Nearby
Explore this area
Business Placement
Demographics for 10027, NY
64,037
Population
28,038
Households
2.3
Avg Household Size
32
Median Age
52%
College-Educated
87%
High-School Grad
0.9 sq mi
ZIP Area
71,152
Density / Sq Mi
$64,220
Median Household Income
$44,231
Median Earnings
$1,609
Median Rent
$915,000
Median Home Value
Check the figures for this property
Cap Rate, Value Estimation, Potential NOI and more
View Realmo Analytics
Market
Vacancy Rate% for Multifamily in Northeast region

Questions? Ask Rey
Realmo’s AI knows this listing — price, zoning, demand, history. Ask anything.




Frequently Asked Questions
What type of property is this?
Triplex - Townhouse near Morningside Park with owner's triplex and rental units.
Where is this triplex located?
The property is located at 353 W 120th St New York, NY.
What is the asking price?
The asking price for this property is $3,450,000.
What are key features of this property?
This property features: Live‑with‑Income Townhouse: Owner's triplex with two full‑floor rental units offering income potential.; Exceptionally Low Taxes: Significant cost savings due to low multi‑family taxes.; Prime Location: Half a block from Morningside Park, close to green space, culture, dining, and convenient transportation (Transit Score: 100).


