Mixed-Use Property with Existing
For Sale
$8,500,000
302 W Washington Street, Greenville, SC 29601
Commercial/Industrial, Greenville, SC
Property Size58,662 SF
Lot Size2.07 Acres
Price / SF$144.90
Days on Market79
Property Features for 302 W Washington Street
General Information
Property type
Commercial Sale
Property subtype
Other
Subdivision
075
Standard status
Active
APN
0015.00-01-022.00
Lot size
2.07 Acres
Utilities
Heating system
Forced Air
Water source
Public
Building Details
Flooring type
Tile, Concrete, Linoleum, Carpet
Building materials
Block, Brick
Listing Agency:
Joy Real Estate
(864) 297-3111
Listed By:
Autumn Bishop
(864) 357-9815
Added: Jul 28
Changed: Oct 13
Last Checked: Oct 14 at 10:06AM
MLS# 1599007
Copyright © 2026 Greater Greenville Association of Realtors. All rights reserved. All information provided by the listing agent/broker is deemed reliable but is not guaranteed and should be independently verified.
Investment Insights
Based on property information with market context.
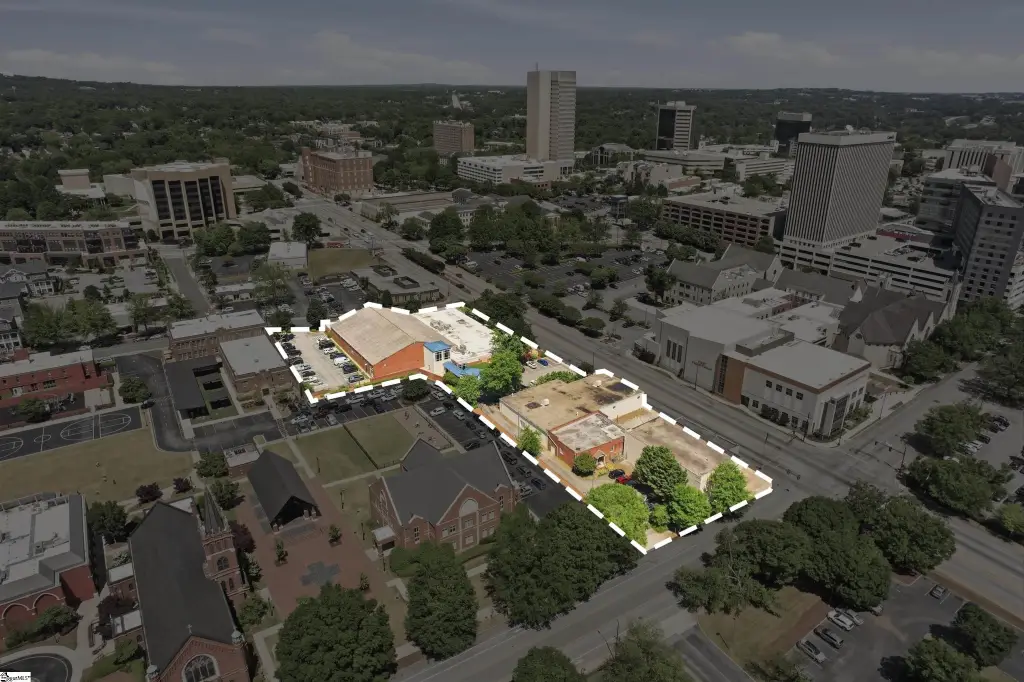
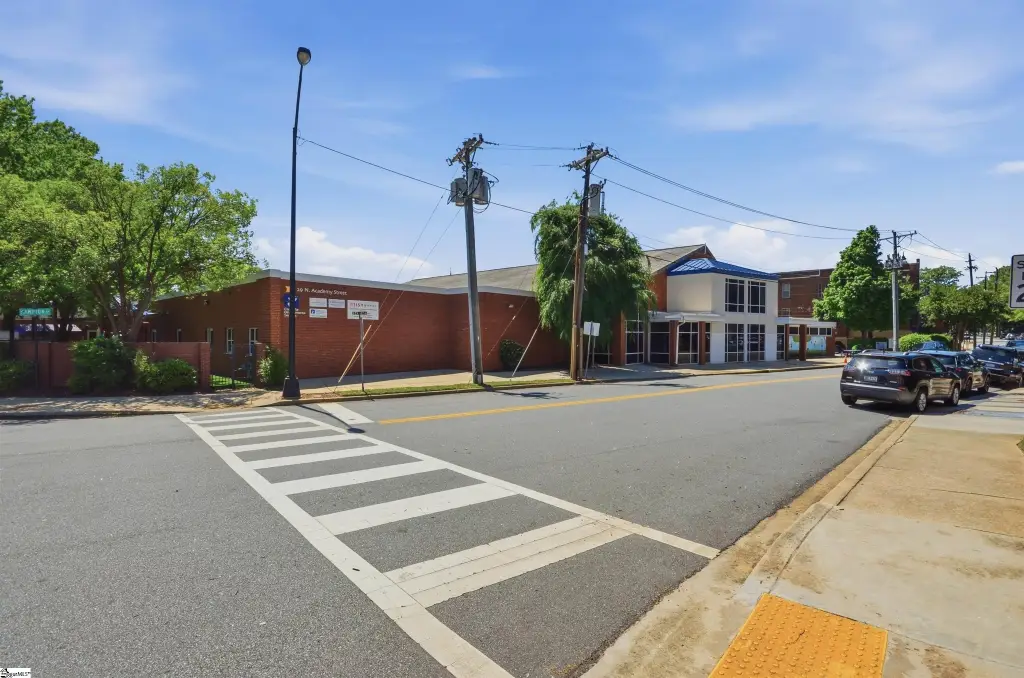
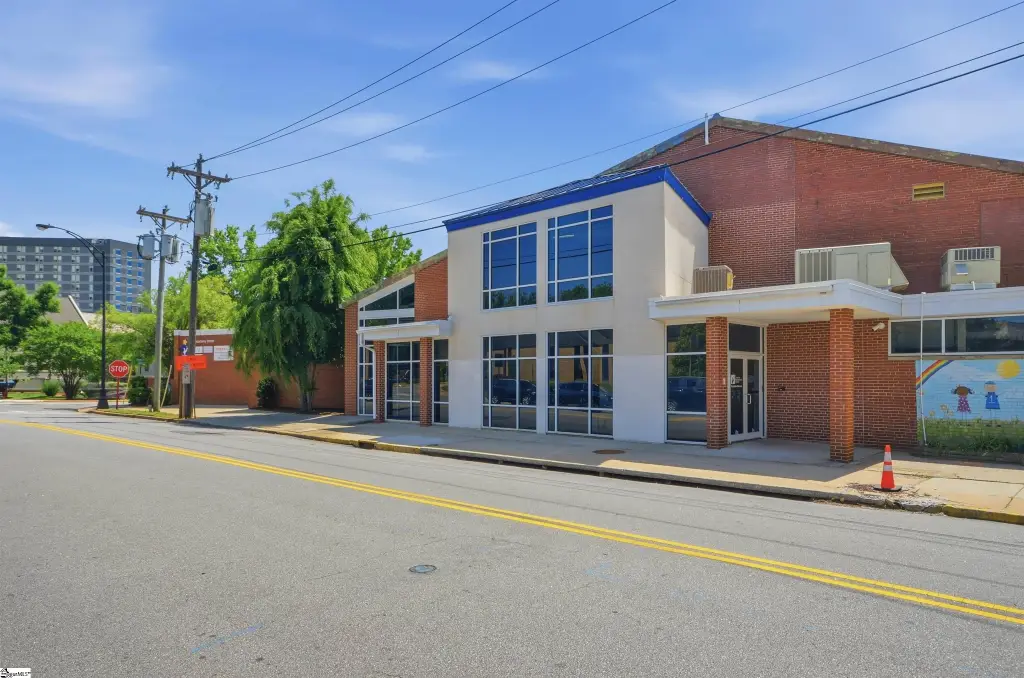
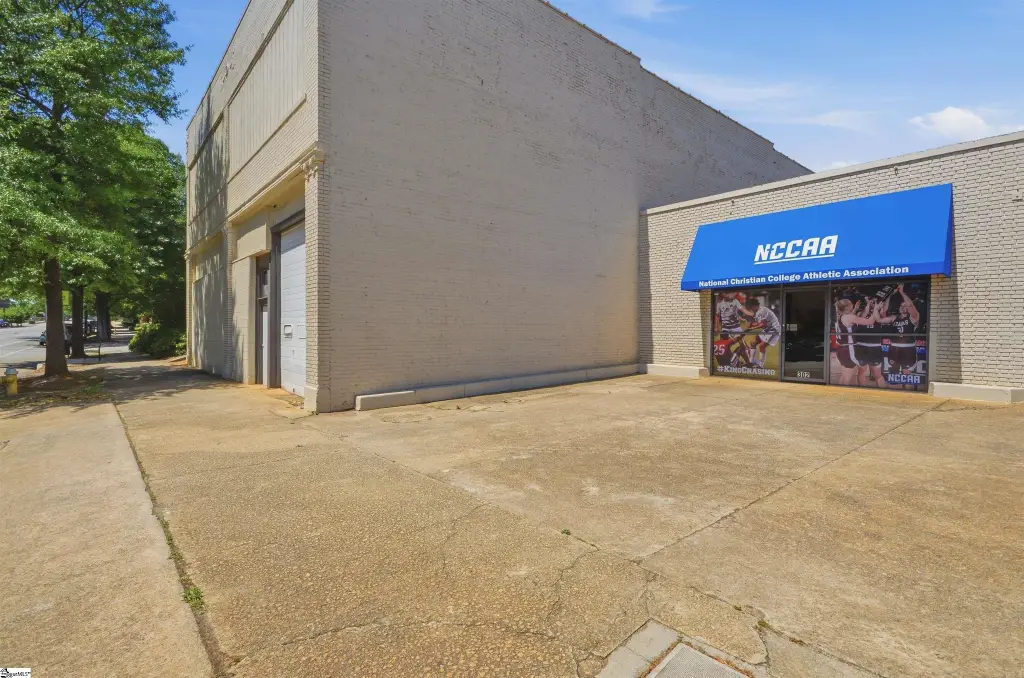
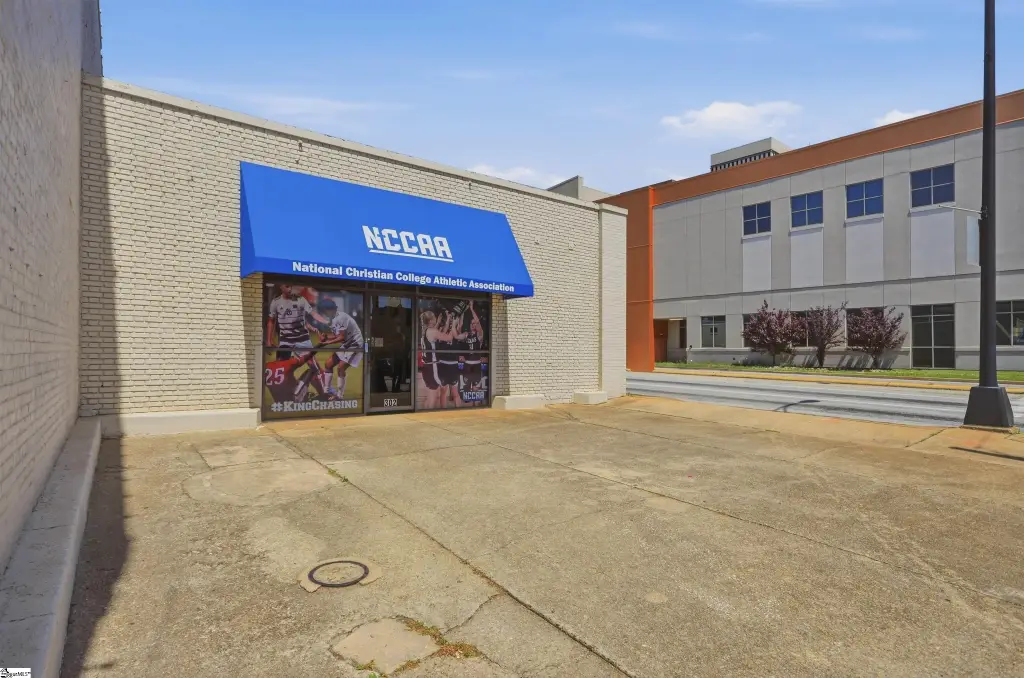
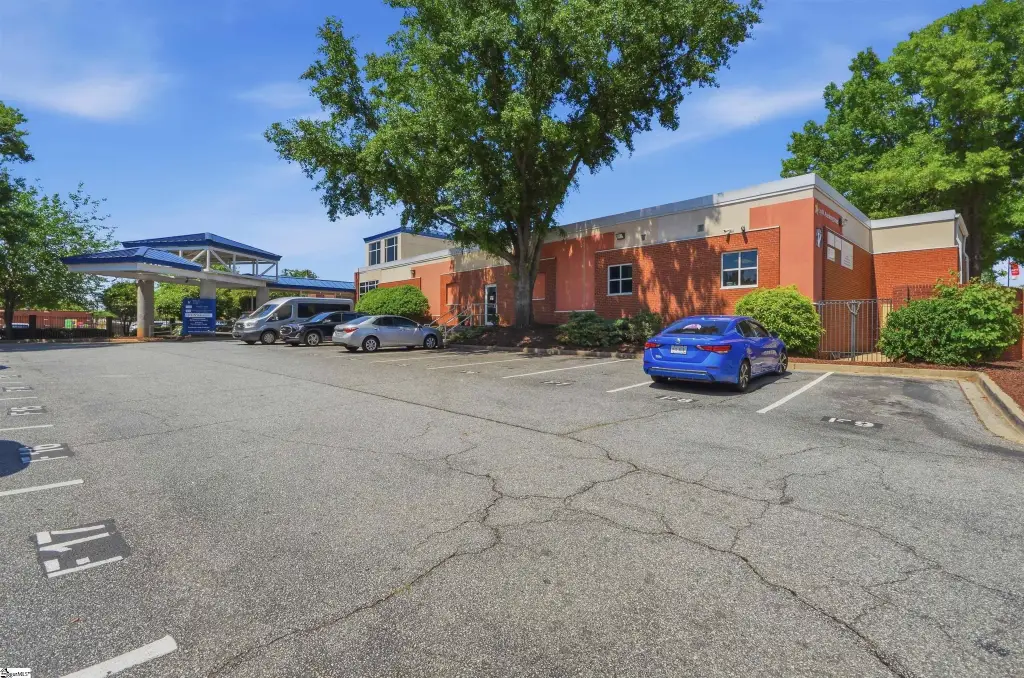
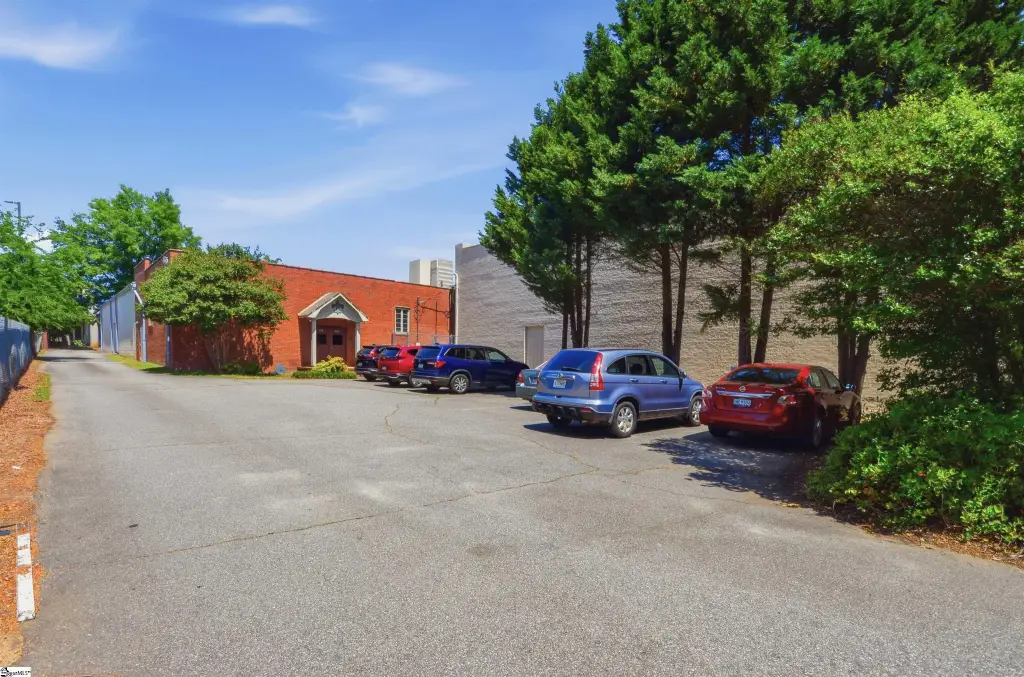
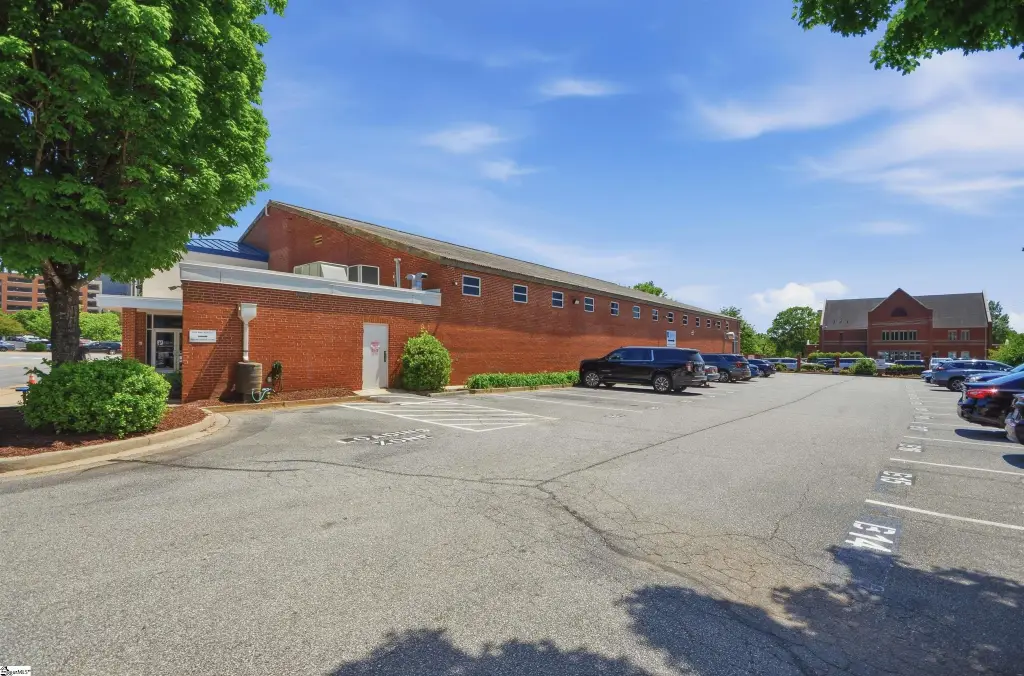
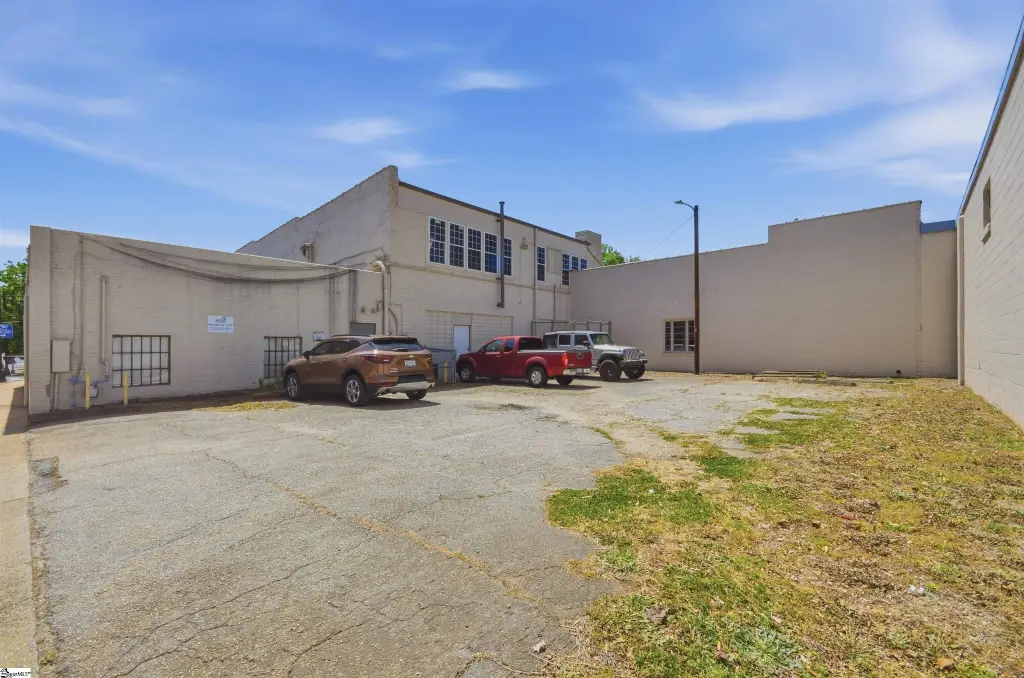
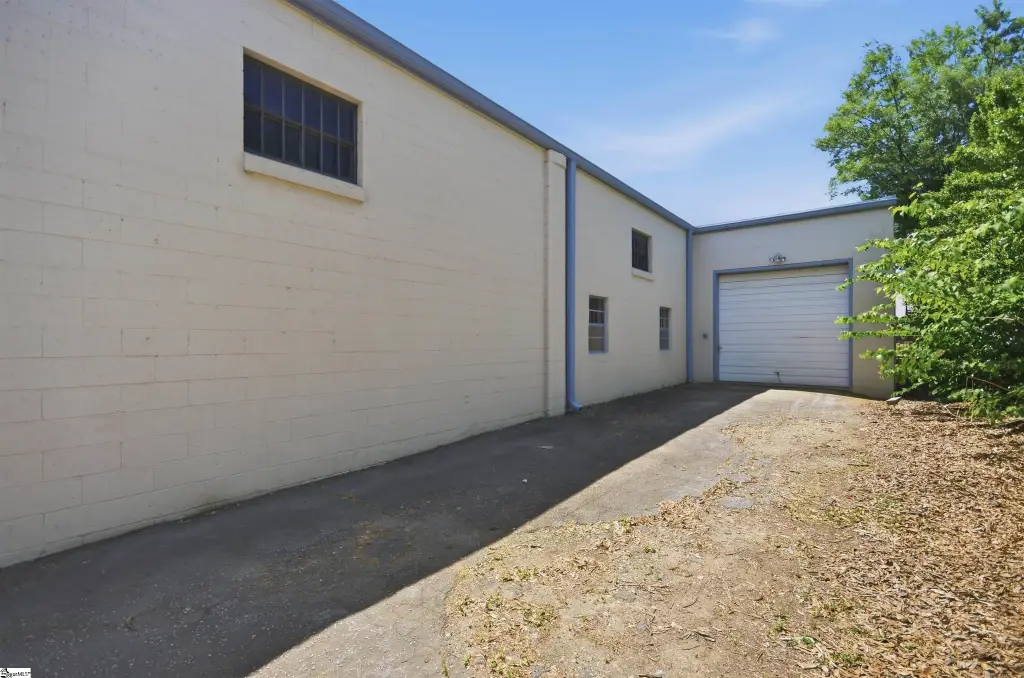
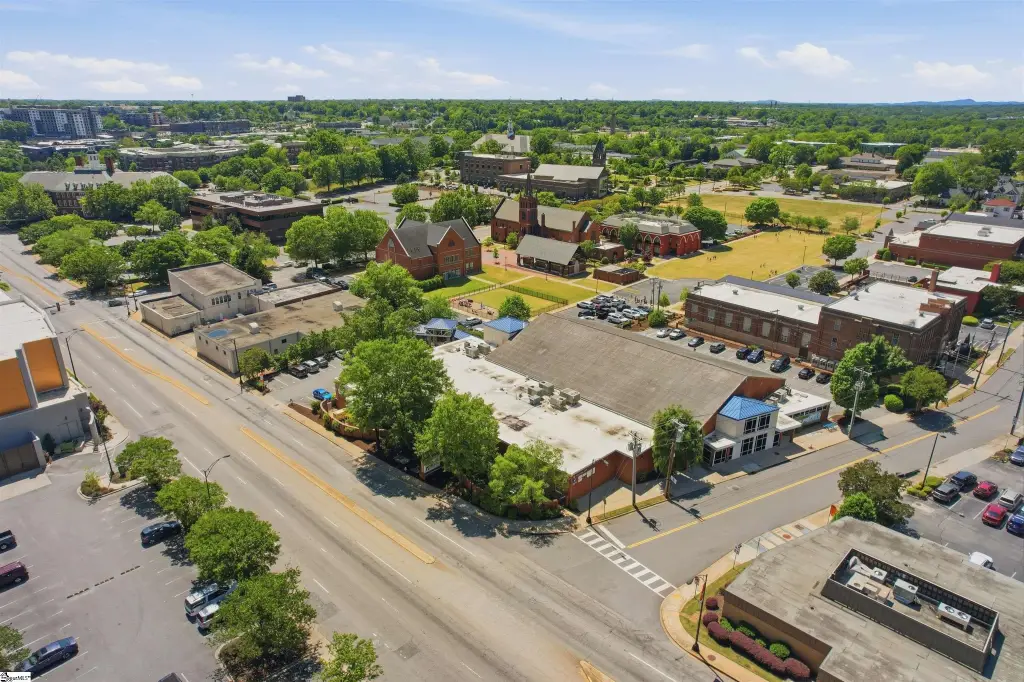
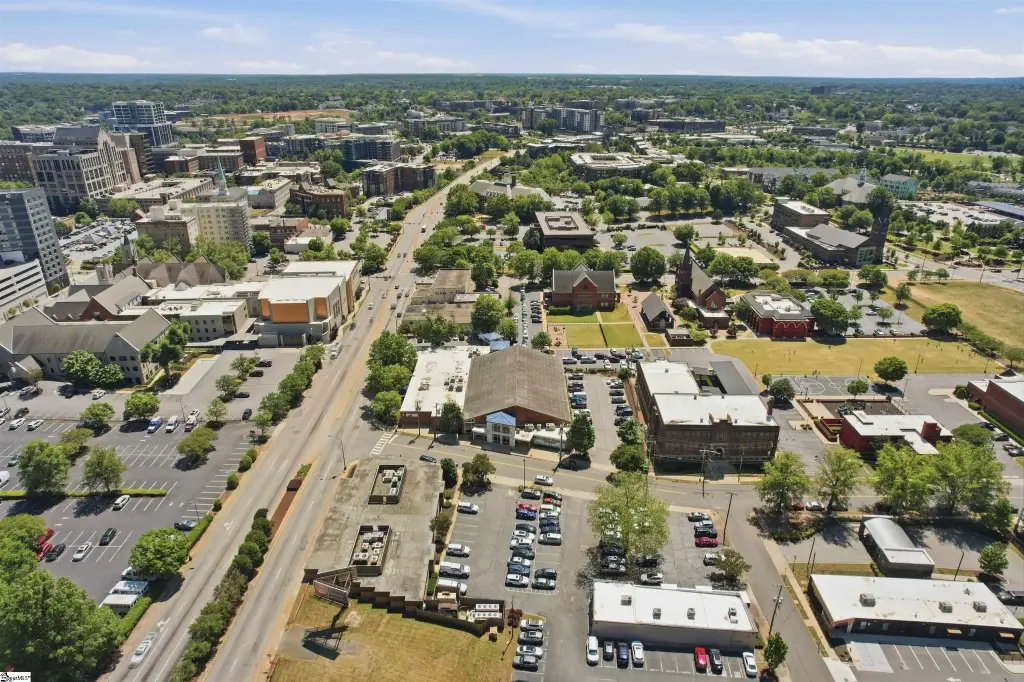
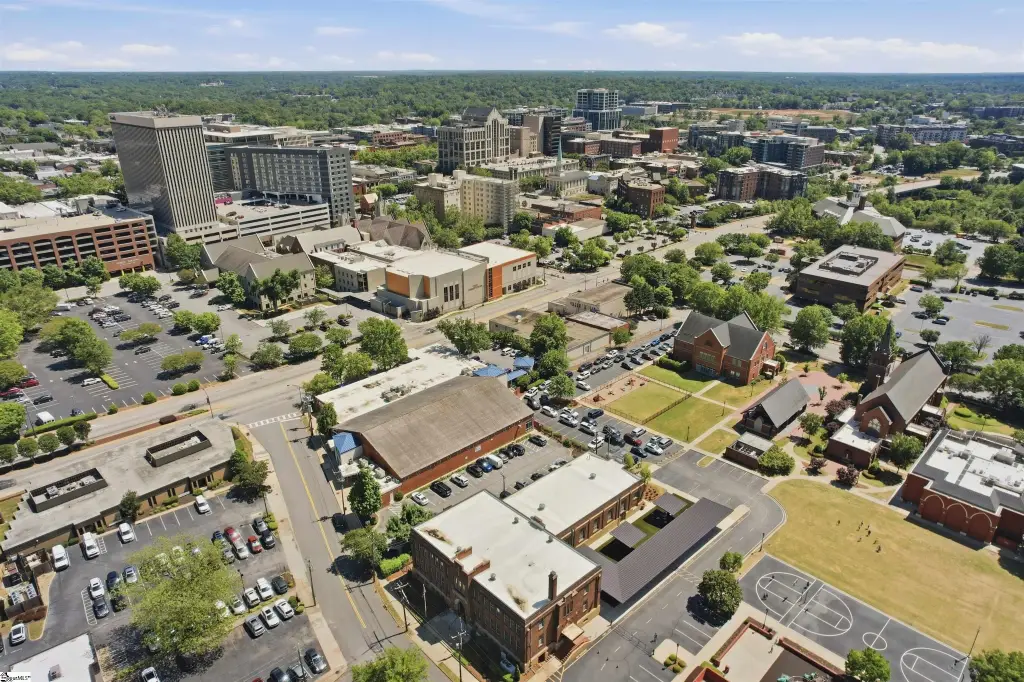
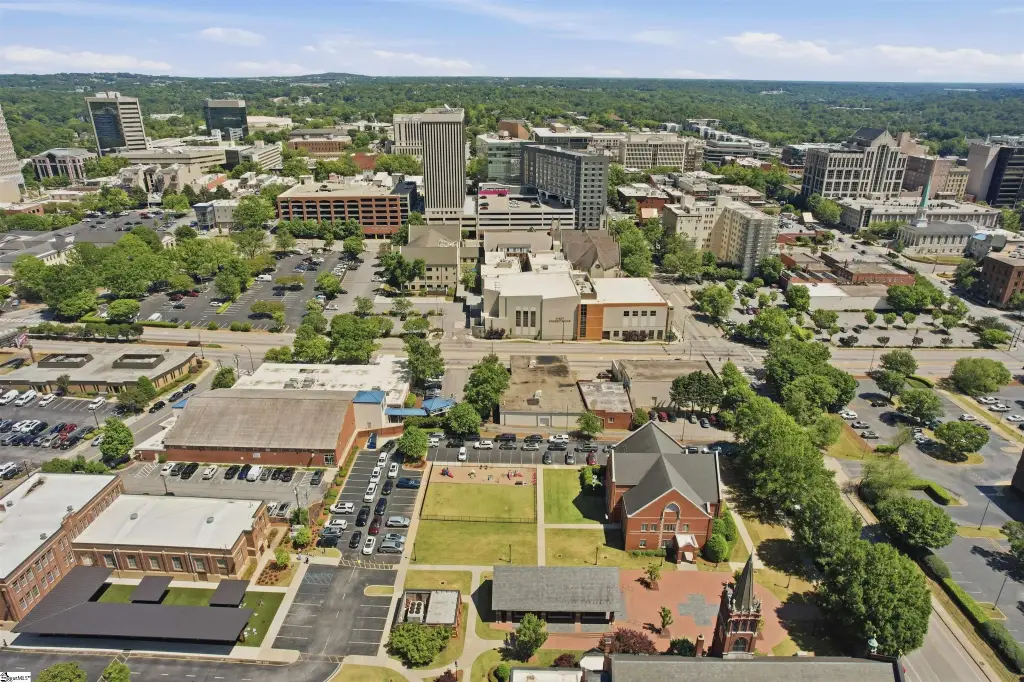
This mixed-use assemblage comprises five contiguous parcels totaling 2.07 acres, with approximately 58,662 square feet of existing improvements. Construction includes block and brick materials, while interior finishes include tile, linoleum, concrete, and carpet. The property is served by public water and heated by a forced-air system. Existing improvements support consideration of office, institutional, warehouse, or adaptive-reuse applications, subject to applicable approvals.
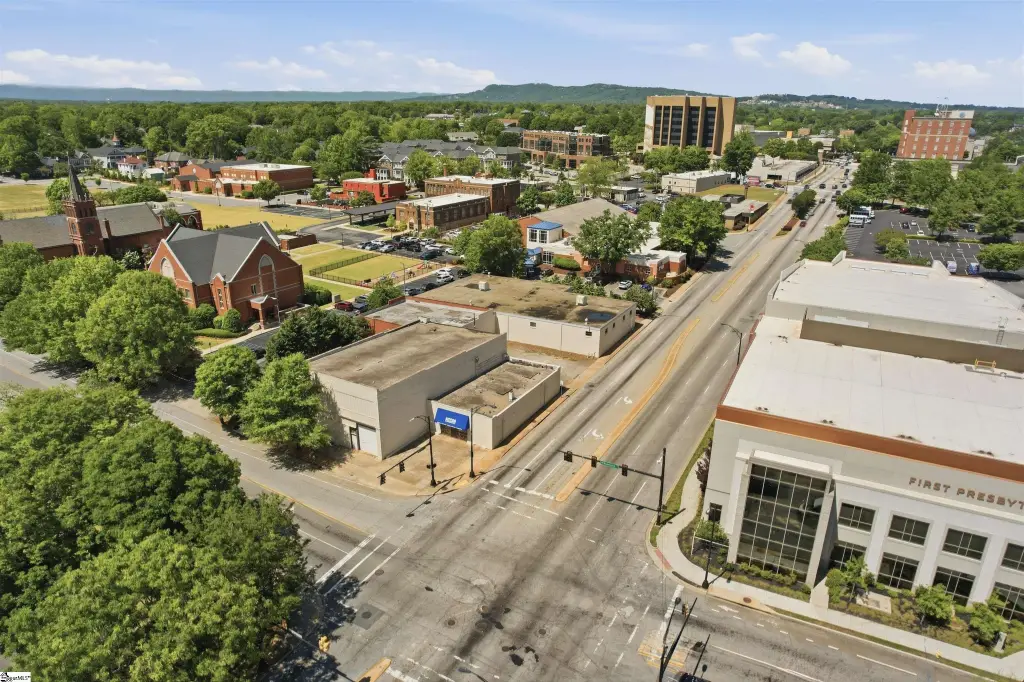
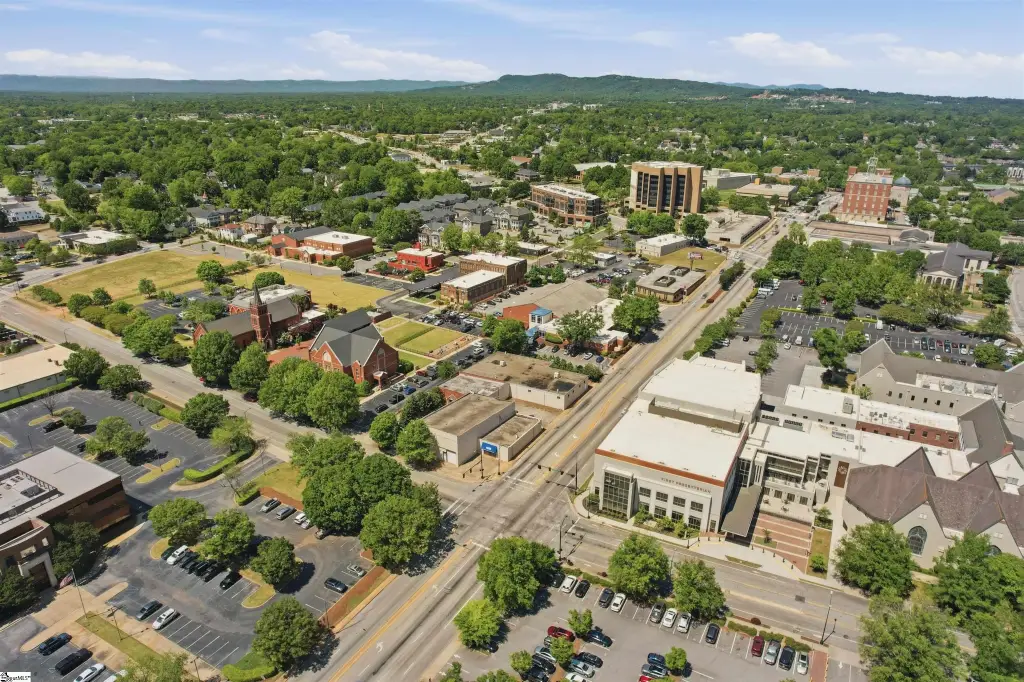
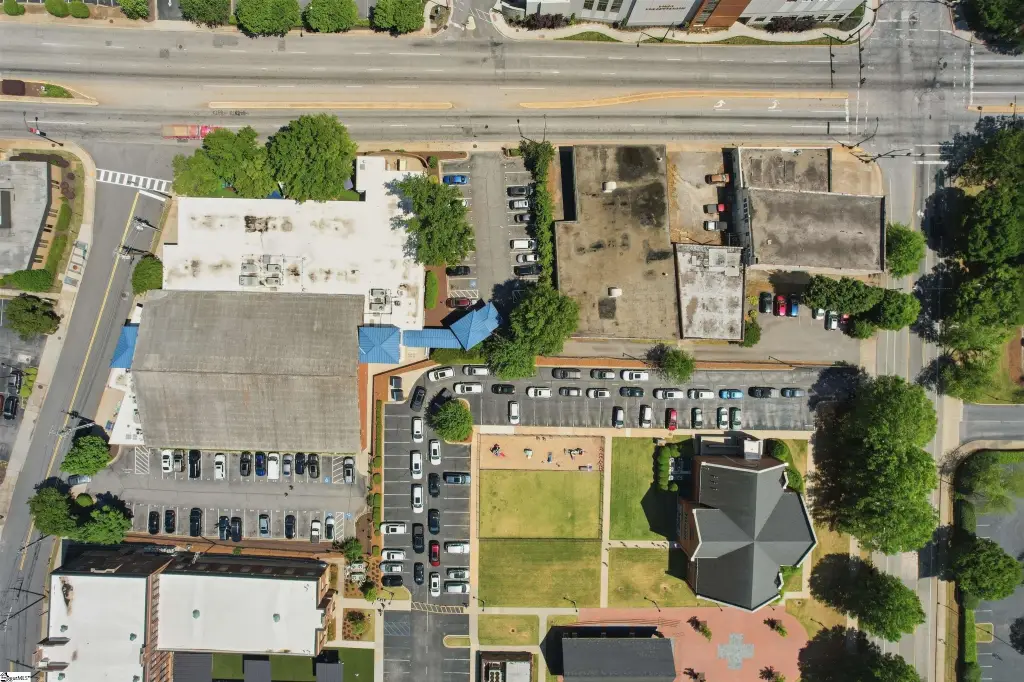
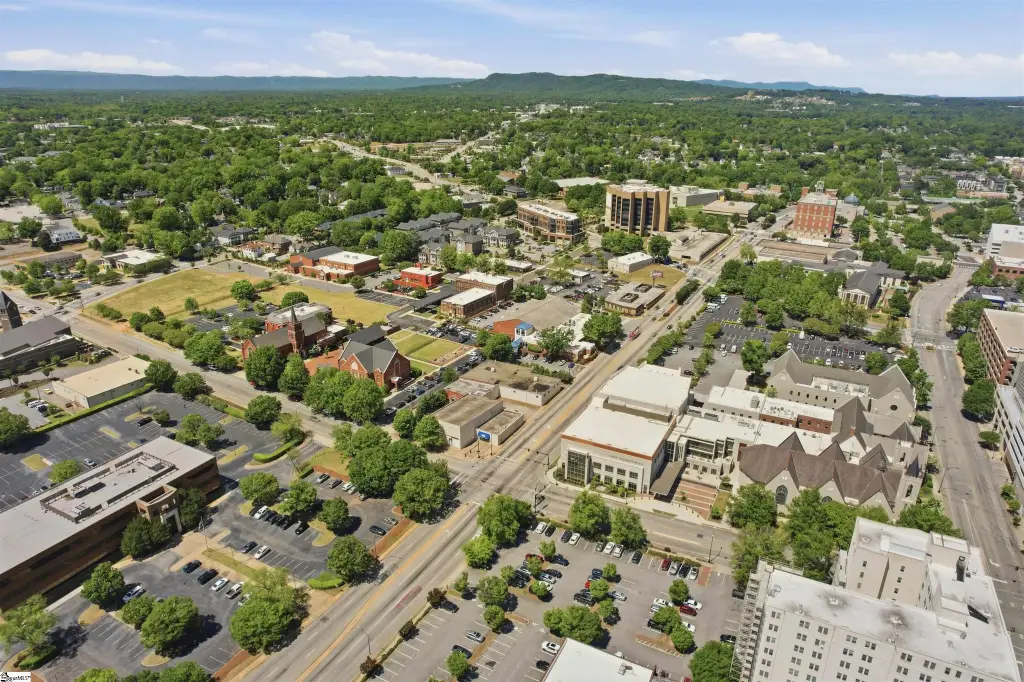
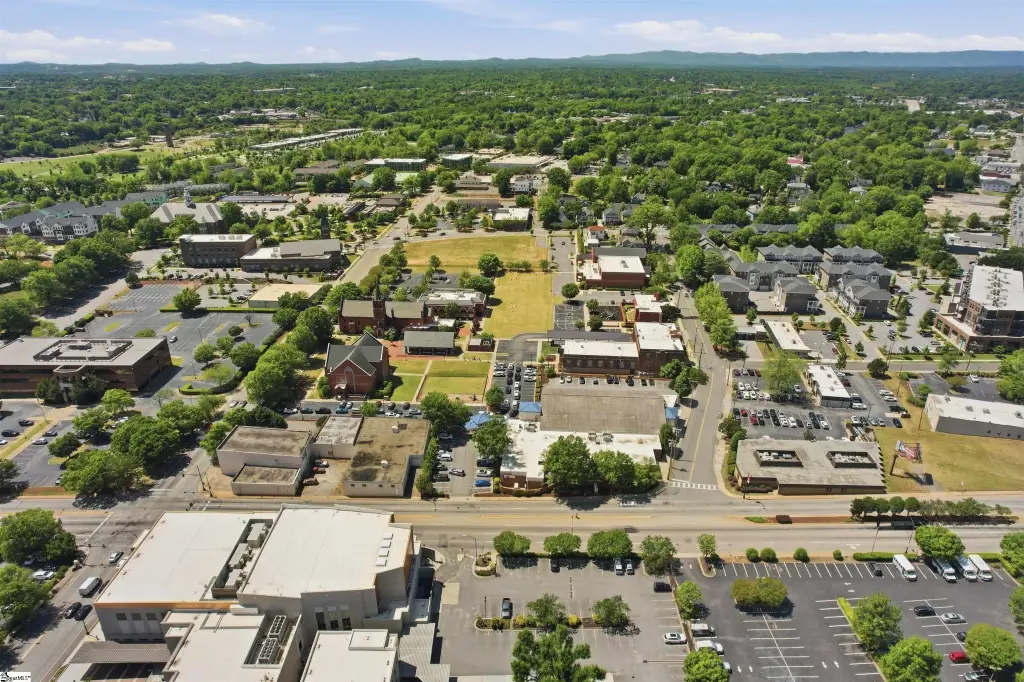
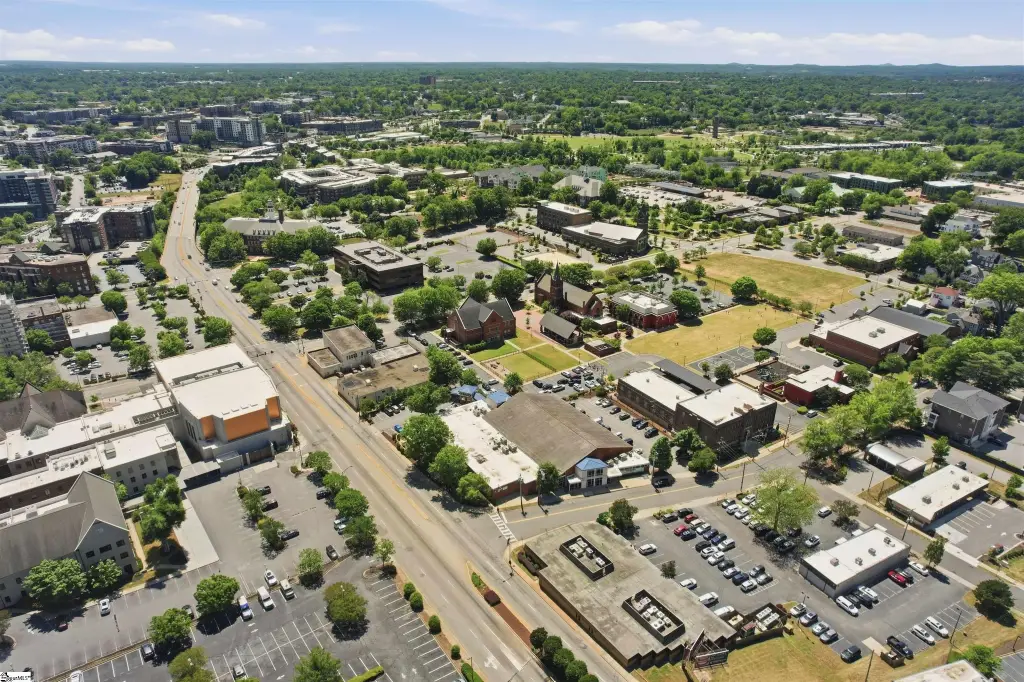
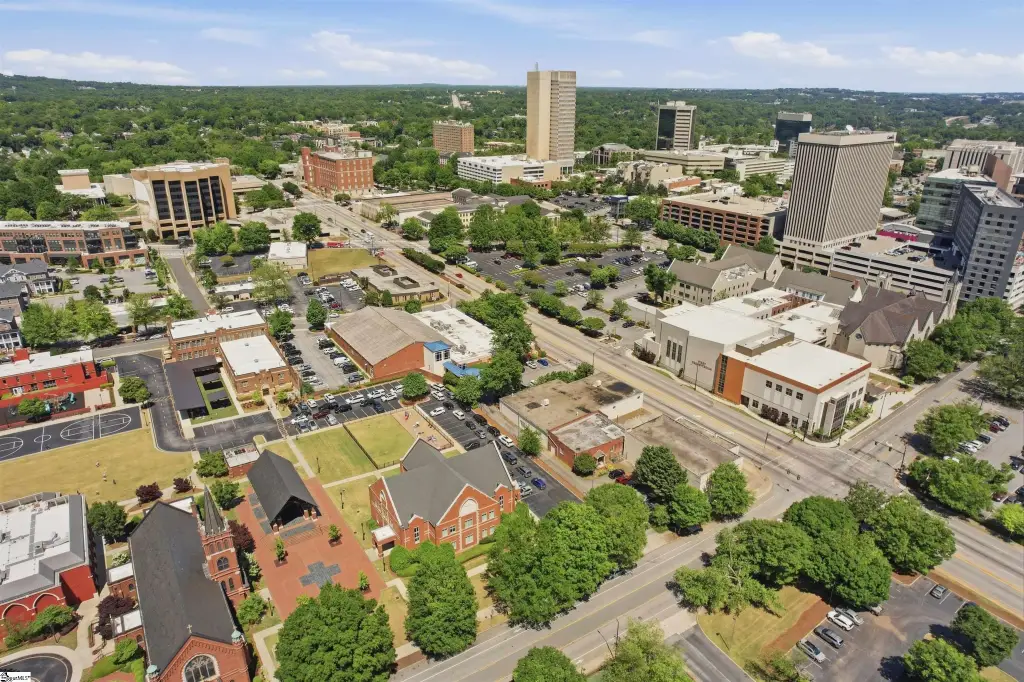
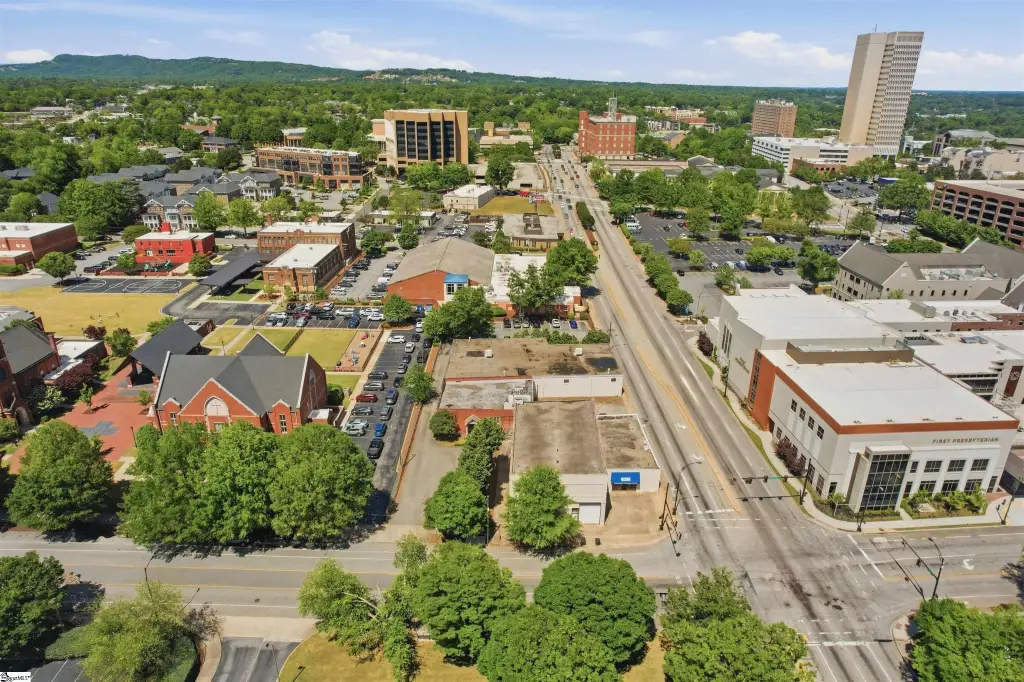
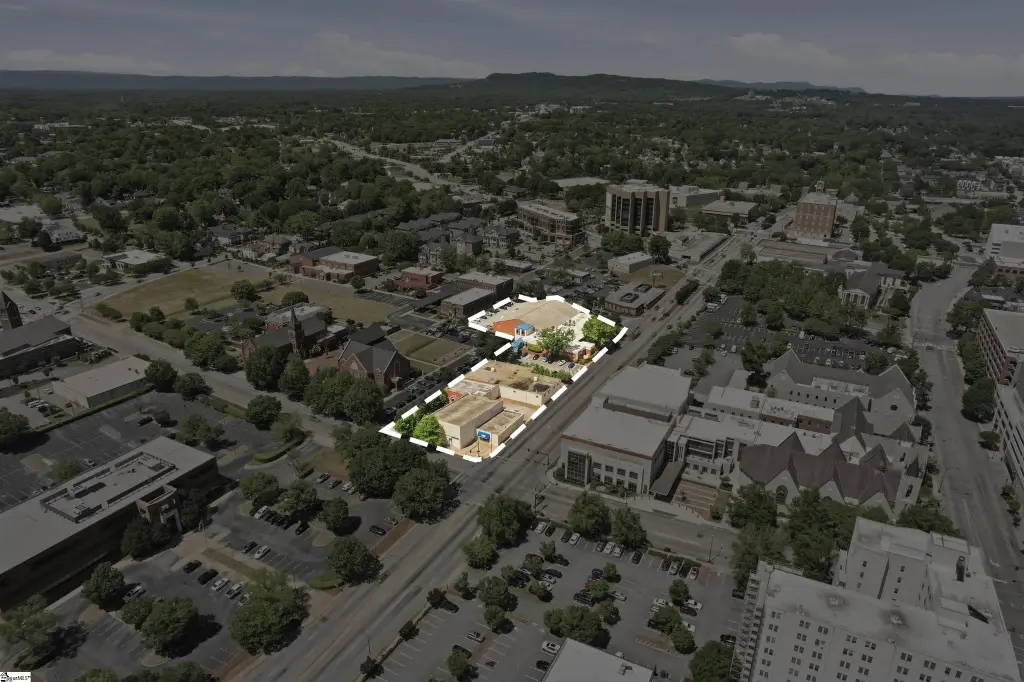
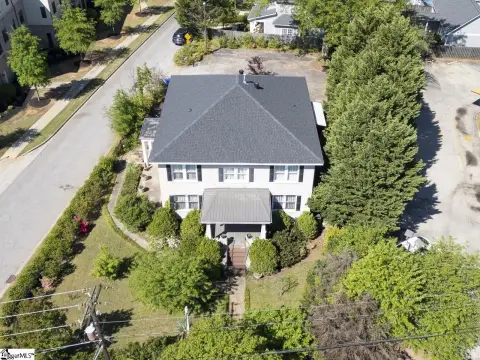
The site occupies a corner position along Academy Street and West Washington Street in Downtown Greenville, with frontage on both streets. Its setting places the property between Heritage Green, the West End, and the North Main corridor. The address is 302 W Washington Street, Greenville, SC 29601.
The site occupies a corner position along Academy Street and West Washington Street in Downtown Greenville, with frontage on both streets. Its setting places the property between Heritage Green, the West End, and the North Main corridor. The address is 302 W Washington Street, Greenville, SC 29601.
Key Highlights
- 2.07‑acre corner assemblage comprising five contiguous parcels
- Approximately 58,662 square feet of existing improvements
- Frontage along Academy Street and West Washington Street
Financial Insights
Estimated NOI and Cap Rate
NOI / Yr
$607,152
Cap Rate
7.14%
Suggested Prices Based on Cap Rates
Cap Rate 5%
$12,143,040
$12.1M
Cap Rate 7%
$8,673,600
$8.7M
Cap Rate 9%
$6,746,133
$6.7M
Market Conditions
NOI Build-Up for 58,662 SF
Gross rent
$1.06M $18.00/SF
− Vacancy
−$84.5K −$1.44/SF
EGI
$971.4K $16.56/SF
− OpEx
−$364.3K −$6.21/SF
NOI
$607.2K $10.35/SF
Area
Greenville County, SC
Vacancy
8.00%
Lease Rate
$18.00 /SF/Yr
Expense Ratio
37.50%
Simulate Cap Rate and NOI
Suggested Prices Based on Cap Rates
Cap Rate 5%
$12,143,040
Cap Rate 7%
$8,673,600
Cap Rate 9%
$6,746,133
Alternative Uses
Best Use
Mixed Use
$8.67M
$7.59M – $10.12M
NOI $607,152 @ 7.0% cap · market cap 7.14%
Second Best
—
—
no second resolved use
Theoretical Best
Office A
$25.06M
$21.93M – $29.24M
NOI $1,754,480 @ 7.0% cap · market cap 20.64%
Zoning and permitted uses should be independently verified with authorities.
How Realmo checks its estimates
Property Analytics
Unlock full access to Insights
Subscribe to Realmo Intelligence
Open Analytics
Current Use
Lease Details
Yes
Paved road access
Location Intelligence
Trade Area within ½ mile
4,238
Businesses Nearby
Explore this area
Business Placement
Demographics for 29601, SC
13,261
Population
8,067
Households
1.6
Avg Household Size
38
Median Age
52%
College-Educated
89%
High-School Grad
4.2 sq mi
ZIP Area
3,157
Density / Sq Mi
$73,321
Median Household Income
$55,727
Median Earnings
$1,406
Median Rent
$583,200
Median Home Value
Check the figures for this property
Cap Rate, Value Estimation, Potential NOI and more
View Realmo Analytics

Questions? Ask Rey
Realmo’s AI knows this listing — price, zoning, demand, history. Ask anything.



Frequently Asked Questions
What type of property is this?
Mixed-use property - Five contiguous parcels include block and brick improvements with public water service and forced-air heating.
Where is this mixed-use property located?
The property is located at 302 W Washington Street Greenville, SC.
What is the asking price?
The asking price for this property is $8,500,000.
What are key features of this property?
This property features: 2.07‑acre corner assemblage comprising five contiguous parcels; Approximately 58,662 square feet of existing improvements; Frontage along Academy Street and West Washington Street


