Reconfigurable Mixed-Use
For Sale
$1,040,000
3015 North Ocean Boulevard Unit C1C8, Fort Lauderdale, FL 33308
Approved subdivision supports flexible unit configurations for mixed-use occupancy and warehouse operations.
Property Size5,200 SF
Price / SF$200
Days on Market365
Property Features for 3015 North Ocean Boulevard Unit C1C8
General Information
Standard status
Active
Size
5,200 SF
Property subtype
Commercial Sale / Mixed Use
Amenities
8
12
Mixed Use, Warehouse
No
Security Guard
Building Details
Year Built
1974
Listing Agency:
American Dream Realty Service
Listed By:
Jonathan B Geftman · License #3625835
(215) 945-1000
Source:
Compass
Added: Oct 17, 2025
Changed: Oct 13
Last Checked: Oct 16 at 10:58AM
Displayed information is deemed reliable but is not guaranteed and should be independently verified. All listing content including descriptions, pricing, images are the copyrighted material of American Dream Realty Service

Ask AI about this property
Review the available facts, identify missing information and prepare questions for the agent.
Investment Insights
Based on property information with market context.
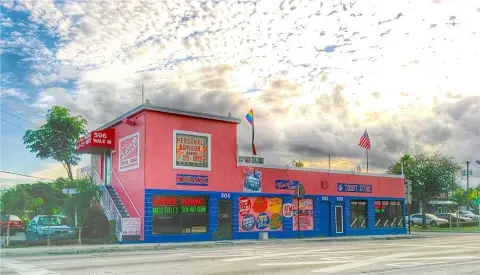
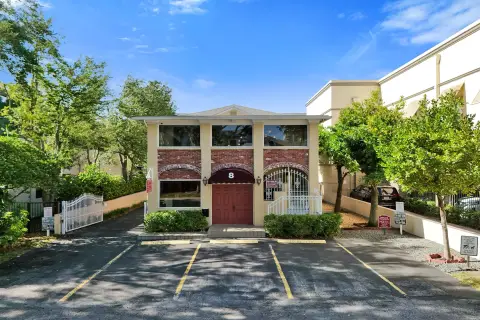
This 5,200-square-foot mixed-use property offers a flexible configuration for future subdivision. The approved plan allows the space to be delivered as a single unit, divided into two units, or legally separated into eight units, with the seller retaining the right to reconfigure the layout.
Built in 1974, the property includes mixed-use and warehouse characteristics. Security guard service is also identified among the property features. The range of supported configurations allows the physical layout to be matched to the final ownership or occupancy structure.
Built in 1974, the property includes mixed-use and warehouse characteristics. Security guard service is also identified among the property features. The range of supported configurations allows the physical layout to be matched to the final ownership or occupancy structure.
Key Highlights
- 5,200 square feet of mixed‑use property
- Subdivision approval supports multiple configurations
- Can be delivered as one, two, or eight units
Financial Insights
Estimated NOI and Cap Rate
NOI / Yr
$79,794
Cap Rate
7.67%
Suggested Prices Based on Cap Rates
Cap Rate 5%
$1,595,880
$1.6M
Cap Rate 7%
$1,139,914
$1.1M
Cap Rate 9%
$886,600
$886.6K
Market Conditions
NOI Build-Up for 5,200 SF
Gross rent
$137.3K $26.40/SF
− Vacancy
−$9.6K −$1.85/SF
EGI
$127.7K $24.55/SF
− OpEx
−$47.9K −$9.21/SF
NOI
$79.8K $15.34/SF
Area
Fort Lauderdale, FL
Vacancy
7.00%
Lease Rate
$26.40 /SF/Yr
Expense Ratio
37.50%
Simulate Cap Rate and NOI
Suggested Prices Based on Cap Rates
Cap Rate 5%
$1,595,880
Cap Rate 7%
$1,139,914
Cap Rate 9%
$886,600
Alternative Uses
Best Use
Mixed Use
$1.14M
$997.4K – $1.33M
NOI $79,794 @ 7.0% cap · market cap 7.67%
Second Best
—
—
no second resolved use
Theoretical Best
Office A
$3.49M
$3.06M – $4.08M
NOI $244,608 @ 7.0% cap · market cap 23.52%
Zoning and permitted uses should be independently verified with authorities.
How Realmo checks its estimates
Property Analytics
Current Use
Location Intelligence
Trade Area within ½ mile
2,381
Businesses Nearby
Explore this area
Business Placement
Demographics for 33308, FL
29,519
Population
23,230
Households
1.3
Avg Household Size
57
Median Age
56%
College-Educated
96%
High-School Grad
4.6 sq mi
ZIP Area
6,417
Density / Sq Mi
$83,413
Median Household Income
$58,600
Median Earnings
$1,850
Median Rent
$536,900
Median Home Value





Frequently Asked Questions
What type of property is this?
Mixed-use property - Approved subdivision supports flexible unit configurations for mixed-use occupancy and warehouse operations.
Where is this mixed-use property located?
The property is located at 3015 North Ocean Boulevard Unit C1C8 Fort Lauderdale, FL.
What is the asking price?
The asking price for this property is $1,040,000.
What are key features of this property?
This property features: 5,200 square feet of mixed‑use property; Subdivision approval supports multiple configurations; Can be delivered as one, two, or eight units


