Mixed-Use Building Near E.
For Sale
$995,000
1083 SE 17th St, Fort Lauderdale, FL 33316
Mixed-use building with restaurant, retail, and residential potential.
Property Size1,917 SF
Price / SF$519.04
Days on Market217
Property Features for 1083 SE 17th St
General Information
Standard status
Active
Size
1,917 SF
Building Details
Year Built
1968
Listing Agency:
Bonvie Realty
Listed By:
Richard J Bonvie · License #610564
(954) 232-8494
Source:
Thepennteam
Added: Mar 10
Changed: Oct 3
Last Checked: Oct 7 at 4:55PM
Displayed information is deemed reliable but is not guaranteed and should be independently verified. All listing content including descriptions, pricing, images are the copyrighted material of Bonvie Realty
Investment Insights
Based on property information with market context.
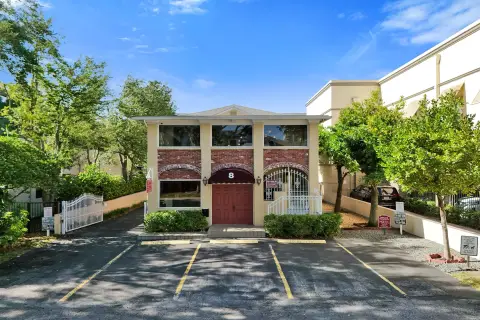
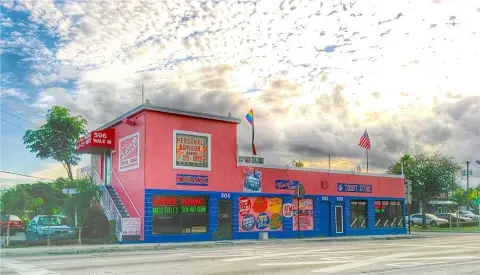
This 1,917 sq. ft. mixed-use building features restaurant and retail space on the first floor, with residential space on the second floor. The property is located off E. 17th St. Causeway in Fort Lauderdale, across the street from Quarterdeck and Whiskey Neat, and near Port Everglades and Fort Lauderdale International Airport. Downtown is also located within minutes of the property, offering accessibility and exposure. The building is offered in shell condition, ready to be customized. The property presents an investment opportunity for an owner-user or developer. For a larger footprint, the property can be combined with the adjacent 1,193 sq. ft. retail building, creating a total of 3,110 sq. ft. of contiguous space. The property was formerly the location of "Isla Pilipinos Cafe."
Key Highlights
- Prime location immediately off E. 17th St. Causeway in the heart of Ft Lauderdale.
- Flexible potential for owner‑user or developer with restaurant/retail space on the 1st floor and residential on the 2nd.
- Offered in shell condition, ready to be customized.
Financial Insights
Estimated NOI and Cap Rate
NOI / Yr
$29,416
Cap Rate
2.96%
Suggested Prices Based on Cap Rates
Cap Rate 5%
$588,320
$588.3K
Cap Rate 7%
$420,229
$420.2K
Cap Rate 9%
$326,844
$326.8K
Market Conditions
NOI Build-Up for 1,917 SF
Gross rent
$50.6K $26.40/SF
− Vacancy
−$3.5K −$1.85/SF
EGI
$47.1K $24.55/SF
− OpEx
−$17.6K −$9.21/SF
NOI
$29.4K $15.34/SF
Area
Fort Lauderdale, FL
Vacancy
7.00%
Lease Rate
$26.40 /SF/Yr
Expense Ratio
37.50%
Simulate Cap Rate and NOI
Suggested Prices Based on Cap Rates
Cap Rate 5%
$588,320
Cap Rate 7%
$420,229
Cap Rate 9%
$326,844
Alternative Uses
Best Use
Mixed Use
$420.2K
$367.7K – $490.3K
NOI $29,416 @ 7.0% cap · market cap 2.96%
Second Best
—
—
no second resolved use
Theoretical Best
Office A
$1.29M
$1.13M – $1.50M
NOI $90,176 @ 7.0% cap · market cap 9.06%
Zoning and permitted uses should be independently verified with authorities.
Property Analytics
Unlock full access to Insights
Subscribe to Realmo Intelligence
Open Analytics
Current Use
Location Intelligence
Trade Area within ½ mile
3,960
Businesses Nearby
Explore this area
Business Placement
Demographics for 33316, FL
12,669
Population
8,946
Households
1.4
Avg Household Size
50
Median Age
54%
College-Educated
95%
High-School Grad
4.1 sq mi
ZIP Area
3,090
Density / Sq Mi
$89,200
Median Household Income
$52,992
Median Earnings
$2,047
Median Rent
$793,500
Median Home Value
Check the figures for this property
Cap Rate, Value Estimation, Potential NOI and more
View Realmo Analytics

Questions? Ask Rey
Realmo’s AI knows this listing — price, zoning, demand, history. Ask anything.





Frequently Asked Questions
What type of property is this?
Mixed-use property - Mixed-use building with restaurant, retail, and residential potential.
Where is this mixed-use property located?
The property is located at 1083 SE 17th St Fort Lauderdale, FL.
What is the asking price?
The asking price for this property is $995,000.
What are key features of this property?
This property features: Prime location immediately off E. 17th St. Causeway in the heart of Ft Lauderdale.; Flexible potential for owner‑user or developer with restaurant/retail space on the 1st floor and residential on the 2nd.; Offered in shell condition, ready to be customized.


