Corner Office Condo with
For Sale
$225,000
28 John Marshall St Unit 10, Warrenton, VA 20186
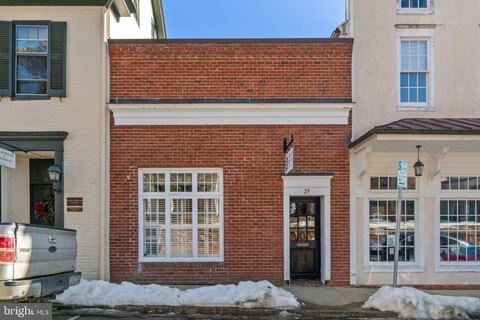
Corner office condominium with flexible layout, kitchenette, half bath, and direct parking-lot access.
Property Size900 SF
Price / SF$250
Days on Market47
Property Features for 28 John Marshall St Unit 10
General Information
Standard status
Active
Size
900 SF
Amenities
built-in bookshelves
kitchenette
half bath
security bars
building directory
signage
Building Details
Year Built
1985
Tenancy
Multi
Listing Agency:
Virginia Realty & Management, LLC.
Listed By:
Virginia L Wright
(540) 878-5041
Source:
Soldbypattie
Added: Sep 4
Changed: Oct 13
Last Checked: Oct 7 at 3:35PM
Displayed information is deemed reliable but is not guaranteed and should be independently verified. All listing content including descriptions, pricing, images are the copyrighted material of Virginia Realty & Management, LLC.

Ask AI about this property
Review the available facts, identify missing information and prepare questions for the agent.
Investment Insights
Based on property information with market context.
This 900-square-foot corner office condominium provides a practical configuration for professional use. The current layout includes a reception area, two larger offices, a kitchenette, half bath, and built-in shelving. A division wall can be removed to create one larger L-shaped workspace. Four windows bring natural light into the suite, with security bars on three of them.
The unit offers direct access from the parking lot and is positioned just off Waterloo Street in historic Warrenton. Main Street, Fauquier County offices, and additional retail and professional offices are nearby. Building signage is available at the office entrance, with directory placement visible from Waterloo Street. The property was built in 1985.
The unit offers direct access from the parking lot and is positioned just off Waterloo Street in historic Warrenton. Main Street, Fauquier County offices, and additional retail and professional offices are nearby. Building signage is available at the office entrance, with directory placement visible from Waterloo Street. The property was built in 1985.
Key Highlights
- 900‑square‑foot corner office condominium
- Flexible plan with reception area and two offices, or one larger L‑shaped workspace
- Four windows; three have security bars
Financial Insights
Estimated NOI and Cap Rate
NOI / Yr
$12,050
Cap Rate
5.36%
Suggested Prices Based on Cap Rates
Cap Rate 5%
$241,000
$241.0K
Cap Rate 7%
$172,143
$172.1K
Cap Rate 9%
$133,889
$133.9K
Market Conditions
NOI Build-Up for 900 SF
Gross rent
$18.8K $20.88/SF
− Vacancy
−$2.7K −$3.03/SF
EGI
$16.1K $17.85/SF
− OpEx
−$4.0K −$4.46/SF
NOI
$12.1K $13.39/SF
Area
Fauquier County, VA
Vacancy
14.50%
Lease Rate
$20.88 /SF/Yr
Expense Ratio
25.00%
Simulate Cap Rate and NOI
Suggested Prices Based on Cap Rates
Cap Rate 5%
$241,000
Cap Rate 7%
$172,143
Cap Rate 9%
$133,889
Alternative Uses
Best Use
Office B
$172.1K
$150.6K – $200.8K
NOI $12,050 @ 7.0% cap · market cap 5.36%
Second Best
—
—
no second resolved use
Theoretical Best
Specialty Retail
$499.9K
$437.4K – $583.2K
NOI $34,992 @ 7.0% cap · market cap 15.55%
Zoning and permitted uses should be independently verified with authorities.
How Realmo checks its estimates
Property Analytics
Current Use
Lease Details
Multi-tenant
Tenancy
Location Intelligence
Trade Area within ½ mile
1,447
Businesses Nearby
Explore this area
Business Placement
Demographics for 20186, VA
15,171
Population
6,114
Households
2.5
Avg Household Size
43
Median Age
44%
College-Educated
93%
High-School Grad
58.7 sq mi
ZIP Area
258
Density / Sq Mi
$100,813
Median Household Income
$50,533
Median Earnings
$1,541
Median Rent
$485,000
Median Home Value
Market
Vacancy Rate% for Office in South region


Frequently Asked Questions
What type of property is this?
Office unit - Corner office condominium with flexible layout, kitchenette, half bath, and direct parking-lot access.
Where is this office unit located?
The property is located at 28 John Marshall St Unit 10 Warrenton, VA.
What is the asking price?
The asking price for this property is $225,000.
What are key features of this property?
This property features: 900‑square‑foot corner office condominium; Flexible plan with reception area and two offices, or one larger L‑shaped workspace; Four windows; three have security bars


