Harlingen Office Building For
For Sale
$1,725,000
2420 E Tyler Ave., Harlingen, TX 78550
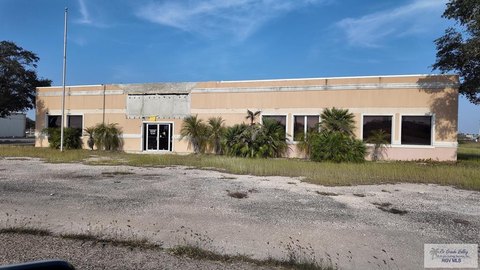
Exceptional office building in thriving Rio Grande Valley market.
Property Size11,707 SF
Price / SF$147.35
Days on Market149

Ask AI about this property
Review the available facts, identify missing information and prepare questions for the agent.
Property Features for 2420 E Tyler Ave.
General Information
Standard status
Active
Size
11,707 SF
Building Details
Year Built
2007
Listing Agency:
CHRE Cindy Hopkins Real Estate
Listed By:
Cynthia Hopkins · License #0508052
(956) 778-3255
Source:
Accessrealtyrgv
Added: May 20
Changed: Oct 10
Last Checked: Oct 7 at 4:43PM
Displayed information is deemed reliable but is not guaranteed and should be independently verified. All listing content including descriptions, pricing, images are the copyrighted material of CHRE Cindy Hopkins Real Estate
Investment Insights
Based on property information with market context.
This +/- 11,707 square foot office building, formerly used for administrative staff, features high ceilings and custom design elements. The property includes approximately 20 [10 x 10] cubicles and over 15 private window offices. The facility offers a reception area, a large conference room, a large employee break area, and a gym area. There is also a manager's office with a private restroom and an outdoor courtyard. Located in Harlingen, Texas, the property is situated in the Rio Grande Valley market. Nearby are the Valley International Airport and the Harlingen Medical Center. Texas State Technical College and The University of Texas Rio Grande Valley are also located in the area. The location offers a variety of dining, shopping, and entertainment options, creating an attractive environment for office and office building investors. This property is suitable for any corporate office.
Key Highlights
- Exceptional, beautifully landscaped office building with high ceilings and numerous custom design features.
- Includes +/- 20 cubicles and 15+ private/window offices, ready for immediate use.
- Features a beautiful reception area, large conference room, large employee break area, and gym area.
Financial Insights
Estimated NOI and Cap Rate
NOI / Yr
$107,470
Cap Rate
6.23%
Suggested Prices Based on Cap Rates
Cap Rate 5%
$2,149,400
$2.1M
Cap Rate 7%
$1,535,286
$1.5M
Cap Rate 9%
$1,194,111
$1.2M
Market Conditions
NOI Build-Up for 11,707 SF
Gross rent
$210.7K $18.00/SF
− Vacancy
−$67.4K −$5.76/SF
EGI
$143.3K $12.24/SF
− OpEx
−$35.8K −$3.06/SF
NOI
$107.5K $9.18/SF
Area
Cameron County, TX
Vacancy
32.00%
Lease Rate
$18.00 /SF/Yr
Expense Ratio
25.00%
Simulate Cap Rate and NOI
Suggested Prices Based on Cap Rates
Cap Rate 5%
$2,149,400
Cap Rate 7%
$1,535,286
Cap Rate 9%
$1,194,111
Alternative Uses
Best Use
Office B
$1.54M
$1.34M – $1.79M
NOI $107,470 @ 7.0% cap · market cap 6.23%
Second Best
—
—
no second resolved use
Theoretical Best
Healthcare Medical
$2.02M
$1.76M – $2.35M
NOI $141,102 @ 7.0% cap · market cap 8.18%
Zoning and permitted uses should be independently verified with authorities.
How Realmo checks its estimates
Property Analytics
Unlock full access to Insights
Subscribe to Realmo Intelligence
Open Analytics
Current Use
Location Intelligence
Trade Area within ½ mile
536
Businesses Nearby
Explore this area
Business Placement
Demographics for 78550, TX
56,038
Population
22,347
Households
2.5
Avg Household Size
35
Median Age
22%
College-Educated
77%
High-School Grad
94.2 sq mi
ZIP Area
595
Density / Sq Mi
$51,524
Median Household Income
$32,065
Median Earnings
$863
Median Rent
$120,500
Median Home Value
Check the figures for this property
Cap Rate, Value Estimation, Potential NOI and more
View Realmo Analytics
Market
Vacancy Rate% for Office in South region




Frequently Asked Questions
What type of property is this?
Office building - Exceptional office building in thriving Rio Grande Valley market.
Where is this office building located?
The property is located at 2420 E Tyler Ave. Harlingen, TX.
What is the asking price?
The asking price for this property is $1,725,000.
What are key features of this property?
This property features: Exceptional, beautifully landscaped office building with high ceilings and numerous custom design features.; Includes +/- 20 cubicles and 15+ private/window offices, ready for immediate use.; Features a beautiful reception area, large conference room, large employee break area, and gym area.


