Historic Mixed-Use Property with Rooftop
For Sale
Contact for pricing
24 Broadway, Kissimmee, FL 34741
Two-story buildings offer retail, office, restaurant, and residential-above-retail flexibility.
Property Size11,150 SF
Price / SF$313.90
Days on Market220
Property Features for 24 Broadway
General Information
Standard status
Active
Size
11,150 SF
Class
B
Property subtype
Mixed Use, Office, Retail
Zoning
T5-M
Occupancy
100%
Lease Type
Modified Gross
Investment Type
Value Add
Net Operating Income
$266,480
Additional Details
Patio
Yes
Amenities
rooftop deck
Building Details
Buildings
2
Stories
2
Units
18
Tenancy
Multi
Listing Agency:
The Property Pros Real Estate
Listed By:
Christie Gisondi · License #SL3172930
(321) 544-5466
Source:
Crexi
Added: Mar 10
Changed: Oct 7
Last Checked: Oct 12 at 8:48PM
Displayed information is deemed reliable but is not guaranteed and should be independently verified. All listing content including descriptions, pricing, images are the copyrighted material of The Property Pros Real Estate
Investment Insights
Based on property information with market context.
This mixed-use property comprises two two-story buildings constructed in 1910 and 1920, with 11,150 square feet of combined space. Improvements include flooring in select second-story office suites, remodeled bathrooms, two HVAC units, a newer roof, exterior paint, and a rooftop walking deck. The second building includes an apartment with a full kitchen and bathroom that is currently used as office space. Two active restaurants operate on site, including an end-cap location with a patio.
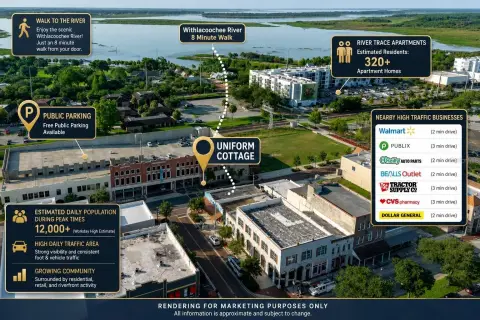
The property is located at 24 Broadway in downtown Kissimmee and is zoned T5-M. The zoning supports retail, restaurants, office use, residential above retail, and hospitality within the same building, while allowing vertical development. Parking is supported by reduced requirements, shared parking, and a public garage behind the property. CRA grant programs address facade improvements, restaurant buildouts, historic preservation, and rooftop activation for bars, patios, and events.
The property is located at 24 Broadway in downtown Kissimmee and is zoned T5-M. The zoning supports retail, restaurants, office use, residential above retail, and hospitality within the same building, while allowing vertical development. Parking is supported by reduced requirements, shared parking, and a public garage behind the property. CRA grant programs address facade improvements, restaurant buildouts, historic preservation, and rooftop activation for bars, patios, and events.
Key Highlights
- Two two‑story buildings totaling 11,150 square feet, constructed in 1910 and 1920
- T5‑M zoning supports retail, restaurants, office, residential above retail, and hospitality
- Two active restaurants on site, including an end‑cap space with patio
Financial Insights
Estimated NOI and Cap Rate
NOI / Yr
$241,342
Cap Rate
6.90%
Suggested Prices Based on Cap Rates
Cap Rate 5%
$4,826,840
$4.8M
Cap Rate 7%
$3,447,743
$3.4M
Cap Rate 9%
$2,681,578
$2.7M
Market Conditions
NOI Build-Up for 11,150 SF
Gross rent
$334.5K $30.00/SF
− Vacancy
−$12.7K −$1.14/SF
EGI
$321.8K $28.86/SF
− OpEx
−$80.4K −$7.22/SF
NOI
$241.3K $21.65/SF
Area
Osceola County, FL
Vacancy
3.80%
Lease Rate
$30.00 /SF/Yr
Expense Ratio
25.00%
Simulate Cap Rate and NOI
Suggested Prices Based on Cap Rates
Cap Rate 5%
$4,826,840
Cap Rate 7%
$3,447,743
Cap Rate 9%
$2,681,578
Alternative Uses
Best Use
Specialty Retail
$3.45M
$3.02M – $4.02M
NOI $241,342 @ 7.0% cap · market cap 6.90%
Second Best
Retail
$3.13M
$2.74M – $3.65M
NOI $218,951 @ 7.0% cap · market cap 6.26%
Theoretical Best
—
—
same as Best Use
Zoning and permitted uses should be independently verified with authorities.
How Realmo checks its estimates
Property Analytics
Unlock full access to Insights
Subscribe to Realmo Intelligence
Open Analytics
Current Use
Location Intelligence
Trade Area within ½ mile
3,407
Businesses Nearby
Explore this area
Business Placement
Demographics for 34741, FL
56,454
Population
22,043
Households
2.6
Avg Household Size
35
Median Age
28%
College-Educated
87%
High-School Grad
15.0 sq mi
ZIP Area
3,764
Density / Sq Mi
$50,278
Median Household Income
$30,415
Median Earnings
$1,591
Median Rent
$270,200
Median Home Value
Check the figures for this property
Cap Rate, Value Estimation, Potential NOI and more
View Realmo Analytics
Market
Vacancy Rate% for Office in South region

Questions? Ask Rey
Realmo’s AI knows this listing — price, zoning, demand, history. Ask anything.



Frequently Asked Questions
What type of property is this?
Mixed-use property - Two-story buildings offer retail, office, restaurant, and residential-above-retail flexibility.
Where is this mixed-use property located?
The property is located at 24 Broadway Kissimmee, FL.
What is the asking price?
The asking price for this property is $3,500,000.
What are key features of this property?
This property features: Two two‑story buildings totaling 11,150 square feet, constructed in 1910 and 1920; T5‑M zoning supports retail, restaurants, office, residential above retail, and hospitality; Two active restaurants on site, including an end‑cap space with patio


