Versatile Retail-Office
For Sale
$2,000,000
2311 Chattanooga Rd, Dalton, GA 30720
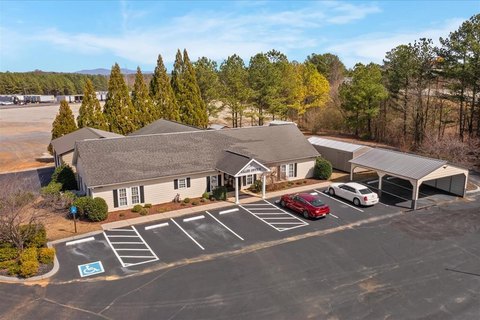
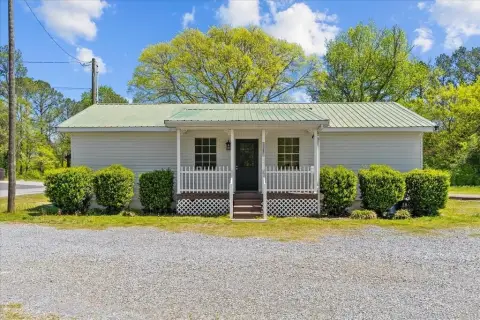
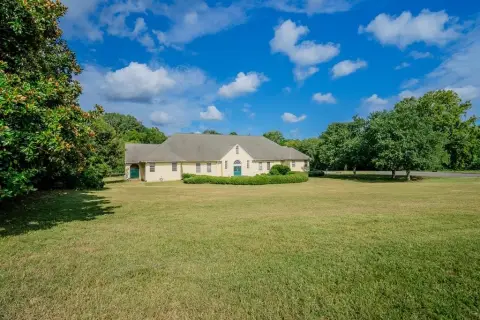
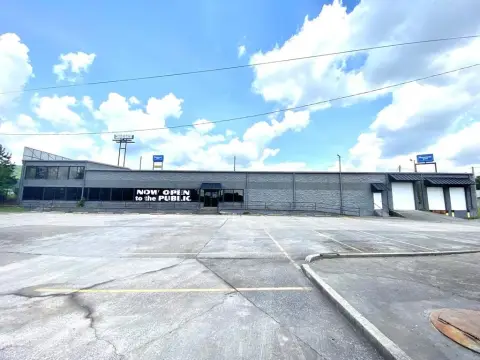
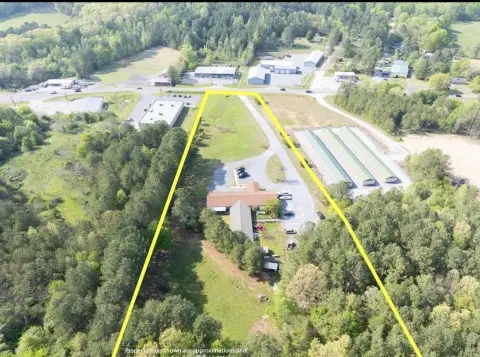
Flexible floor plan with ample on-site parking and strong street frontage for retail, office, and medical use in Dalton.
Property Size13,960 SF
Days on Market97
Property Features for 2311 Chattanooga Rd
General Information
Standard status
Active
Size
13,960 SF
Property subtype
Retail - Restaurant
Additional Details
Highway Access
Yes
Building Details
Building Size
13,960 SF
Year Built
1975
Year Renovated
2026
Listing Agency:
Coldwell Banker Kinard Realty
Listed By:
Shawn Matthews · License #314204
(423) 284-3233
Source:
Commercialcafe
Added: Jul 3
Changed: Sep 22
Last Checked: Oct 5 at 3:19PM
Displayed information is deemed reliable but is not guaranteed and should be independently verified. All listing content including descriptions, pricing, images are the copyrighted material of Coldwell Banker Kinard Realty
Investment Insights
Based on property information with market context.
This versatile commercial property at 2311 Chattanooga Rd in Dalton, GA is configured to support a range of uses, including retail, office, medical, and professional services. The layout is described as functional and flexible, allowing tenants to adapt the space to their operational needs. The property also offers ample on-site parking and street-facing presence intended to support day-to-day client and customer access.
The listing notes convenient access and excellent street frontage, positioning the property for visibility to passing traffic. It is presented as being well-suited for businesses serving both established commercial neighbors and nearby residential communities, with straightforward access for customers and clients.
For owner-users or operators, the combination of a flexible interior layout, parking on site, and storefront exposure can support a variety of commercial concepts. For investors, the property is presented as an investment opportunity with multiple viable use categories, including retail, office, and medical/professional services, depending on how the space is tailored for occupancy.
The listing notes convenient access and excellent street frontage, positioning the property for visibility to passing traffic. It is presented as being well-suited for businesses serving both established commercial neighbors and nearby residential communities, with straightforward access for customers and clients.
For owner-users or operators, the combination of a flexible interior layout, parking on site, and storefront exposure can support a variety of commercial concepts. For investors, the property is presented as an investment opportunity with multiple viable use categories, including retail, office, and medical/professional services, depending on how the space is tailored for occupancy.
Key Highlights
- Built in 1975 commercial property in Dalton with flexible floor plan for multiple business uses
- Strong street frontage and high‑visibility location designed to support customer and client exposure
- Ample on‑site parking for convenient customer access
Financial Insights
Estimated NOI and Cap Rate
NOI / Yr
$89,056
Cap Rate
4.45%
Suggested Prices Based on Cap Rates
Cap Rate 5%
$1,781,120
$1.8M
Cap Rate 7%
$1,272,229
$1.3M
Cap Rate 9%
$989,511
$989.5K
Market Conditions
NOI Build-Up for 13,960 SF
Gross rent
$139.0K $9.96/SF
− Vacancy
−$11.8K −$0.85/SF
EGI
$127.2K $9.11/SF
− OpEx
−$38.2K −$2.73/SF
NOI
$89.1K $6.38/SF
Area
Whitfield County, GA
Vacancy
8.50%
Lease Rate
$9.96 /SF/Yr
Expense Ratio
30.00%
Simulate Cap Rate and NOI
Suggested Prices Based on Cap Rates
Cap Rate 5%
$1,781,120
Cap Rate 7%
$1,272,229
Cap Rate 9%
$989,511
Alternative Uses
Best Use
Retail
$1.27M
$1.11M – $1.48M
NOI $89,056 @ 7.0% cap · market cap 4.45%
Second Best
—
—
no second resolved use
Theoretical Best
Office A
$2.23M
$1.95M – $2.60M
NOI $156,048 @ 7.0% cap · market cap 7.80%
Zoning and permitted uses should be independently verified with authorities.
Property Analytics
Unlock full access to Insights
Subscribe to Realmo Intelligence
Open Analytics
Current Use
Lease Details
Yes
Highway access
Location Intelligence
Trade Area within ½ mile
133
Businesses Nearby
Explore this area
Business Placement
Demographics for 30720, GA
27,547
Population
10,731
Households
2.6
Avg Household Size
37
Median Age
29%
College-Educated
77%
High-School Grad
48.6 sq mi
ZIP Area
567
Density / Sq Mi
$65,620
Median Household Income
$38,014
Median Earnings
$965
Median Rent
$225,600
Median Home Value
Check the figures for this property
Cap Rate, Value Estimation, Potential NOI and more
View Realmo Analytics
Market
Vacancy Rate% for Retail in South region

Questions? Ask Rey
Realmo’s AI knows this listing — price, zoning, demand, history. Ask anything.






Frequently Asked Questions
What type of property is this?
Retail space - Flexible floor plan with ample on-site parking and strong street frontage for retail, office, and medical use in Dalton.
Where is this retail space located?
The property is located at 2311 Chattanooga Rd Dalton, GA.
What is the asking price?
The asking price for this property is $2,000,000.
What are key features of this property?
This property features: Built in 1975 commercial property in Dalton with flexible floor plan for multiple business uses; Strong street frontage and high‑visibility location designed to support customer and client exposure; Ample on‑site parking for convenient customer access



