Downtown Grass Valley Office
For Sale
Contact for pricing
231 E Main St., Grass Valley, CA 95945
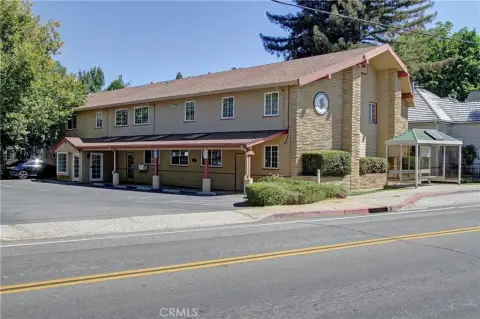
Centrally located office building with income potential in downtown Grass Valley.
Property Size2,264 SF
Price / SF$225.27
Days on Market351
Property Features for 231 E Main St.
General Information
Standard status
Active
Size
2,264 SF
Property subtype
Special Purpose
Zoning
TC
Building Details
Year Built
1979
Listing Agency:
Coldwell Banker Commercial Grass Roots Realty
Listed By:
Ayrton Swasey · License #02172989
(530) 277-0116
Source:
Crexi
Added: Oct 21, 2025
Changed: Aug 8
Last Checked: Aug 24 at 2:58AM
Displayed information is deemed reliable but is not guaranteed and should be independently verified. All listing content including descriptions, pricing, images are the copyrighted material of Coldwell Banker Commercial Grass Roots Realty
Investment Insights
Based on property information with market context.
Located in downtown Grass Valley, this office building offers potential for businesses seeking a central location. The building features 3 units: a large space downstairs and two upstairs. The first floor includes 4 private offices, a conference room, and a bathroom. Upstairs, there are 2 spacious rooms that can serve as additional offices or workspaces, along with another bathroom. Both floors contain a kitchenette. The building shows signs of age but is fully functional. It is within walking distance of shopping, restaurants, and entertainment. Positioned between E Main St and Hwy 49, it is suitable for advertising due to traffic. A small parking lot provides parking space. The bottom unit and one of the two spaces above are occupied, generating a combined monthly income of $1700 at the current rate. With full occupancy, a projected income of over $2,700 could be possible. The property size is 2264 square feet.
Key Highlights
- Prime Downtown Grass Valley location with high visibility.
- Three rentable units offering current income of $1700/month with potential to increase to $2700/month.
- Functional office layout with 4 private offices, conference room, and bathrooms.
Financial Insights
Estimated NOI and Cap Rate
NOI / Yr
$27,508
Cap Rate
5.39%
Suggested Prices Based on Cap Rates
Cap Rate 5%
$550,160
$550.2K
Cap Rate 7%
$392,971
$393.0K
Cap Rate 9%
$305,644
$305.6K
Market Conditions
NOI Build-Up for 2,264 SF
Gross rent
$48.9K $21.60/SF
− Vacancy
−$12.2K −$5.40/SF
EGI
$36.7K $16.20/SF
− OpEx
−$9.2K −$4.05/SF
NOI
$27.5K $12.15/SF
Area
Nevada County, CA
Vacancy
25.00%
Lease Rate
$21.60 /SF/Yr
Expense Ratio
25.00%
Simulate Cap Rate and NOI
Suggested Prices Based on Cap Rates
Cap Rate 5%
$550,160
Cap Rate 7%
$392,971
Cap Rate 9%
$305,644
Alternative Uses
Best Use
Office B
$393.0K
$343.9K – $458.5K
NOI $27,508 @ 7.0% cap · market cap 5.39%
Second Best
—
—
no second resolved use
Theoretical Best
Specialty Retail
$809.4K
$708.3K – $944.3K
NOI $56,660 @ 7.0% cap · market cap 11.11%
Zoning and permitted uses should be independently verified with authorities.
Property Analytics
Unlock full access to Insights
Subscribe to Realmo Intelligence
Open Analytics
Current Use
Location Intelligence
Trade Area within ½ mile
1,694
Businesses Nearby
Explore this area
Business Placement
Demographics for 95945, CA
26,302
Population
13,051
Households
2
Avg Household Size
50
Median Age
32%
College-Educated
94%
High-School Grad
61.1 sq mi
ZIP Area
430
Density / Sq Mi
$61,068
Median Household Income
$41,072
Median Earnings
$1,420
Median Rent
$496,600
Median Home Value
Check the figures for this property
Cap Rate, Value Estimation, Potential NOI and more
View Realmo Analytics
Market
Vacancy Rate% for Office in West region

Questions? Ask Rey
Realmo’s AI knows this listing — price, zoning, demand, history. Ask anything.




Frequently Asked Questions
What type of property is this?
Office building - Centrally located office building with income potential in downtown Grass Valley.
Where is this office building located?
The property is located at 231 E Main St. Grass Valley, CA.
What is the asking price?
The asking price for this property is $510,000.
What are key features of this property?
This property features: Prime Downtown Grass Valley location with high visibility.; Three rentable units offering current income of $1700/month with potential to increase to $2700/month.; Functional office layout with 4 private offices, conference room, and bathrooms.



