Two-Story Restaurant
For Sale
Contact for pricing
450 COLFAX AVE, Grass Valley, CA 95945
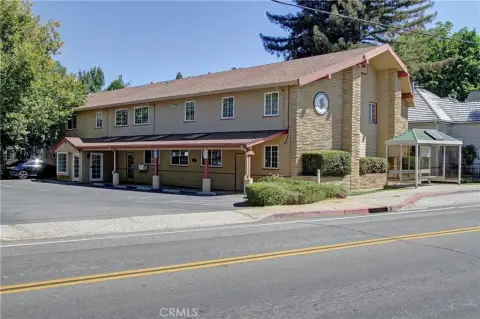
Two-story commercial building with roll-up loading access, terrace overlooking Memorial Park, and substantial food-service infrastructure.
Property Size4,308 SF
Lot Size0.27 Acres
Price / SF$178.51
Days on Market102
Property Features for 450 COLFAX AVE
General Information
Standard status
Active
Size
4,308 SF
Total Parking Spaces
22
Lot size
0.27 Acres
Property subtype
Retail, Office
Zoning
NEC
Warehouse & Industrial
Drive-In Doors
1
Heavy Power
Yes
Additional Details
Commercial Hood
Yes
Amenities
granite-topped service bar
wraparound terrace
vaulted ceilings
wide-plank pine floors
stained concrete floors
exposed timber
roll-up door
dedicated storage
three restrooms
Kohler standby generator
Building Details
Year Built
1933
Year Renovated
2008
Buildings
1
Stories
2
Units
1
Tenancy
Single
Construction
stone-and-timber
Listing Agency:
Tucker Commercial
Listed By:
Tyson Tucker · License #01804034
(530) 272-7222
Source:
Crexi
Added: Jul 14
Changed: Oct 11
Last Checked: Oct 20 at 6:46PM
Displayed information is deemed reliable but is not guaranteed and should be independently verified. All listing content including descriptions, pricing, images are the copyrighted material of Tucker Commercial

Ask AI about this property
Review the available facts, identify missing information and prepare questions for the agent.
Investment Insights
Based on property information with market context.
450 Colfax Avenue is a ±4,308 SF two-story commercial building on a ±0.27-acre corner lot at Colfax Avenue and Stennett Street, directly across from Grass Valley's Memorial Park. Originally built in 1933 and rebuilt top to bottom in 2008–2009, the property features updated roof, HVAC, gutters, and sewer systems. The heavy infrastructure for food service remains in place, including an oversized gas service, substantial electrical capacity, floor drains, dedicated kitchen ventilation, and a Kohler standby generator.
The second floor offers an open hall with vaulted ceilings, wide-plank pine floors, and a granite-topped service bar. It connects to an oversized wraparound terrace through a wall of glass doors, providing direct park views. The ground floor includes a second large open room with stained concrete floors and exposed timber, supported by a roll-up door for loading and deliveries and dedicated storage.
Three restrooms serve the two levels, and the concrete-paved 22-space on-site lot provides parking. NEC zoning permits a broad range of uses, including restaurant, office, retail, or residential conversion up to four units.
The second floor offers an open hall with vaulted ceilings, wide-plank pine floors, and a granite-topped service bar. It connects to an oversized wraparound terrace through a wall of glass doors, providing direct park views. The ground floor includes a second large open room with stained concrete floors and exposed timber, supported by a roll-up door for loading and deliveries and dedicated storage.
Three restrooms serve the two levels, and the concrete-paved 22-space on-site lot provides parking. NEC zoning permits a broad range of uses, including restaurant, office, retail, or residential conversion up to four units.
Key Highlights
- ±4,308 SF two‑story commercial building on a ±0.27‑acre corner lot at Colfax Ave and Stennett St, across from Memorial Park
- Rebuilt top to bottom in 2008–2009 with roof, HVAC, gutters, and sewer replaced
- Food‑service infrastructure includes oversized gas service, substantial electrical capacity, floor drains, and dedicated kitchen ventilation
Financial Insights
Estimated NOI and Cap Rate
NOI / Yr
$52,342
Cap Rate
6.81%
Suggested Prices Based on Cap Rates
Cap Rate 5%
$1,046,840
$1.0M
Cap Rate 7%
$747,743
$747.7K
Cap Rate 9%
$581,578
$581.6K
Market Conditions
NOI Build-Up for 4,308 SF
Gross rent
$93.1K $21.60/SF
− Vacancy
−$23.3K −$5.40/SF
EGI
$69.8K $16.20/SF
− OpEx
−$17.4K −$4.05/SF
NOI
$52.3K $12.15/SF
Area
Nevada County, CA
Vacancy
25.00%
Lease Rate
$21.60 /SF/Yr
Expense Ratio
25.00%
Simulate Cap Rate and NOI
Suggested Prices Based on Cap Rates
Cap Rate 5%
$1,046,840
Cap Rate 7%
$747,743
Cap Rate 9%
$581,578
Alternative Uses
Best Use
Specialty Retail
$1.54M
$1.35M – $1.80M
NOI $107,813 @ 7.0% cap · market cap 14.02%
Second Best
Office B
$747.7K
$654.3K – $872.4K
NOI $52,342 @ 7.0% cap · market cap 6.81%
Theoretical Best
—
—
same as Best Use
Zoning and permitted uses should be independently verified with authorities.
How Realmo checks its estimates
Property Analytics
Unlock full access to Insights
Subscribe to Realmo Intelligence
Open Analytics
Current Use
Lease Details
1
Drive-in doors
Yes
Heavy power
Yes
Commercial hood
Location Intelligence
Trade Area within ½ mile
1,331
Businesses Nearby
Under-served
Demand for This Use
Explore this area
Business Placement
Demographics for 95945, CA
26,302
Population
13,051
Households
2
Avg Household Size
50
Median Age
32%
College-Educated
94%
High-School Grad
61.1 sq mi
ZIP Area
430
Density / Sq Mi
$61,068
Median Household Income
$41,072
Median Earnings
$1,420
Median Rent
$496,600
Median Home Value
Check the figures for this property
Cap Rate, Value Estimation, Potential NOI and more
View Realmo Analytics
Market
Vacancy Rate% for Office in West region




Frequently Asked Questions
What type of property is this?
Conventional restaurant - Two-story commercial building with roll-up loading access, terrace overlooking Memorial Park, and substantial food-service infrastructure.
Where is this conventional restaurant located?
The property is located at 450 COLFAX AVE Grass Valley, CA.
What is the asking price?
The asking price for this property is $769,000.
What are key features of this property?
This property features: ±4,308 SF two‑story commercial building on a ±0.27‑acre corner lot at Colfax Ave and Stennett St, across from Memorial Park; Rebuilt top to bottom in 2008–2009 with roof, HVAC, gutters, and sewer replaced; Food‑service infrastructure includes oversized gas service, substantial electrical capacity, floor drains, and dedicated kitchen ventilation


