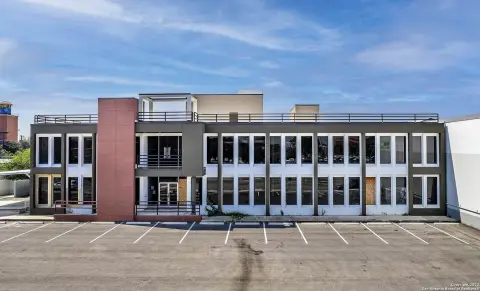
Renovated Office
For Sale
$1,200,000
2014 S Hackberry St, San Antonio, TX
Fully renovated office building with an open floor plan, multiple conference rooms, and 18 surface parking spaces.
Property Size6,300 SF
Price / SF$190.48
Days on Market129
Property Features for 2014 S Hackberry St
General Information
Standard status
Active
Size
6,300 SF
Total Parking Spaces
18
Zoning
I-1
Taxes and HOA fees
Annual Taxes
$17,449
Building Details
Year Built
1938
Listing Agency:
Phyllis Browning Company
(210) 824-7878
Listed By:
Lisa Grove · License #444720
(210) 857-7085
Source:
Exprealty
Added: Jun 17
Changed: Oct 3
Last Checked: Oct 21 at 1:47AM
Displayed information is deemed reliable but is not guaranteed and should be independently verified. All listing content including descriptions, pricing, images are the copyrighted material of Phyllis Browning Company

Ask AI about this property
Review the available facts, identify missing information and prepare questions for the agent.
Investment Insights
Based on property information with market context.
2014 S Hackberry Street is a fully renovated, move-in-ready office building originally built in 1938. The property has been updated with new electrical, plumbing, HVAC, and a new roof, and offers a bright, open floor plan with a dedicated IT room, several conference rooms, and private workspaces.
The building is located just south of downtown San Antonio and provides 18 surface parking spaces. Flexible I-1 zoning is listed, along with proximity to southward CBD expansion tied to the new baseball stadium and nearby Marvel and Lone Star redevelopments.
The offering totals 6,300 square feet of modern, flexible office space and is configured to support both team collaboration and focused work areas.
The building is located just south of downtown San Antonio and provides 18 surface parking spaces. Flexible I-1 zoning is listed, along with proximity to southward CBD expansion tied to the new baseball stadium and nearby Marvel and Lone Star redevelopments.
The offering totals 6,300 square feet of modern, flexible office space and is configured to support both team collaboration and focused work areas.
Key Highlights
- Fully renovated, move‑in‑ready office building with 6,300 SF of modern, flexible space
- Bright open floor plan plus dedicated IT room, several conference rooms, and private work spaces
- Updates include new electrical, plumbing, HVAC, and roof
Financial Insights
Estimated NOI and Cap Rate
NOI / Yr
$85,862
Cap Rate
7.16%
Suggested Prices Based on Cap Rates
Cap Rate 5%
$1,717,240
$1.7M
Cap Rate 7%
$1,226,600
$1.2M
Cap Rate 9%
$954,022
$954.0K
Market Conditions
NOI Build-Up for 6,300 SF
Gross rent
$139.1K $22.08/SF
− Vacancy
−$24.6K −$3.91/SF
EGI
$114.5K $18.17/SF
− OpEx
−$28.6K −$4.54/SF
NOI
$85.9K $13.63/SF
Area
San Antonio, TX
Vacancy
17.70%
Lease Rate
$22.08 /SF/Yr
Expense Ratio
25.00%
Simulate Cap Rate and NOI
Suggested Prices Based on Cap Rates
Cap Rate 5%
$1,717,240
Cap Rate 7%
$1,226,600
Cap Rate 9%
$954,022
Alternative Uses
Best Use
Office B
$1.23M
$1.07M – $1.43M
NOI $85,862 @ 7.0% cap · market cap 7.16%
Second Best
—
—
no second resolved use
Theoretical Best
Office A
$1.61M
$1.41M – $1.87M
NOI $112,492 @ 7.0% cap · market cap 9.37%
Zoning and permitted uses should be independently verified with authorities.
How Realmo checks its estimates
Property Analytics
Who owns this building?
See the owner, sales and loan history
Open Analytics
Current Use
Location Intelligence
Trade Area within ½ mile
1,142
Businesses Nearby
Explore this area
Business Placement
Check the figures for this property
Cap Rate, Value Estimation, Potential NOI and more
View Realmo Analytics
Market
Vacancy Rate% for Office in San Antonio, TX




Frequently Asked Questions
What type of property is this?
Office building - Fully renovated office building with an open floor plan, multiple conference rooms, and 18 surface parking spaces.
Where is this office building located?
The property is located at 2014 S Hackberry St San Antonio, TX.
What is the asking price?
The asking price for this property is $1,200,000.
What are key features of this property?
This property features: Fully renovated, move‑in‑ready office building with 6,300 SF of modern, flexible space; Bright open floor plan plus dedicated IT room, several conference rooms, and private work spaces; Updates include new electrical, plumbing, HVAC, and roof


