Storefront Property with Landscaped

















For Sale
$1,150,000
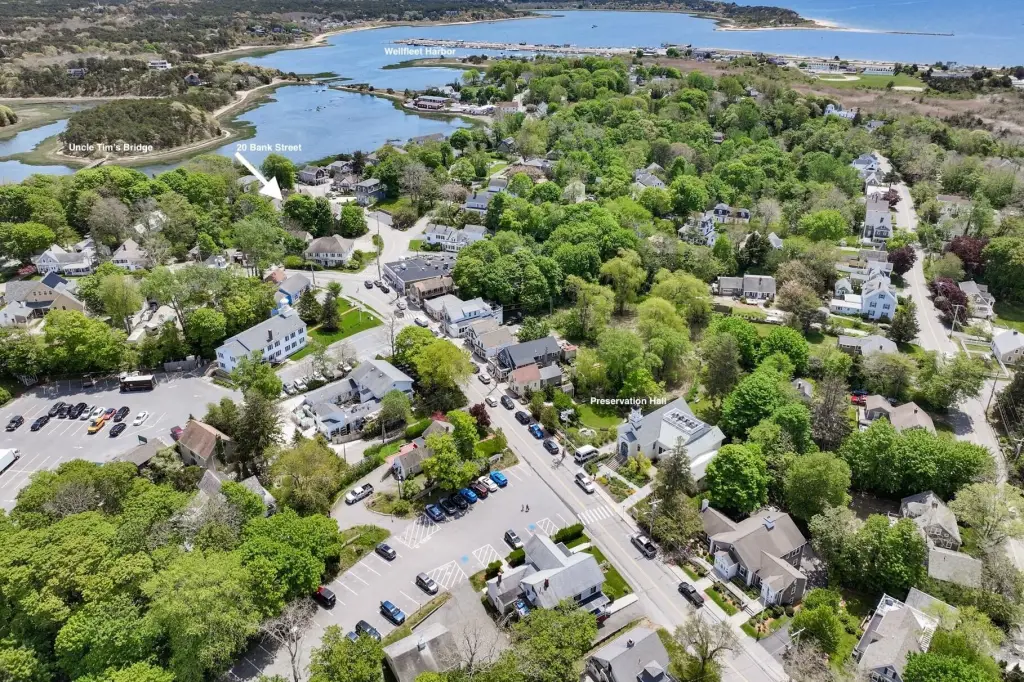
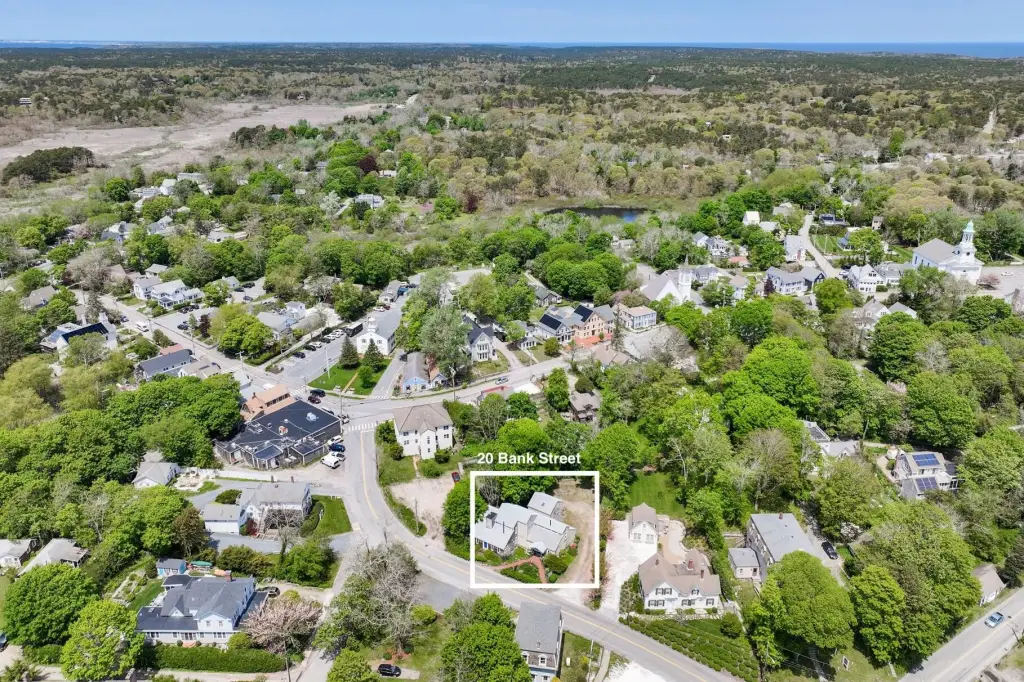
20 Bank Street, Wellfleet, MA 02667
Commercial Sale, Wellfleet, MA
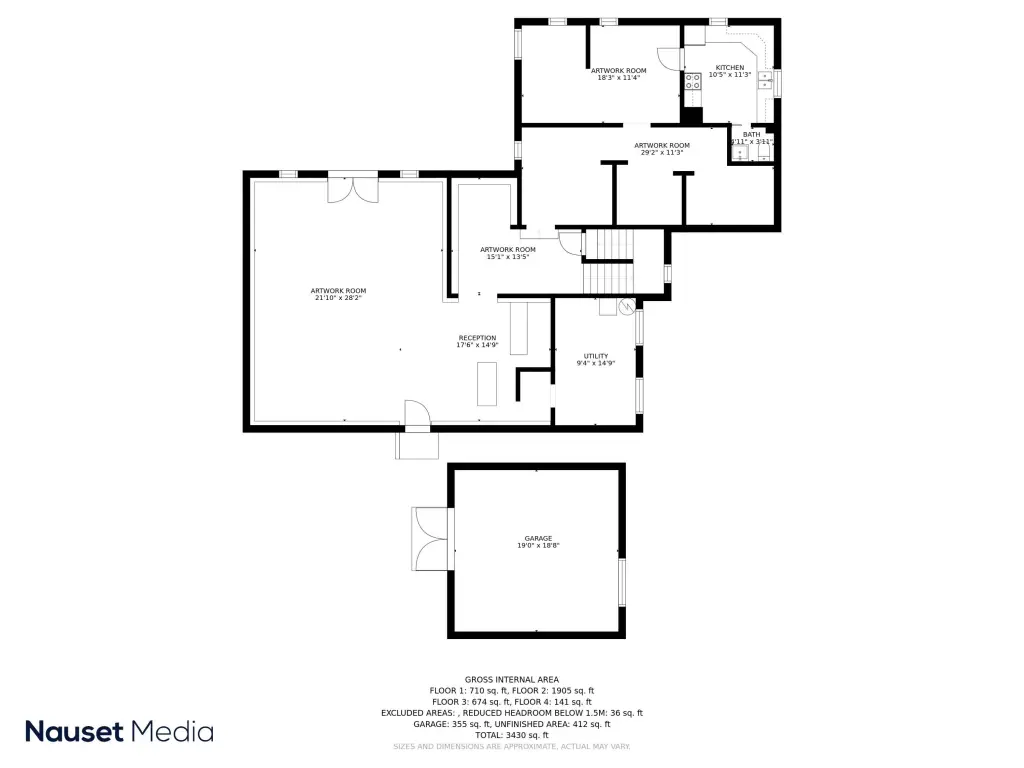
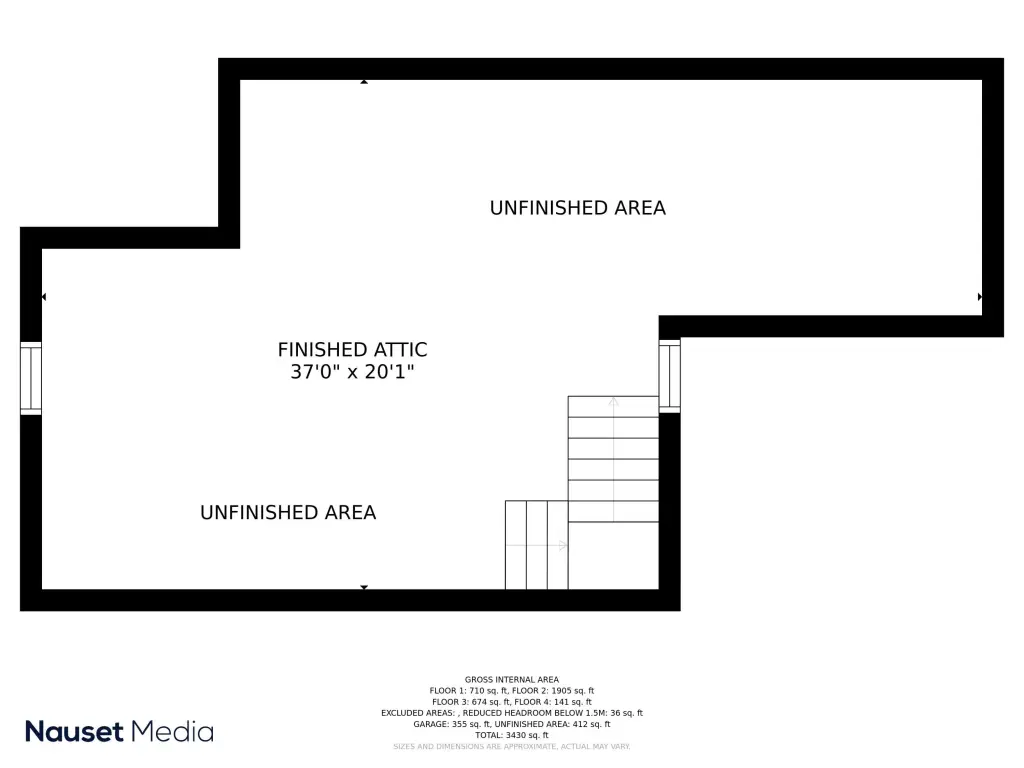
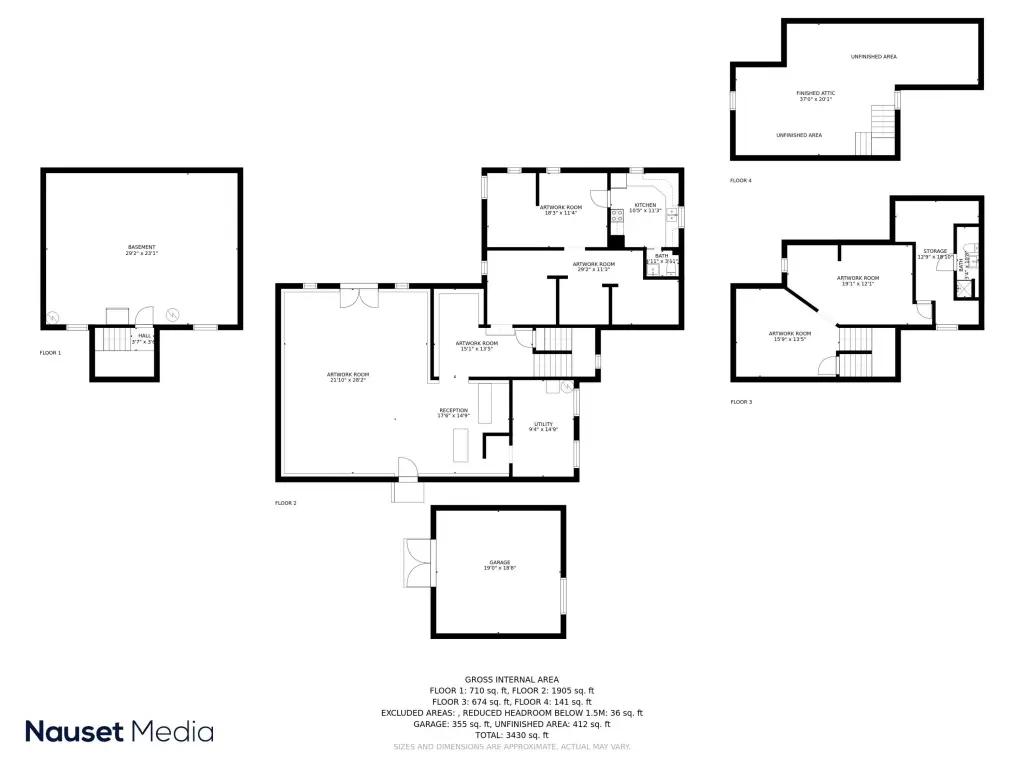
Property Size3,119 SF
Lot Size0.26 Acres
Price / SF$368.71
Days on Market502
Property Features for 20 Bank Street
General Information
Property type
Commercial Sale
Property subtype
Other
Zoning description
CD
Parking
10
Parking features
Off Street
Interior features
High Speed Internet
Fencing
Fenced
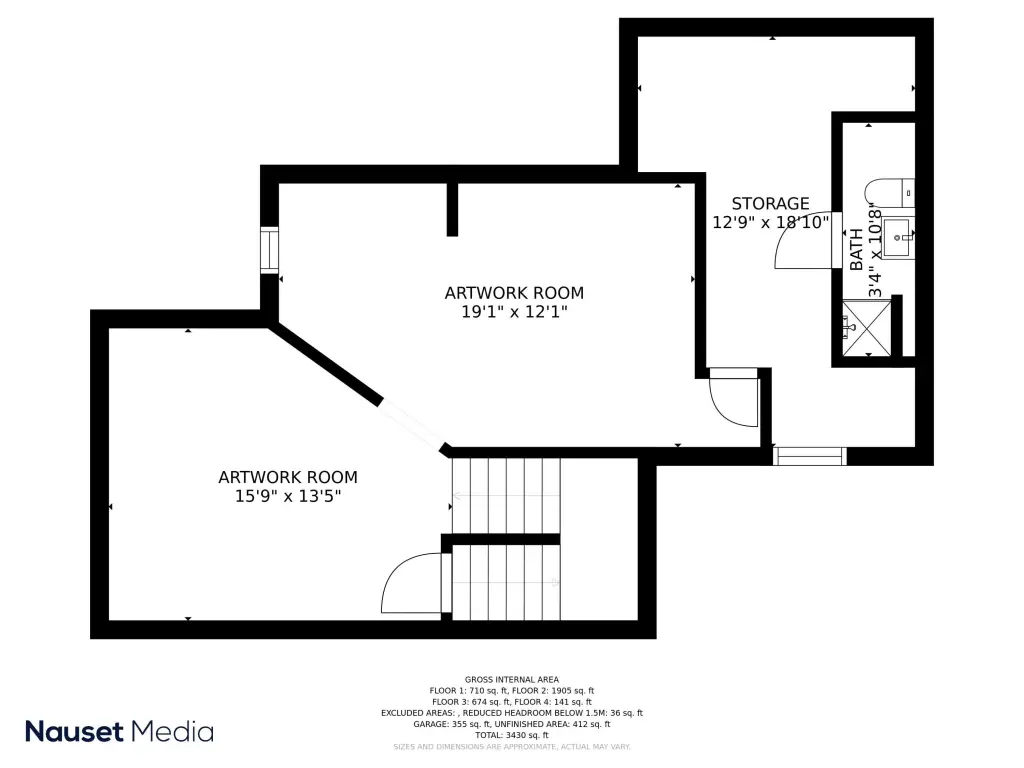
Basement
Partial
Appliances
Water Heater
Lot features
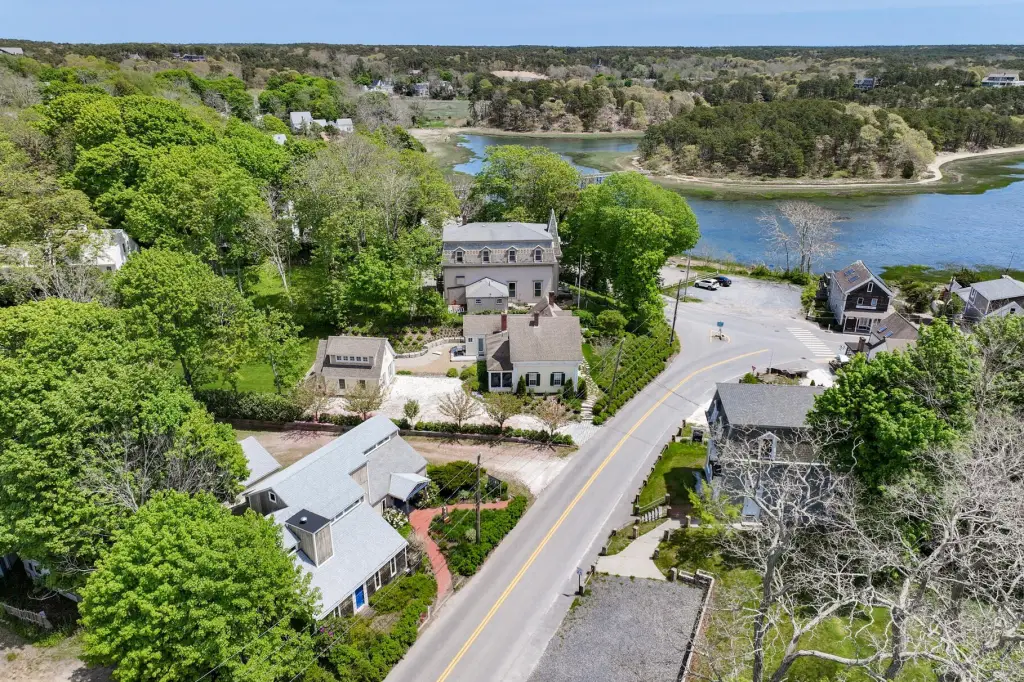
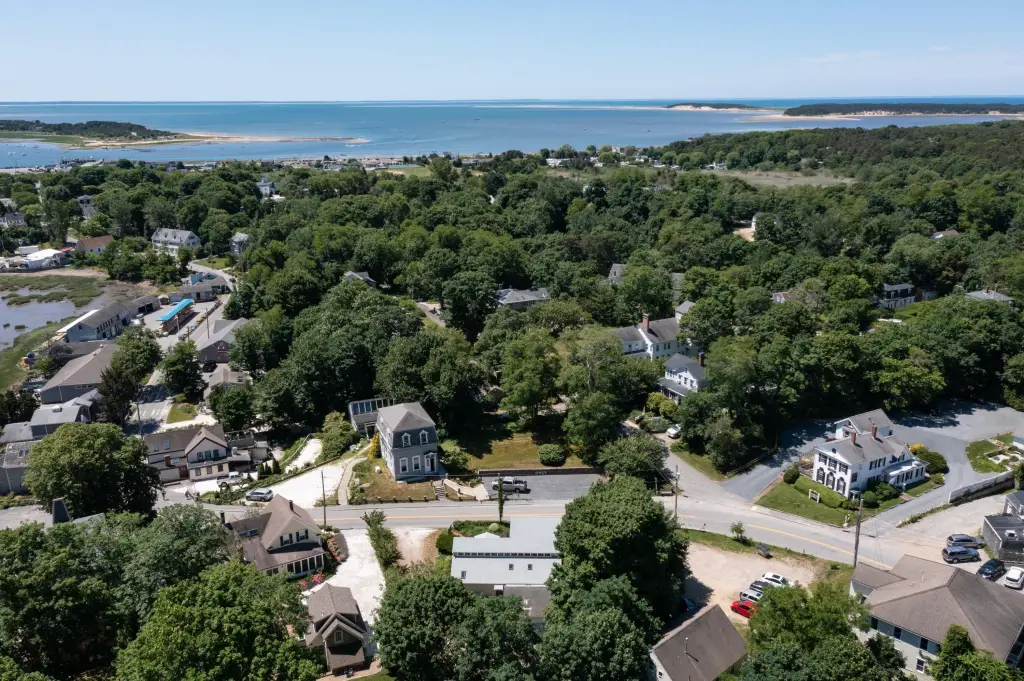
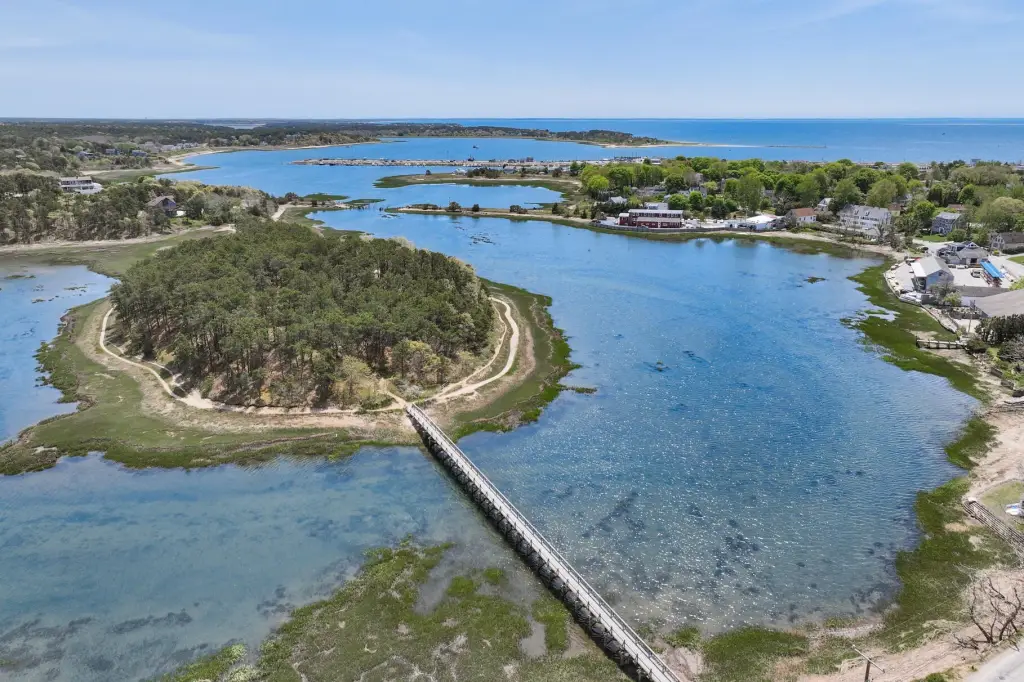
Views, Cleared
View
River
Elementary school district
Nauset
Middle school district
Nauset
High school district
Nauset
Directions
Main or Commercial to Bank Street- parking in the back.
Subdivision
Wellfleet
Standard status
Active
APN
15-85-0
Size
3,119 SF
Lot size
0.26 Acres
Taxes and HOA fees
Tax Year
2025
Tax Annual Amount
4573
Utilities
Sewer type
Septic Tank
Heating system
Oil
Cooling system
Central Air
Water source
Well
Amenities
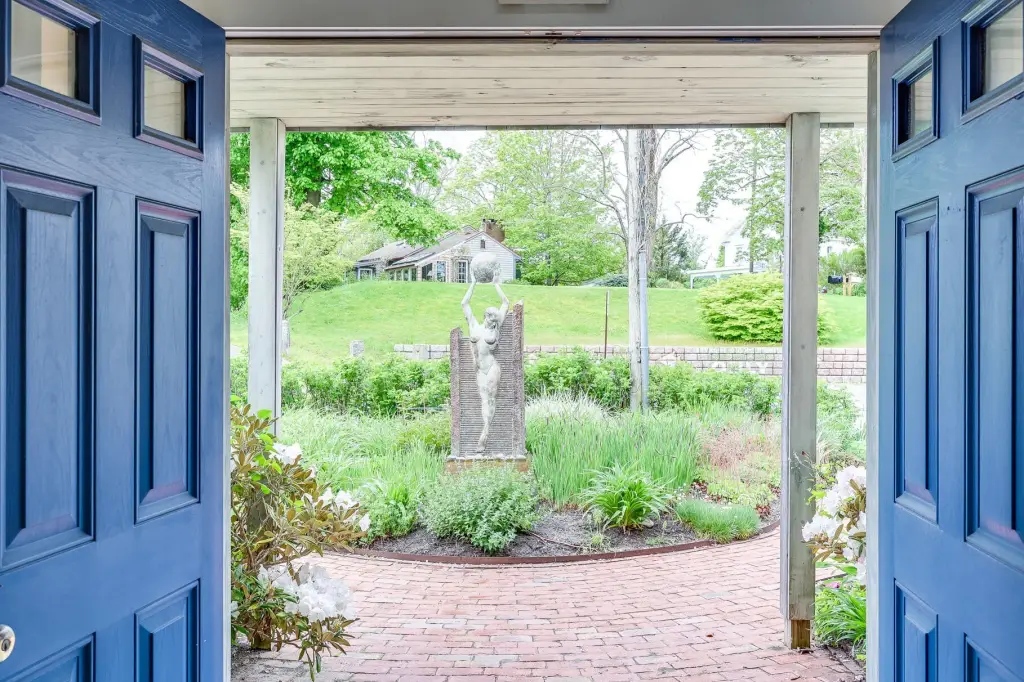
landscaped gardens
Building Details
Year built
1945
Floors in Building
2
Flooring type
Carpet, Vinyl
Building materials
Wood Frame, Barnboard
Roof type
Asphalt
Listing Agency:
Gibson Sotheby's International Realty
(508) 896-5000
Listed By:
Dawn Lee
(508) 237-5399
Added: May 22, 2025
Changed: Sep 12
Last Checked: Oct 5 at 2:06PM
MLS# 22502493
Copyright © 2026 Cape Cod & Islands Association of REALTORS®, Inc. All rights reserved. All information provided by the listing agent/broker is deemed reliable but is not guaranteed and should be independently verified.
Investment Insights
Based on property information with market context.
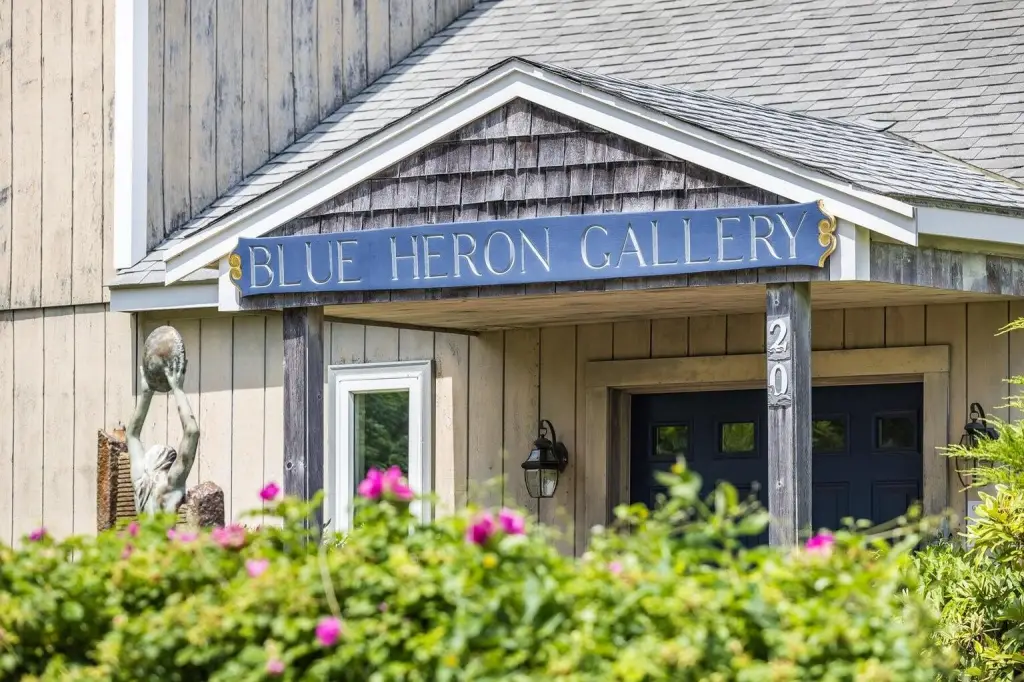
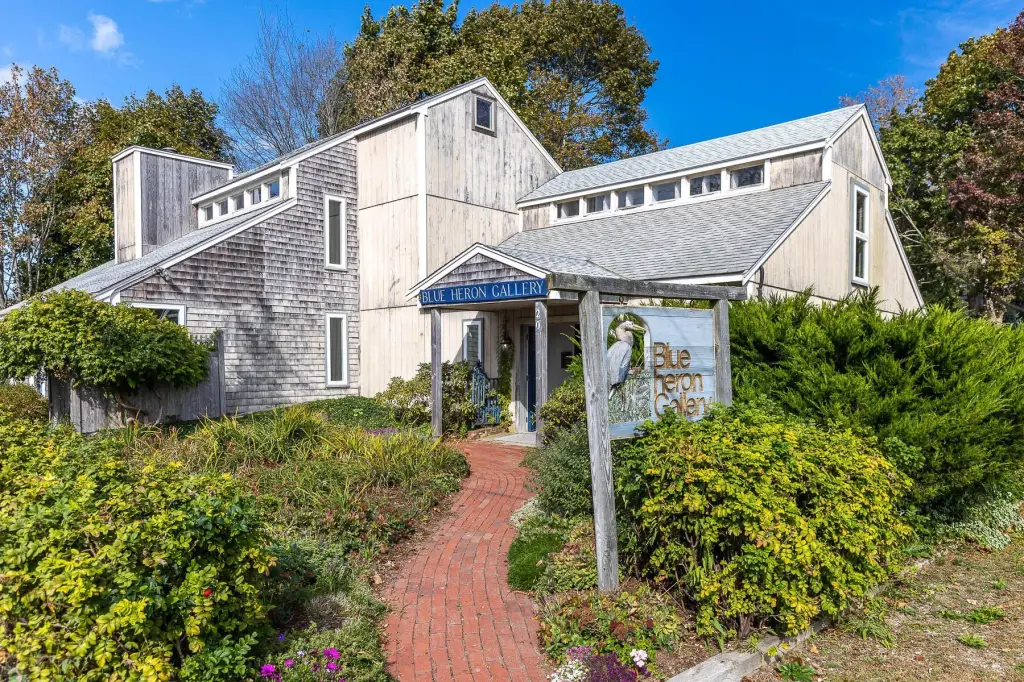
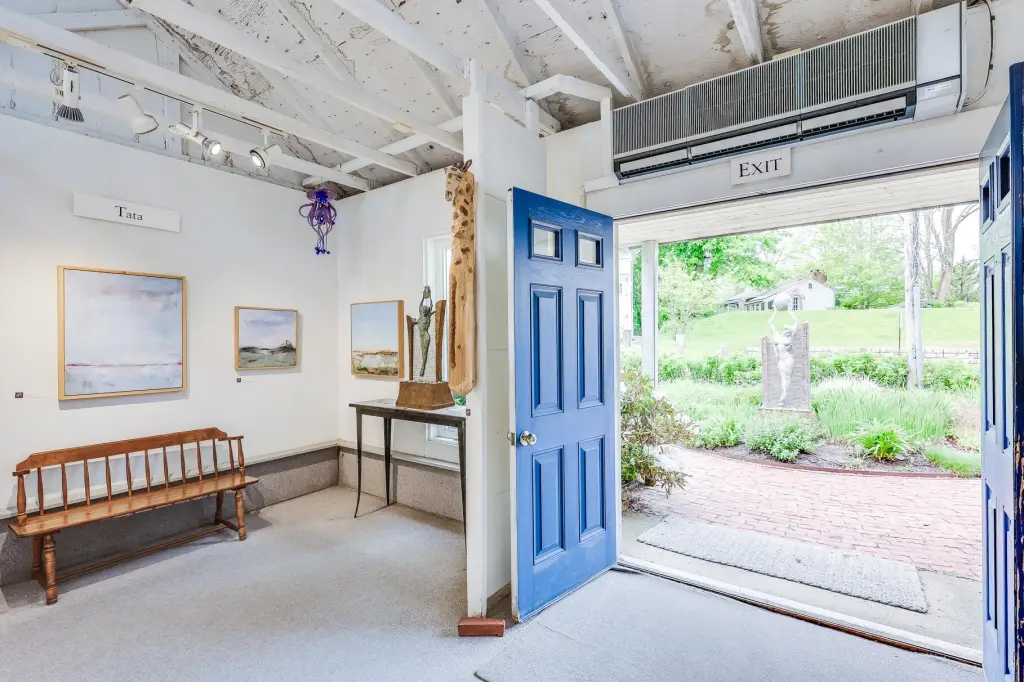
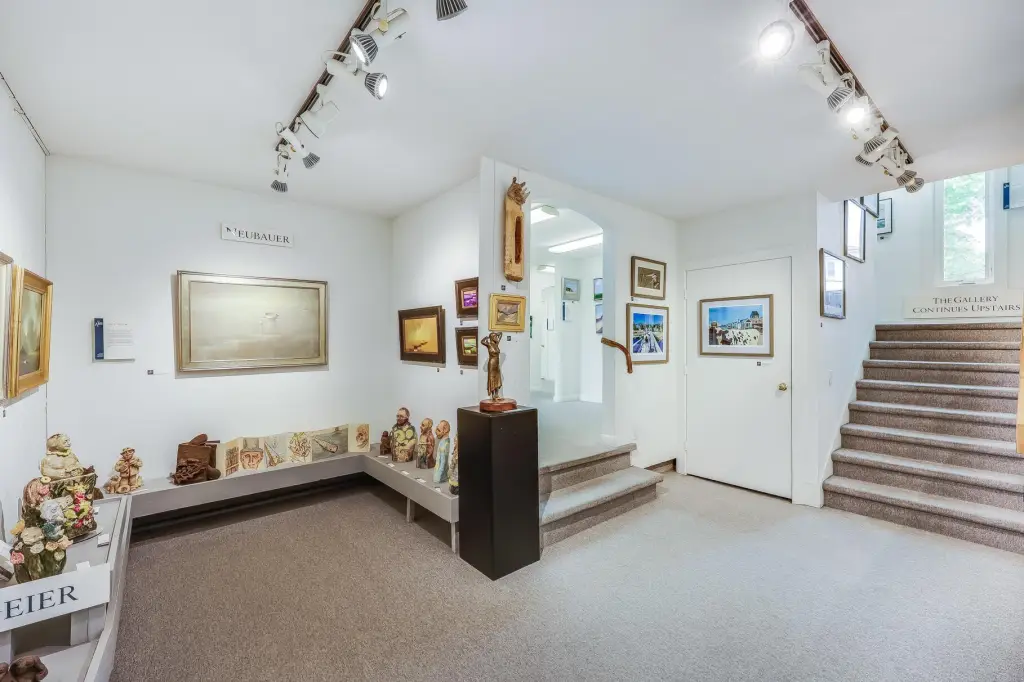
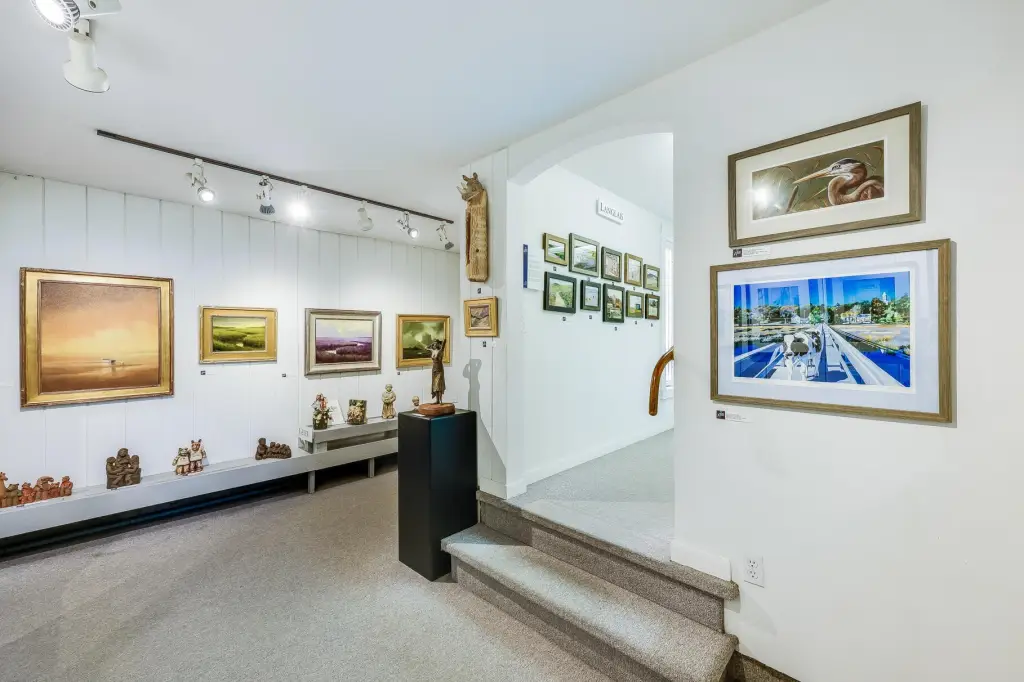
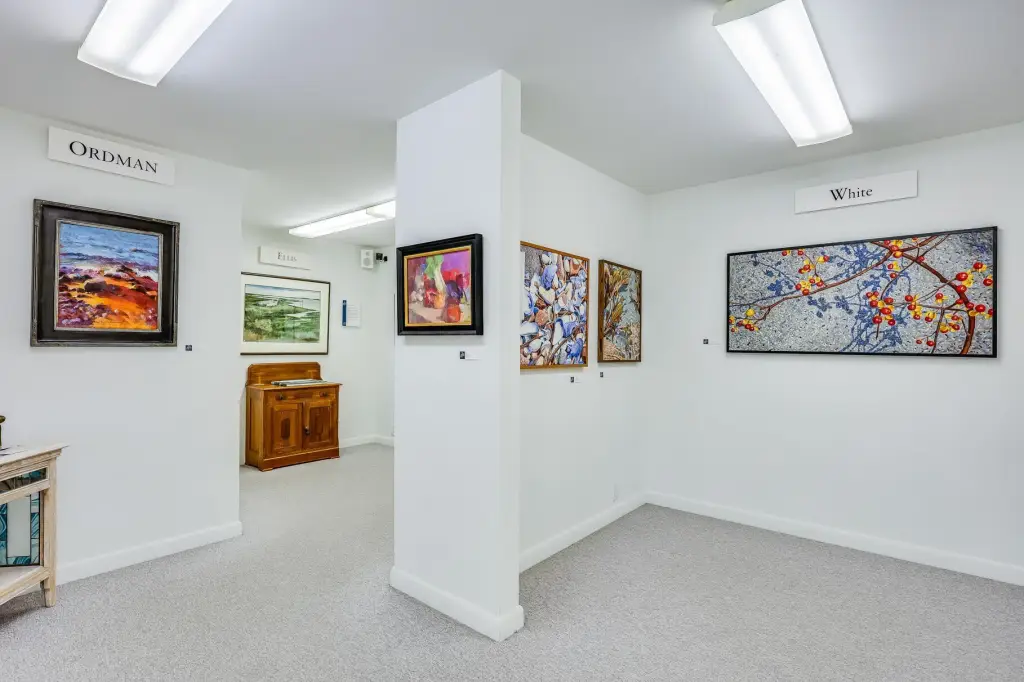
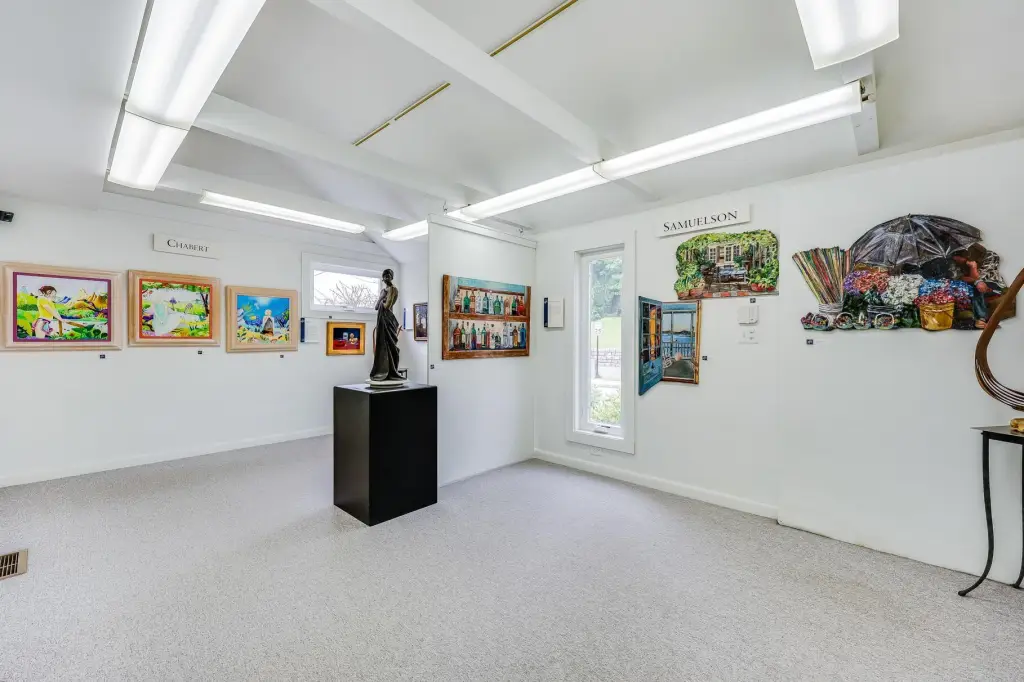
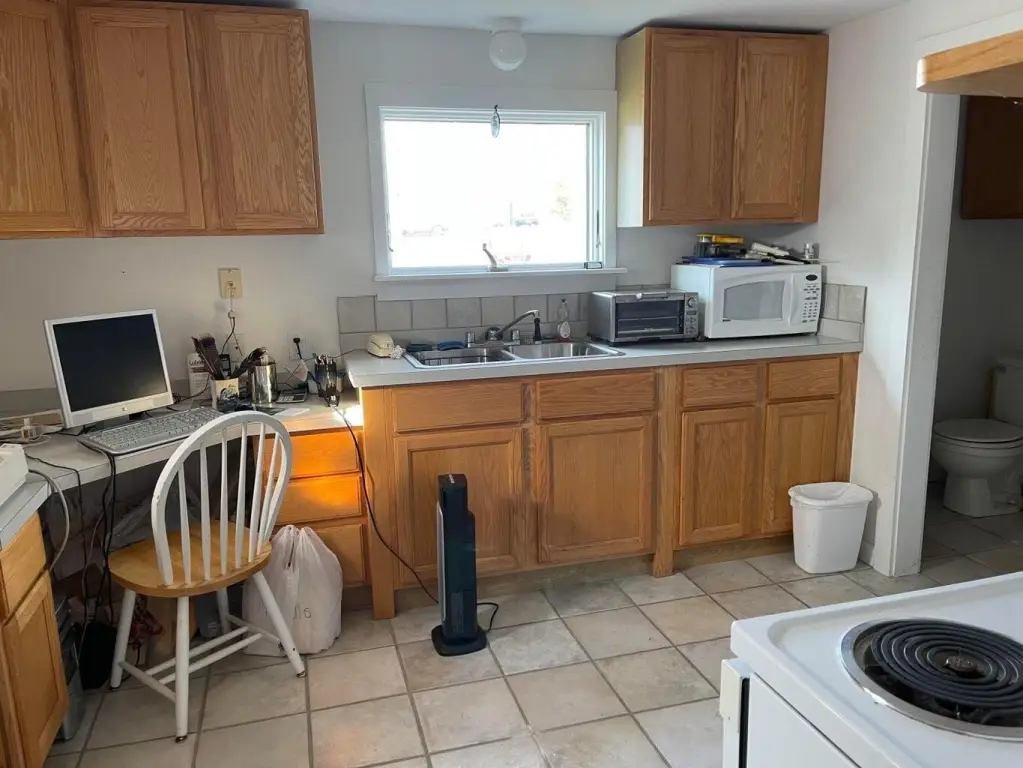
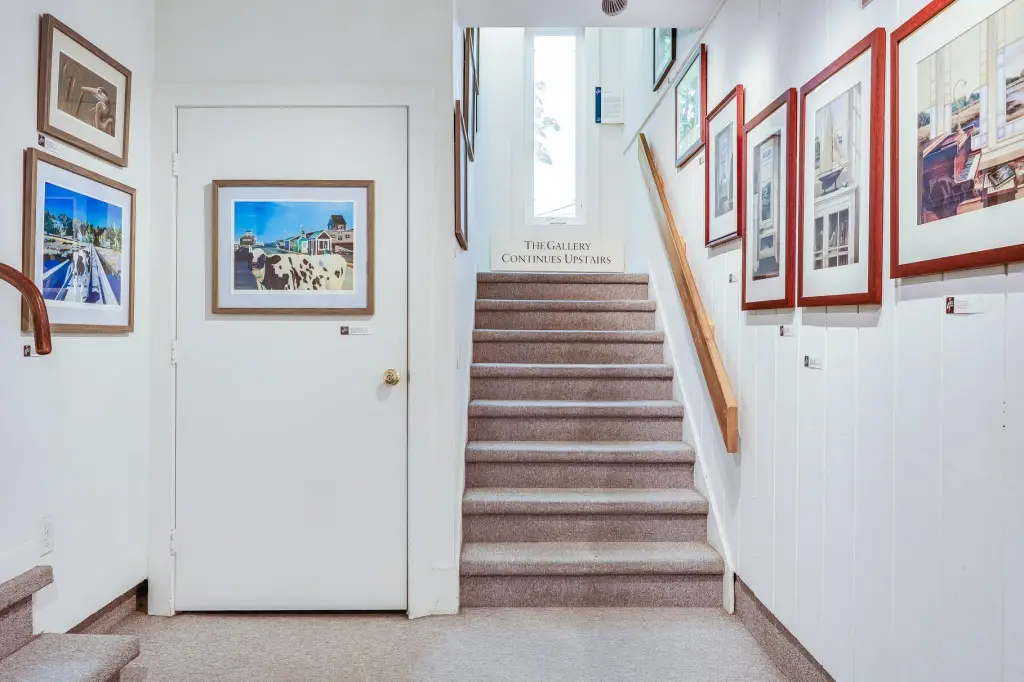
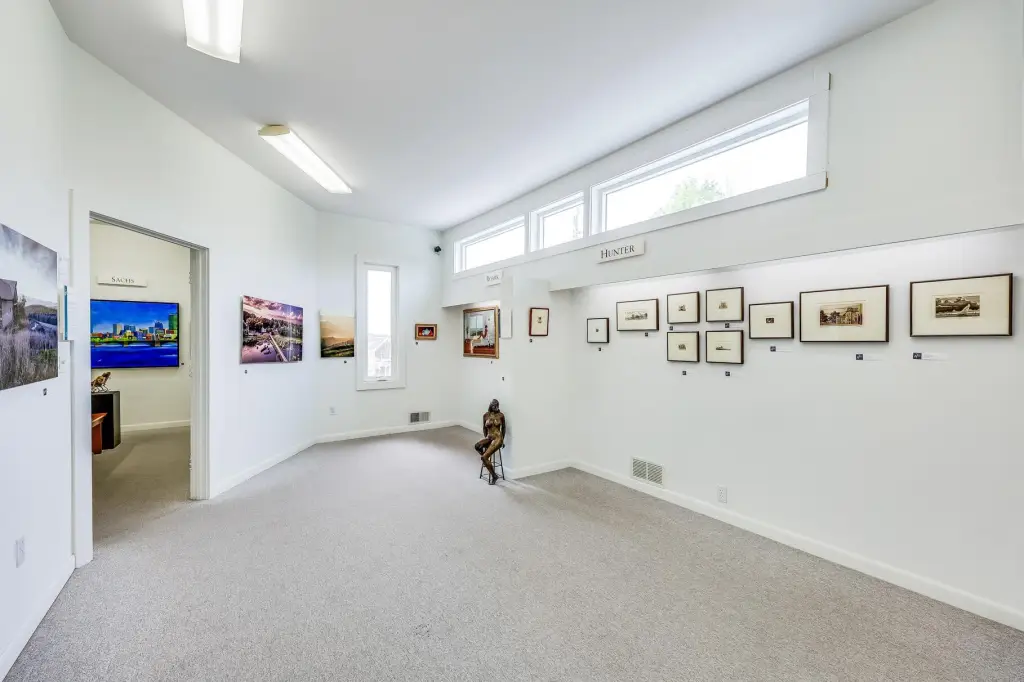
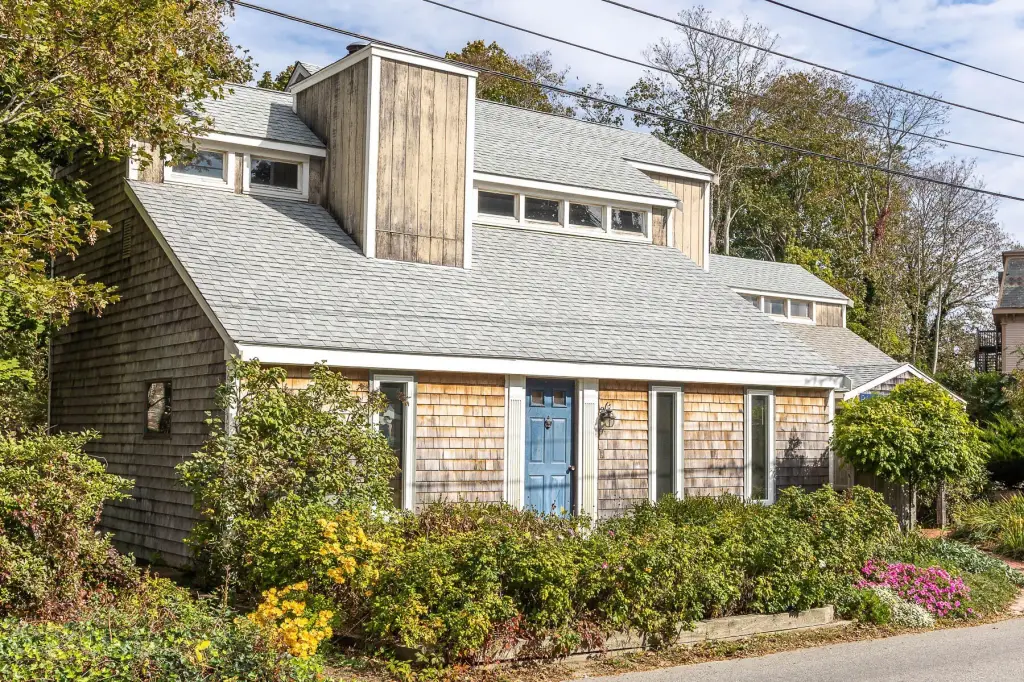
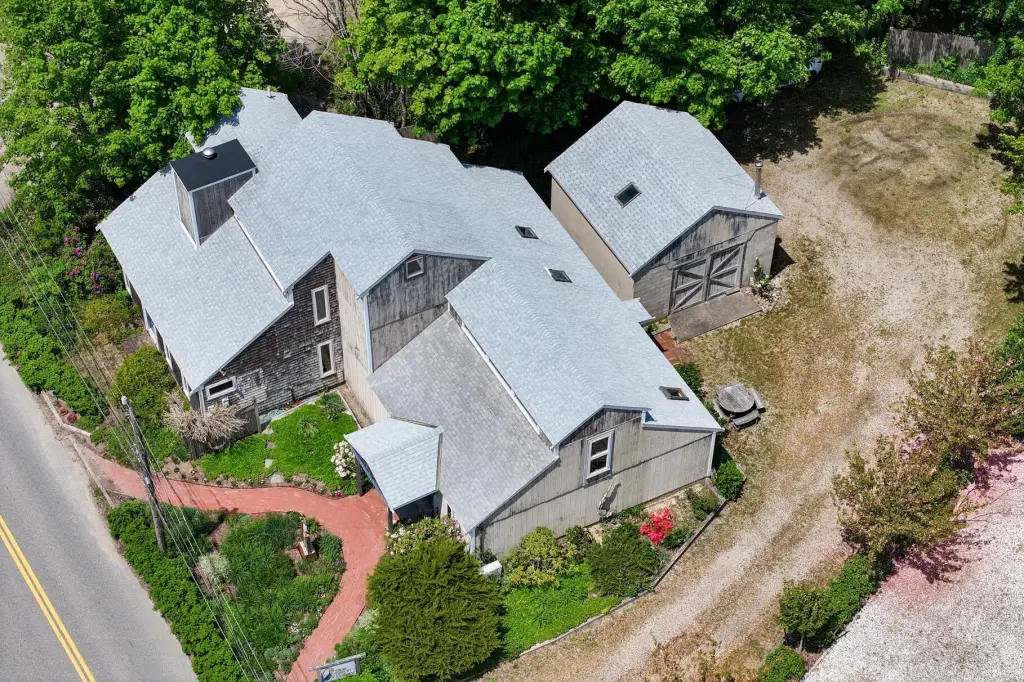
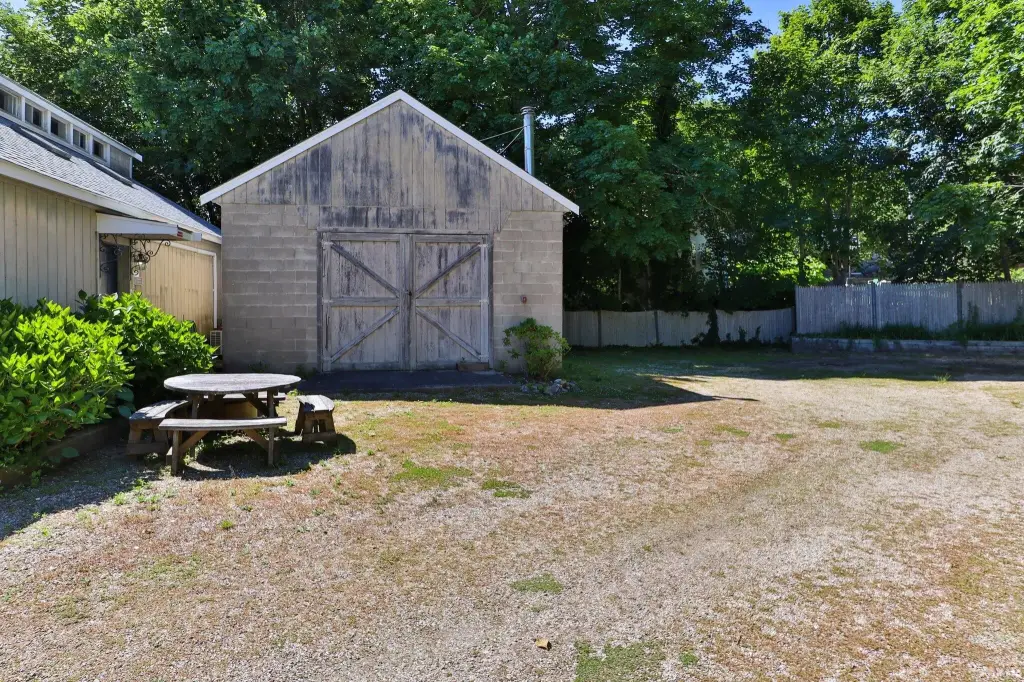
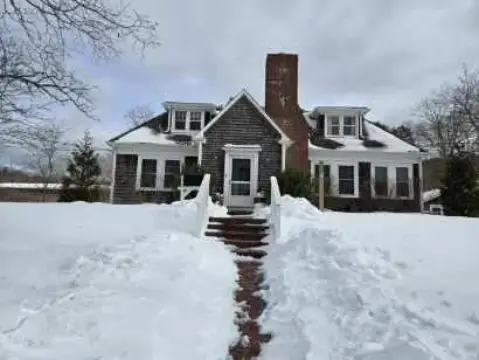
This 3,119-square-foot storefront property occupies a 0.26-acre parcel and dates to 1945. The wood-frame building features barnboard construction, vinyl and carpet flooring, central air, oil heat, a water heater, high-speed internet, and off-street parking. Fenced, landscaped grounds provide an established outdoor setting, while recent work includes a newer asphalt roof, updated windows, Azek trim, and refreshed landscaping.
The property is served by a private well and septic system. A Board of Health-approved septic repair plan is in hand, with completion of the repair remaining the buyer’s responsibility after closing. Commercial and residential zoning are both identified in the property information, allowing prospective buyers to evaluate continued gallery or boutique use, live/work occupancy, or residential use subject to due diligence and applicable approvals.
The property is served by a private well and septic system. A Board of Health-approved septic repair plan is in hand, with completion of the repair remaining the buyer’s responsibility after closing. Commercial and residential zoning are both identified in the property information, allowing prospective buyers to evaluate continued gallery or boutique use, live/work occupancy, or residential use subject to due diligence and applicable approvals.
Key Highlights
- 3,119 SF storefront property on 0.26 acres
- Commercial and residential zoning identified
- Wood‑frame and barnboard construction dating to 1945
Financial Insights
Estimated NOI and Cap Rate
NOI / Yr
$64,058
Cap Rate
5.57%
Suggested Prices Based on Cap Rates
Cap Rate 5%
$1,281,160
$1.3M
Cap Rate 7%
$915,114
$915.1K
Cap Rate 9%
$711,756
$711.8K
Market Conditions
NOI Build-Up for 3,119 SF
Gross rent
$93.6K $30.00/SF
− Vacancy
−$2.1K −$0.66/SF
EGI
$91.5K $29.34/SF
− OpEx
−$27.5K −$8.80/SF
NOI
$64.1K $20.54/SF
Area
Barnstable County, MA
Vacancy
2.20%
Lease Rate
$30.00 /SF/Yr
Expense Ratio
30.00%
Simulate Cap Rate and NOI
Suggested Prices Based on Cap Rates
Cap Rate 5%
$1,281,160
Cap Rate 7%
$915,114
Cap Rate 9%
$711,756
Alternative Uses
Best Use
Retail
$915.1K
$800.7K – $1.07M
NOI $64,058 @ 7.0% cap · market cap 5.57%
Second Best
—
—
no second resolved use
Theoretical Best
Office A
$1.27M
$1.11M – $1.48M
NOI $88,971 @ 7.0% cap · market cap 7.74%
Zoning and permitted uses should be independently verified with authorities.
Property Analytics
Unlock full access to Insights
Subscribe to Realmo Intelligence
Open Analytics
Current Use
Location Intelligence
Trade Area within ½ mile
286
Businesses Nearby
Well-served
Demand for This Use
Explore this area
Business Placement
Demographics for 02667, MA
3,309
Population
4,139
Households
0.8
Avg Household Size
60
Median Age
56%
College-Educated
99%
High-School Grad
16.9 sq mi
ZIP Area
196
Density / Sq Mi
$115,469
Median Household Income
$48,186
Median Earnings
$1,200
Median Rent
$760,000
Median Home Value
Check the figures for this property
Cap Rate, Value Estimation, Potential NOI and more
View Realmo Analytics
Market
Vacancy Rate% for Retail in Northeast region

Questions? Ask Rey
Realmo’s AI knows this listing — price, zoning, demand, history. Ask anything.




Similar Off Market Nearby
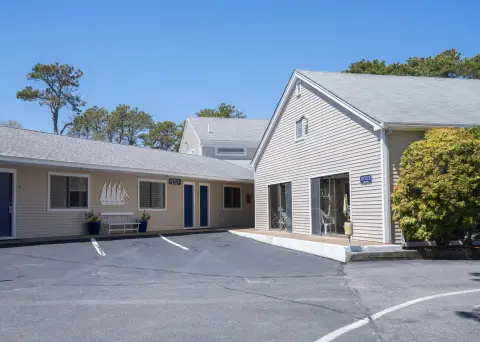
- Kelley's Flowers — 45 W Main St, Wellfleet, MA 02667
Frequently Asked Questions
What type of property is this?
Storefront property - Commercial and residential zoning supports a range of potential uses, subject to buyer verification.
Where is this storefront property located?
The property is located at 20 Bank Street Wellfleet, MA.
What is the asking price?
The asking price for this property is $1,150,000.
What are key features of this property?
This property features: 3,119 SF storefront property on 0.26 acres; Commercial and residential zoning identified; Wood‑frame and barnboard construction dating to 1945


