Charming Gallery in Wellfleet
For Sale
$1,350,000
20 Bank, Wellfleet, MA 02667
Commercial/Residential property with endless potential in a sought-after location.
Property Size3,119 SF
Price / SF$432.83
Days on Market502
Property Features for 20 Bank
General Information
Standard status
Active
Size
3,119 SF
Taxes and HOA fees
Annual Taxes
$4,573
Building Details
Year Built
1945
Listing Agency:
GIBSON SOTHEBY'S INTERNATIONAL REALTY
Listed By:
DAWN LEE
(508) 896-5000
Source:
Corcoran
Added: May 22, 2025
Changed: Mar 16
Last Checked: Mar 16 at 9:09AM
Displayed information is deemed reliable but is not guaranteed and should be independently verified. All listing content including descriptions, pricing, images are the copyrighted material of GIBSON SOTHEBY'S INTERNATIONAL REALTY
Investment Insights
Based on property information with market context.
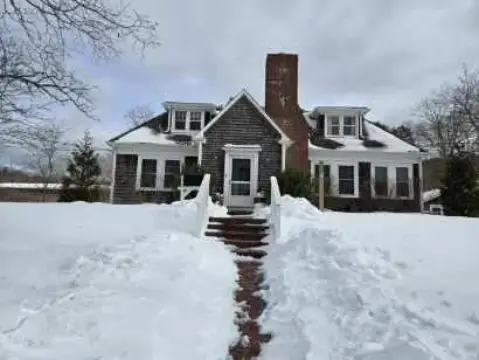
Located just off Main Street in the heart of Wellfleet, this property, known as the Blue Heron Gallery, offers charm, opportunity, and a desirable location. The cottage roots date back to 1946 in Truro, and it was relocated to Wellfleet in the 1970s. Zoned for both commercial and residential use, the property presents endless potential as a boutique storefront, gallery, or creatively reimagined residence with space for up to two bedrooms. Currently used exclusively as a gallery, its layout and visibility support a wide range of possibilities. The property size is 3119 square feet. The blooming gardens are moments from Wellfleet's village center, renowned for its eateries, galleries, boutiques, and world-famous oysters. Recent improvements include a newer roof, updated windows, Azek trim, and refreshed landscaping. The property offers a rare chance to shape your vision in one of Cape Cod's most sought-after settings. It can be used as live-work space, retail space, or mixed-use property.
Key Highlights
- Prime location just off Main Street in the heart of Wellfleet, close to restaurants, galleries, boutiques, and Wellfleet oysters.
- Zoned for both Commercial and Residential use, offering diverse opportunities for business or living space.
- Unique property with a history dating back to 1946, relocated to Wellfleet in the 1970s.
Financial Insights
Estimated NOI and Cap Rate
NOI / Yr
$64,058
Cap Rate
4.75%
Suggested Prices Based on Cap Rates
Cap Rate 5%
$1,281,160
$1.3M
Cap Rate 7%
$915,114
$915.1K
Cap Rate 9%
$711,756
$711.8K
Market Conditions
NOI Build-Up for 3,119 SF
Gross rent
$93.6K $30.00/SF
− Vacancy
−$2.1K −$0.66/SF
EGI
$91.5K $29.34/SF
− OpEx
−$27.5K −$8.80/SF
NOI
$64.1K $20.54/SF
Area
Barnstable County, MA
Vacancy
2.20%
Lease Rate
$30.00 /SF/Yr
Expense Ratio
30.00%
Simulate Cap Rate and NOI
Suggested Prices Based on Cap Rates
Cap Rate 5%
$1,281,160
Cap Rate 7%
$915,114
Cap Rate 9%
$711,756
Alternative Uses
Best Use
Retail
$915.1K
$800.7K – $1.07M
NOI $64,058 @ 7.0% cap · market cap 4.75%
Second Best
Mixed Use
$621.6K
$543.9K – $725.2K
NOI $43,510 @ 7.0% cap · market cap 3.22%
Theoretical Best
Office A
$1.27M
$1.11M – $1.48M
NOI $88,971 @ 7.0% cap · market cap 6.59%
Zoning and permitted uses should be independently verified with authorities.
Property Analytics
Unlock full access to Insights
Subscribe to Realmo Intelligence
Open Analytics
Current Use
Location Intelligence
Trade Area within ½ mile
286
Businesses Nearby
Well-served
Demand for This Use
Explore this area
Business Placement
Demographics for 02667, MA
3,309
Population
4,139
Households
0.8
Avg Household Size
60
Median Age
56%
College-Educated
99%
High-School Grad
16.9 sq mi
ZIP Area
196
Density / Sq Mi
$115,469
Median Household Income
$48,186
Median Earnings
$1,200
Median Rent
$760,000
Median Home Value
Check the figures for this property
Cap Rate, Value Estimation, Potential NOI and more
View Realmo Analytics
Market
Vacancy Rate% for Retail in Northeast region

Questions? Ask Rey
Realmo’s AI knows this listing — price, zoning, demand, history. Ask anything.


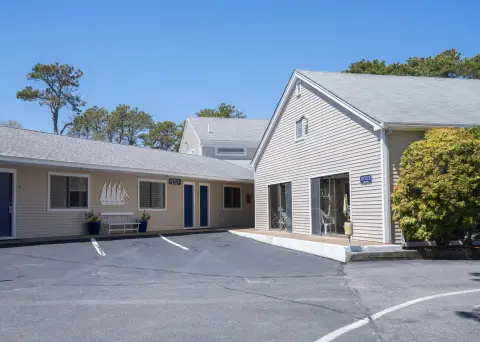


Similar Off Market Nearby
- Outer Cape Carpets — 2766 US-6, Wellfleet, MA 02667
Frequently Asked Questions
What type of property is this?
Showroom - Commercial/Residential property with endless potential in a sought-after location.
Where is this showroom located?
The property is located at 20 Bank Wellfleet, MA.
What is the asking price?
The asking price for this property is $1,350,000.
What are key features of this property?
This property features: Prime location just off Main Street in the heart of Wellfleet, close to restaurants, galleries, boutiques, and Wellfleet oysters.; Zoned for both Commercial and Residential use, offering diverse opportunities for business or living space.; Unique property with a history dating back to 1946, relocated to Wellfleet in the 1970s.


