Updated Two-Family
For Sale
$1,399,000
20-22 Glendale Lane, Harwich, MA 02645
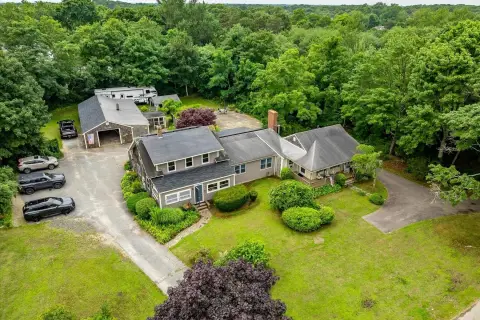
Town-approved duplex with renovated interiors, separate living areas, and coastal proximity.
Property Size3,138 SF
Price / SF$451.29
Days on Market49
Property Features for 20-22 Glendale Lane
General Information
Standard status
Active
Size
3,138 SF
Property subtype
Multi-Family
Zoning
R
Additional Details
Utilities to Site
Yes
Multifamily Units
2
Taxes and HOA fees
Annual Taxes
$4,292
Amenities
private outdoor shower
expansive new deck
generous yard
Building Details
Building Size
3,138 SF
Year Built
1962
Year Renovated
2026
Buildings
1
Stories
2
Listing Agency:
Classic Cape Real Estate, LLC
Listed By:
Ken Hager
(508) 737-9974
Source:
Link.flexmls
Added: Aug 20
Changed: Sep 25
Last Checked: Oct 5 at 3:02PM
Displayed information is deemed reliable but is not guaranteed and should be independently verified. All listing content including descriptions, pricing, images are the copyrighted material of Classic Cape Real Estate, LLC
Investment Insights
Based on property information with market context.
This Town-approved duplex at 20-22 Glendale Lane includes a renovated main residence and a separate one-bedroom unit. The approximately 1,600-square-foot primary dwelling has three bedrooms, updated hardwood flooring, a redesigned kitchen with vaulted ceilings, stone countertops, a center island, and new appliances. Its primary bathroom includes dual vanities, stone finishes, and a large tiled shower. A 700-square-foot finished lower level provides an additional bedroom and living area.
The approximately 800-square-foot second unit includes one bedroom, a kitchen, a bathroom, and mini splits for heating and cooling. Property improvements include new siding, windows, skylights, plumbing, electrical systems, and HVAC with gas heat and central AC. Additional features include a new septic system, city water, a large deck, private outdoor shower, and generous yard. The property is located in Harwich, less than two miles from the beach.
The approximately 800-square-foot second unit includes one bedroom, a kitchen, a bathroom, and mini splits for heating and cooling. Property improvements include new siding, windows, skylights, plumbing, electrical systems, and HVAC with gas heat and central AC. Additional features include a new septic system, city water, a large deck, private outdoor shower, and generous yard. The property is located in Harwich, less than two miles from the beach.
Key Highlights
- Town‑approved duplex at 20‑22 Glendale Lane, Harwich, MA 02645
- Approximately 1,600‑square‑foot main residence with 3 bedrooms
- Approximately 800‑square‑foot second unit with 1 bedroom
Financial Insights
Estimated NOI and Cap Rate
NOI / Yr
$69,104
Cap Rate
4.94%
Suggested Prices Based on Cap Rates
Cap Rate 5%
$1,382,080
$1.4M
Cap Rate 7%
$987,200
$987.2K
Cap Rate 9%
$767,822
$767.8K
Market Conditions
NOI Build-Up for 3,100 SF
Gross rent
$102.3K $33.00/SF
− Vacancy
−$3.6K −$1.16/SF
EGI
$98.7K $31.85/SF
− OpEx
−$29.6K −$9.55/SF
NOI
$69.1K $22.29/SF
Area
Barnstable County, MA
Vacancy
3.50%
Lease Rate
$33.00 /SF/Yr
Expense Ratio
30.00%
Simulate Cap Rate and NOI
Suggested Prices Based on Cap Rates
Cap Rate 5%
$1,382,080
Cap Rate 7%
$987,200
Cap Rate 9%
$767,822
Alternative Uses
Best Use
Multifamily LT 5
$987.2K
$863.8K – $1.15M
NOI $69,104 @ 7.0% cap · market cap 4.94%
Second Best
Apartment 5plus
$887.4K
$776.5K – $1.04M
NOI $62,119 @ 7.0% cap · market cap 4.44%
Theoretical Best
Office A
$1.26M
$1.11M – $1.47M
NOI $88,429 @ 7.0% cap · market cap 6.32%
Zoning and permitted uses should be independently verified with authorities.
Property Analytics
Unlock full access to Insights
Subscribe to Realmo Intelligence
Open Analytics
Current Use
Lease Details
2
Residential units
Yes
Utilities to site
Location Intelligence
Trade Area within ½ mile
91
Businesses Nearby
Explore this area
Business Placement
Demographics for 02645, MA
10,436
Population
6,745
Households
1.5
Avg Household Size
55
Median Age
43%
College-Educated
99%
High-School Grad
16.9 sq mi
ZIP Area
618
Density / Sq Mi
$89,898
Median Household Income
$56,692
Median Earnings
$1,809
Median Rent
$581,200
Median Home Value
Check the figures for this property
Cap Rate, Value Estimation, Potential NOI and more
View Realmo Analytics
Market
Vacancy Rate% for Multifamily in Northeast region

Questions? Ask Rey
Realmo’s AI knows this listing — price, zoning, demand, history. Ask anything.


Frequently Asked Questions
What type of property is this?
Duplex - Town-approved duplex with renovated interiors, separate living areas, and coastal proximity.
Where is this duplex located?
The property is located at 20-22 Glendale Lane Harwich, MA.
What is the asking price?
The asking price for this property is $1,399,000.
What are key features of this property?
This property features: Town‑approved duplex at 20‑22 Glendale Lane, Harwich, MA 02645; Approximately 1,600‑square‑foot main residence with 3 bedrooms; Approximately 800‑square‑foot second unit with 1 bedroom



