Residential Duplex with Open
For Sale
$214,900
18208 Manera Way, Edmond, OK 73012
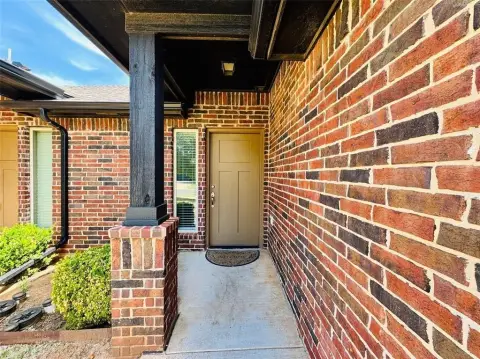
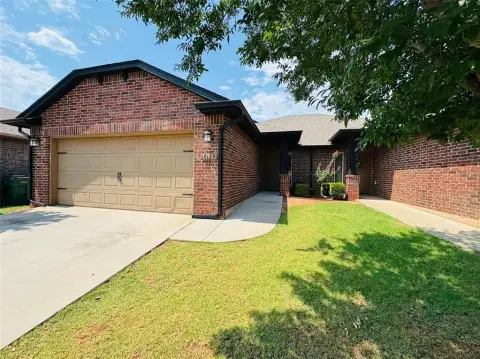
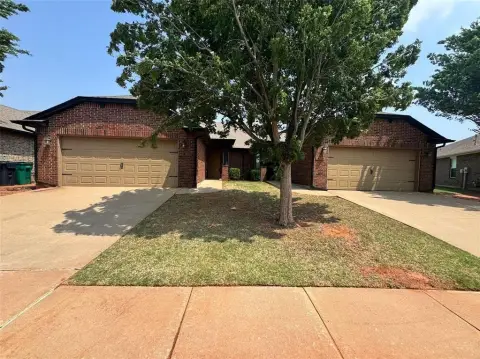
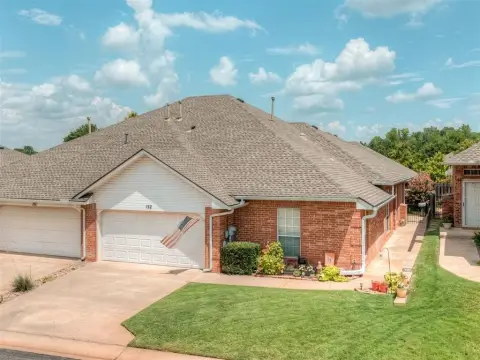
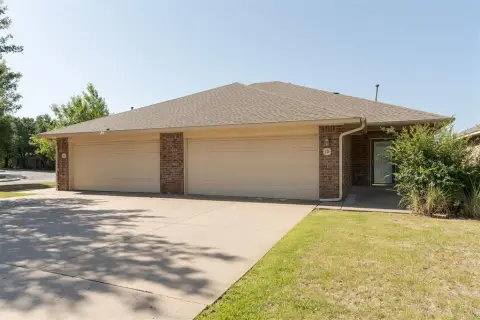
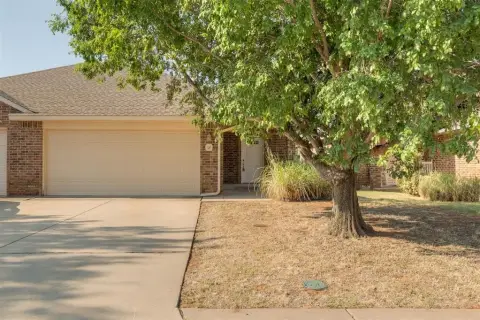
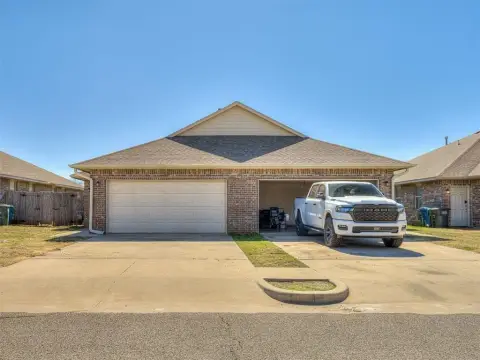
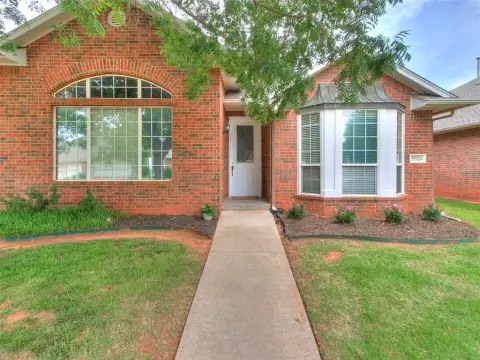
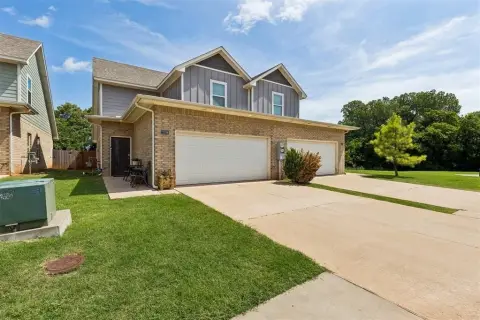
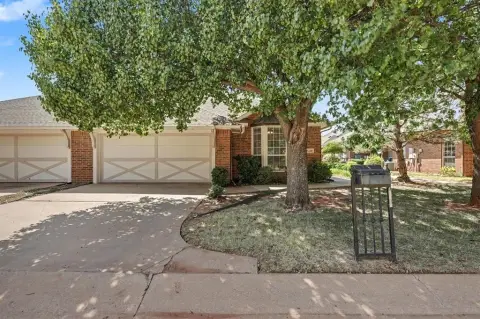
Duplex in Edmond with HOA-maintained yards and access to neighborhood parks and a splash pad.
Property Size1,485 SF
Days on Market181
Property Features for 18208 Manera Way
General Information
Standard status
Active
Size
1,485 SF
Property subtype
Half Duplex
Additional Details
Multifamily Units
2
Taxes and HOA fees
Annual Taxes
$3,461
Building Details
Building Size
1,485 SF
Year Built
2016
Listing Agency:
Flotilla Real Estate Partners
Listed By:
Brandon Hart
(405) 948-7500
Source:
Stetsonbentley
Added: Apr 21
Changed: Oct 14
Last Checked: Oct 16 at 4:30PM
Displayed information is deemed reliable but is not guaranteed and should be independently verified. All listing content including descriptions, pricing, images are the copyrighted material of Flotilla Real Estate Partners

Ask AI about this property
Review the available facts, identify missing information and prepare questions for the agent.
Investment Insights
Based on property information with market context.
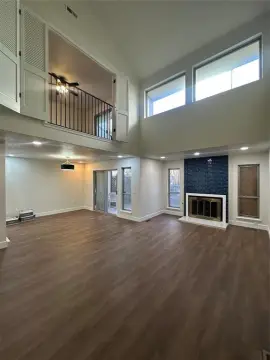
Built in 2016, this residential duplex offers a three-bedroom, two-bath configuration with an open interior plan and split-bedroom arrangement. Tall ceilings, large windows, generous closet space, and substantial cabinet storage contribute to the functional layout. The primary suite is positioned separately from the other bedrooms for added privacy, while abundant natural light supports a bright interior setting.
The property is located in Edmond’s Deer Creek area at 18208 Manera Way. The HOA handles yard maintenance and provides access to neighborhood parks and a splash pad. Shopping, dining, and everyday conveniences are identified nearby, supporting practical day-to-day use. The home is described as move-in ready.
The property is located in Edmond’s Deer Creek area at 18208 Manera Way. The HOA handles yard maintenance and provides access to neighborhood parks and a splash pad. Shopping, dining, and everyday conveniences are identified nearby, supporting practical day-to-day use. The home is described as move-in ready.
Key Highlights
- Three‑bedroom, two‑bath duplex configuration
- Built in 2016
- Open layout with split‑bedroom design
Financial Insights
Estimated NOI and Cap Rate
NOI / Yr
$9,449
Cap Rate
4.40%
Suggested Prices Based on Cap Rates
Cap Rate 5%
$188,980
$189.0K
Cap Rate 7%
$134,986
$135.0K
Cap Rate 9%
$104,989
$105.0K
Market Conditions
NOI Build-Up for 1,485 SF
Gross rent
$19.1K $12.84/SF
− Vacancy
−$1.9K −$1.27/SF
EGI
$17.2K $11.57/SF
− OpEx
−$7.7K −$5.21/SF
NOI
$9.4K $6.36/SF
Area
Oklahoma County, OK
Vacancy
9.90%
Lease Rate
$12.84 /SF/Yr
Expense Ratio
45.00%
Simulate Cap Rate and NOI
Suggested Prices Based on Cap Rates
Cap Rate 5%
$188,980
Cap Rate 7%
$134,986
Cap Rate 9%
$104,989
Alternative Uses
Best Use
Apartment 5plus
$135.0K
$118.1K – $157.5K
NOI $9,449 @ 7.0% cap · market cap 4.40%
Second Best
—
—
no second resolved use
Theoretical Best
Office A
$309.3K
$270.6K – $360.9K
NOI $21,651 @ 7.0% cap · market cap 10.07%
Zoning and permitted uses should be independently verified with authorities.
How Realmo checks its estimates
Property Analytics
Unlock full access to Insights
Subscribe to Realmo Intelligence
Open Analytics
Current Use
Lease Details
2
Residential units
Location Intelligence
Trade Area within ½ mile
157
Businesses Nearby
Explore this area
Business Placement
Demographics for 73012, OK
41,289
Population
16,172
Households
2.6
Avg Household Size
34
Median Age
56%
College-Educated
97%
High-School Grad
34.1 sq mi
ZIP Area
1,211
Density / Sq Mi
$123,528
Median Household Income
$59,000
Median Earnings
$1,779
Median Rent
$295,500
Median Home Value
Check the figures for this property
Cap Rate, Value Estimation, Potential NOI and more
View Realmo Analytics
Frequently Asked Questions
What type of property is this?
Residential income property - Duplex in Edmond with HOA-maintained yards and access to neighborhood parks and a splash pad.
Where is this residential income property located?
The property is located at 18208 Manera Way Edmond, OK.
What is the asking price?
The asking price for this property is $214,900.
What are key features of this property?
This property features: Three‑bedroom, two‑bath duplex configuration; Built in 2016; Open layout with split‑bedroom design