Mixed-Use Building with
For Sale
$329,500
17 North 4th Street, Emmaus, PA 18049
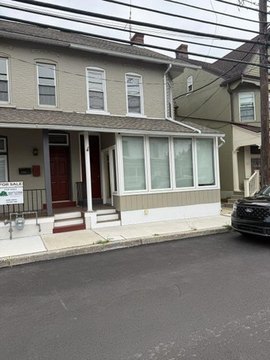
Commercial space occupies the ground level, with a newly completed vacant apartment above and rear parking.
Property Size1,620 SF
Days on Market60
Property Features for 17 North 4th Street
General Information
Standard status
Active
Size
1,620 SF
Property subtype
Commercial
Taxes and HOA fees
Annual Taxes
$4,272
Building Details
Building Size
1,620 SF
Year Built
1885
Listing Agency:
Hawthorne Real Estate
Listed By:
Mark Smith
(610) 628-4022
Source:
Bhhspaulfordrealtors
Added: Aug 15
Changed: Oct 8
Last Checked: Oct 13 at 3:42AM
Displayed information is deemed reliable but is not guaranteed and should be independently verified. All listing content including descriptions, pricing, images are the copyrighted material of Hawthorne Real Estate
Investment Insights
Based on property information with market context.
Located at 17 North 4th Street in Emmaus Boro, this mixed-use property combines commercial space on the first floor with a newly completed, vacant two-bedroom apartment on the level above. The building dates to 1885 and includes rear parking.
A hair salon occupies part of the ground-floor commercial area, with the tenancy in place since 2020. The property is one of two adjoining twin properties, and both may be acquired together. Each property is held under a separate deed, providing distinct ownership records for the individual assets.
A hair salon occupies part of the ground-floor commercial area, with the tenancy in place since 2020. The property is one of two adjoining twin properties, and both may be acquired together. Each property is held under a separate deed, providing distinct ownership records for the individual assets.
Key Highlights
- Newly completed vacant two‑bedroom apartment above the commercial floor
- Part of the first floor is leased to a hair salon; tenancy dates to 2020
- Rear parking area included
Financial Insights
Estimated NOI and Cap Rate
NOI / Yr
$16,676
Cap Rate
5.06%
Suggested Prices Based on Cap Rates
Cap Rate 5%
$333,520
$333.5K
Cap Rate 7%
$238,229
$238.2K
Cap Rate 9%
$185,289
$185.3K
Market Conditions
NOI Build-Up for 1,620 SF
Gross rent
$29.2K $18.00/SF
− Vacancy
−$2.5K −$1.53/SF
EGI
$26.7K $16.47/SF
− OpEx
−$10.0K −$6.18/SF
NOI
$16.7K $10.29/SF
Area
Lehigh County, PA
Vacancy
8.50%
Lease Rate
$18.00 /SF/Yr
Expense Ratio
37.50%
Simulate Cap Rate and NOI
Suggested Prices Based on Cap Rates
Cap Rate 5%
$333,520
Cap Rate 7%
$238,229
Cap Rate 9%
$185,289
Alternative Uses
Best Use
Mixed Use
$238.2K
$208.5K – $277.9K
NOI $16,676 @ 7.0% cap · market cap 5.06%
Second Best
Retail
$157.7K
$138.0K – $184.0K
NOI $11,041 @ 7.0% cap · market cap 3.35%
Theoretical Best
—
—
same as Best Use
Zoning and permitted uses should be independently verified with authorities.
How Realmo checks its estimates
Property Analytics
Unlock full access to Insights
Subscribe to Realmo Intelligence
Open Analytics
Current Use
Location Intelligence
Trade Area within ½ mile
718
Businesses Nearby
5k
Monthly Visits Nearby
Explore this area
Business Placement
Foot Traffic Nearby
Shops & Services 100%
Exxon
Shops & Services
5,417 visits/mo
0.4 miles
Demographics for 18049, PA
18,440
Population
7,659
Households
2.4
Avg Household Size
43
Median Age
38%
College-Educated
94%
High-School Grad
15.0 sq mi
ZIP Area
1,229
Density / Sq Mi
$93,924
Median Household Income
$44,310
Median Earnings
$1,316
Median Rent
$282,500
Median Home Value
Check the figures for this property
Cap Rate, Value Estimation, Potential NOI and more
View Realmo Analytics
Market
Vacancy Rate% for Retail in Northeast region

Questions? Ask Rey
Realmo’s AI knows this listing — price, zoning, demand, history. Ask anything.



Frequently Asked Questions
What type of property is this?
Mixed-use property - Commercial space occupies the ground level, with a newly completed vacant apartment above and rear parking.
Where is this mixed-use property located?
The property is located at 17 North 4th Street Emmaus, PA.
What is the asking price?
The asking price for this property is $329,500.
What are key features of this property?
This property features: Newly completed vacant two‑bedroom apartment above the commercial floor; Part of the first floor is leased to a hair salon; tenancy dates to 2020; Rear parking area included


