Three-Unit Multifamily
For Sale
Contact for pricing
16 Wilson Street, Stamford, CT 06902
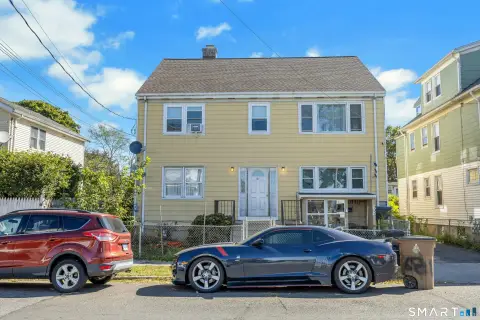
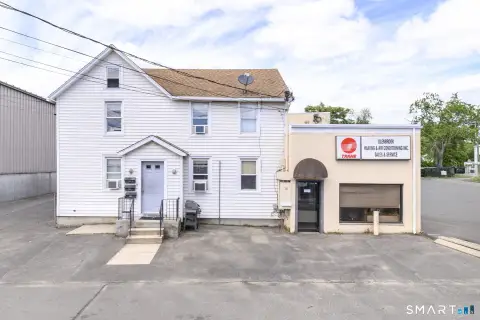
Three-unit multifamily with off-street parking near Stamford Train Station, suited for owner-operators and investors.
Property Size3,867 SF
Lot Size0.11 Acres
Price / SF$333.59
Days on Market122
Property Features for 16 Wilson Street
General Information
Standard status
Active
Size
3,867 SF
Total Parking Spaces
4
Lot size
0.11 Acres
Property subtype
Multifamily
Occupancy
100%
Net Operating Income
$90,343
Additional Details
Multifamily Units
3
Building Details
Year Built
1925
Buildings
1
Stories
3
Units
3
Listing Agency:
National Multifamily
Listed By:
Matt Cawley · License #10311209468
Source:
Crexi
Added: Jun 16
Changed: Oct 15
Last Checked: Oct 14 at 8:39PM
Displayed information is deemed reliable but is not guaranteed and should be independently verified. All listing content including descriptions, pricing, images are the copyrighted material of National Multifamily

Ask AI about this property
Review the available facts, identify missing information and prepare questions for the agent.
Investment Insights
Based on property information with market context.
This three-unit multifamily property at 16 Wilson Street offers a straightforward income-residential layout in a building constructed in 1925. The property includes approximately 3,867 square feet of gross living area on a 0.11-acre lot. Tenants have access to four off-street parking spaces. Heat and hot water are metered and paid by tenants through individual systems: two units use gas boilers and hot water heaters, while the third unit uses electric heat with a gas hot water heater. In addition to the apartment space, there is a partially finished basement that is currently not in use.
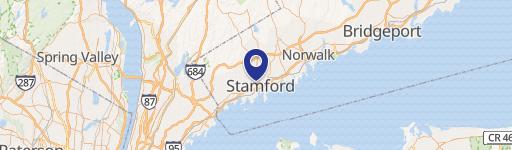
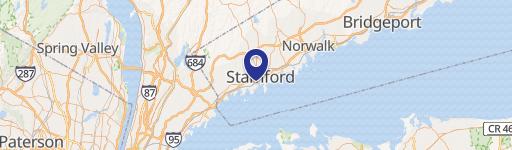
The building is located on the West Side of Stamford, approximately one mile from the Stamford Train Station. That station serves as a major regional transit hub with convenient access to New York City via Metro-North and Amtrak, along with local bus service.
As a purchase, this property can fit buyers looking to operate or manage a small multifamily asset while addressing interior updates through natural unit renovations. The existing partially finished basement may offer a pathway to additional usable area for the first-floor apartment, subject to design and permitting. With four parking spaces onsite and the ability for tenants to generate income from parking, the property’s overall setup is aligned with practical, value-conscious ownership within a transit-accessible West Side location.
The building is located on the West Side of Stamford, approximately one mile from the Stamford Train Station. That station serves as a major regional transit hub with convenient access to New York City via Metro-North and Amtrak, along with local bus service.
As a purchase, this property can fit buyers looking to operate or manage a small multifamily asset while addressing interior updates through natural unit renovations. The existing partially finished basement may offer a pathway to additional usable area for the first-floor apartment, subject to design and permitting. With four parking spaces onsite and the ability for tenants to generate income from parking, the property’s overall setup is aligned with practical, value-conscious ownership within a transit-accessible West Side location.
Key Highlights
- Three‑unit multifamily built in 1925 on a 0.11‑acre lot with approx. 3,867 SF of gross living area
- About 1 mile from Stamford Train Station with access to Metro‑North, Amtrak, and local bus service
- 4 off‑street parking spaces provided for tenants
Financial Insights
Estimated NOI and Cap Rate
NOI / Yr
$74,410
Cap Rate
5.77%
Suggested Prices Based on Cap Rates
Cap Rate 5%
$1,488,200
$1.5M
Cap Rate 7%
$1,063,000
$1.1M
Cap Rate 9%
$826,778
$826.8K
Market Conditions
NOI Build-Up for 3,867 SF
Gross rent
$113.7K $29.40/SF
− Vacancy
−$7.4K −$1.91/SF
EGI
$106.3K $27.49/SF
− OpEx
−$31.9K −$8.25/SF
NOI
$74.4K $19.24/SF
Area
Stamford, CT
Vacancy
6.50%
Lease Rate
$29.40 /SF/Yr
Expense Ratio
30.00%
Simulate Cap Rate and NOI
Suggested Prices Based on Cap Rates
Cap Rate 5%
$1,488,200
Cap Rate 7%
$1,063,000
Cap Rate 9%
$826,778
Alternative Uses
Best Use
Multifamily LT 5
$1.06M
$930.1K – $1.24M
NOI $74,410 @ 7.0% cap · market cap 5.77%
Second Best
Apartment 5plus
$950.8K
$831.9K – $1.11M
NOI $66,553 @ 7.0% cap · market cap 5.16%
Theoretical Best
Office A
$1.40M
$1.22M – $1.63M
NOI $97,875 @ 7.0% cap · market cap 7.59%
Zoning and permitted uses should be independently verified with authorities.
How Realmo checks its estimates
Property Analytics
Unlock full access to Insights
Subscribe to Realmo Intelligence
Open Analytics
Current Use
Lease Details
3
Residential units
Location Intelligence
Trade Area within ½ mile
2,694
Businesses Nearby
Explore this area
Business Placement
Demographics for 06902, CT
69,192
Population
30,142
Households
2.3
Avg Household Size
36
Median Age
44%
College-Educated
85%
High-School Grad
10.0 sq mi
ZIP Area
6,919
Density / Sq Mi
$92,527
Median Household Income
$48,285
Median Earnings
$2,139
Median Rent
$515,000
Median Home Value
Check the figures for this property
Cap Rate, Value Estimation, Potential NOI and more
View Realmo Analytics
Market
Vacancy Rate% for Multifamily in Northeast region





Frequently Asked Questions
What type of property is this?
Triplex - Three-unit multifamily with off-street parking near Stamford Train Station, suited for owner-operators and investors.
Where is this triplex located?
The property is located at 16 Wilson Street Stamford, CT.
What is the asking price?
The asking price for this property is $1,290,000.
What are key features of this property?
This property features: Three‑unit multifamily built in 1925 on a 0.11‑acre lot with approx. 3,867 SF of gross living area; About 1 mile from Stamford Train Station with access to Metro‑North, Amtrak, and local bus service; 4 off‑street parking spaces provided for tenants


