Stamford Light Industrial Building For
For Sale
$999,000
34 Baxter, Stamford, CT 06902
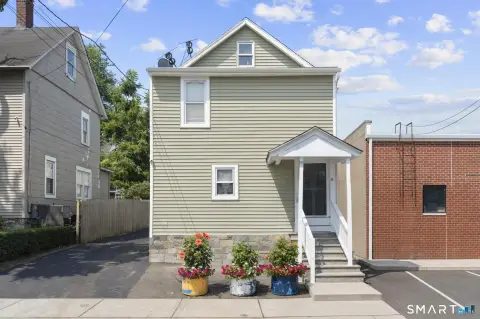
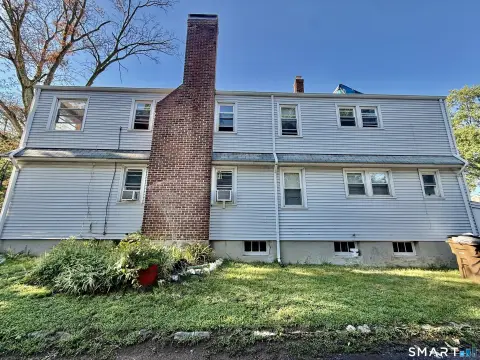
Standalone light industrial building with flexible space in Stamford, CT.
Property Size1,956 SF
Price / SF$241.89
Days on Market192
Property Features for 34 Baxter
General Information
Standard status
Active
Size
1,956 SF
Property subtype
Commercial
Lease Term
Listing ID: 24166103, Standard Status: Active, MLS Status: Active, 189 days on market
Building Details
Building Size
1,956 SF
Year Built
1956
Listing Agency:
Nizzardo Real Estate Services
(203) 883-8532
Listed By:
Cody Nizzardo · License #REB.0789595
(203) 667-3122
Source:
Iverty
Added: Apr 9
Changed: Oct 16
Last Checked: Oct 16 at 9:05AM
Displayed information is deemed reliable but is not guaranteed and should be independently verified. All listing content including descriptions, pricing, images are the copyrighted material of Nizzardo Real Estate Services

Ask AI about this property
Review the available facts, identify missing information and prepare questions for the agent.
Investment Insights
Based on property information with market context.
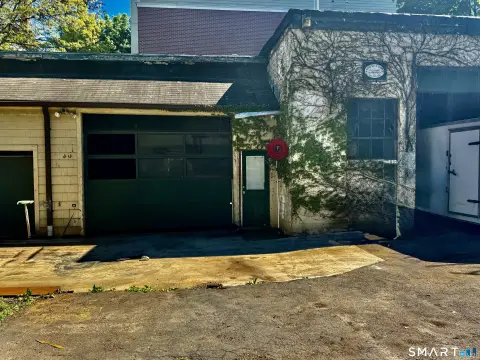
Located at 34 Baxter Avenue, Stamford, CT, this standalone light industrial building offers a rare opportunity in a high-demand commercial area. The property features approximately 3,200 square feet above grade, complemented by a 1,000 square foot basement, providing flexible space suitable for various industrial, contractor, or flex applications. Currently operating as a custom cabinet shop, the layout is well-suited for manufacturing, storage, workshop use, or owner-occupancy. The building includes a drive-in bay for convenient loading, 3-phase power to support heavy-duty operations, and 12-foot ceilings enhancing usability. A finished rear section combines office space with a half bathroom and a one-bedroom, one-bathroom apartment setup with central air, offering flexibility for owner use, employee housing, or supplemental office operations. The rear portion is currently built out as office space with a non-conforming apartment component. There is also potential for additional parking across the street. The property benefits from immediate access to I-95, facilitating regional connectivity throughout Fairfield.
Key Highlights
- Prime location with immediate access to I‑95 for seamless regional connectivity.
- 3,200 sq ft light industrial building with an additional 1,000 sq ft basement.
- Features a drive‑in bay and 3‑phase power.
Financial Insights
Estimated NOI and Cap Rate
NOI / Yr
$52,710
Cap Rate
5.28%
Suggested Prices Based on Cap Rates
Cap Rate 5%
$1,054,200
$1.1M
Cap Rate 7%
$753,000
$753.0K
Cap Rate 9%
$585,667
$585.7K
Market Conditions
NOI Build-Up for 4,130 SF
Gross rent
$86.7K $21.00/SF
− Vacancy
−$5.6K −$1.37/SF
EGI
$81.1K $19.64/SF
− OpEx
−$28.4K −$6.87/SF
NOI
$52.7K $12.76/SF
Area
Stamford, CT
Vacancy
6.50%
Lease Rate
$21.00 /SF/Yr
Expense Ratio
35.00%
Simulate Cap Rate and NOI
Suggested Prices Based on Cap Rates
Cap Rate 5%
$1,054,200
Cap Rate 7%
$753,000
Cap Rate 9%
$585,667
Alternative Uses
Best Use
Flex RnD
$753.0K
$658.9K – $878.5K
NOI $52,710 @ 7.0% cap · market cap 5.28%
Second Best
Industrial
$662.9K
$580.1K – $773.4K
NOI $46,405 @ 7.0% cap · market cap 4.65%
Theoretical Best
Office A
$1.49M
$1.31M – $1.74M
NOI $104,531 @ 7.0% cap · market cap 10.46%
Zoning and permitted uses should be independently verified with authorities.
How Realmo checks its estimates
Property Analytics
Unlock full access to Insights
Subscribe to Realmo Intelligence
Open Analytics
Current Use
Location Intelligence
Trade Area within ½ mile
1,837
Businesses Nearby
Balanced
Demand for This Use
Explore this area
Business Placement
Demographics for 06902, CT
69,192
Population
30,142
Households
2.3
Avg Household Size
36
Median Age
44%
College-Educated
85%
High-School Grad
10.0 sq mi
ZIP Area
6,919
Density / Sq Mi
$92,527
Median Household Income
$48,285
Median Earnings
$2,139
Median Rent
$515,000
Median Home Value
Check the figures for this property
Cap Rate, Value Estimation, Potential NOI and more
View Realmo Analytics
Market
Vacancy Rate% for Industrial in Northeast region






Similar Off Market Nearby
- Upper Crust Bagel Co — 197 Sound Beach Ave, Old Greenwich, CT 06870
- Libby Cooke Catering — 49 Brown House Rd, Stamford, CT 06902
- A Dash of Salt Catering — 49 Brown House Rd, Stamford, CT 06902
- Susan Kane Catering — 90 Fairfield Ave, Stamford, CT 06902
- Aux Delices (not a retail location) — 23 Acosta St, Stamford, CT 06902
Frequently Asked Questions
What type of property is this?
Flex space - Standalone light industrial building with flexible space in Stamford, CT.
Where is this flex space located?
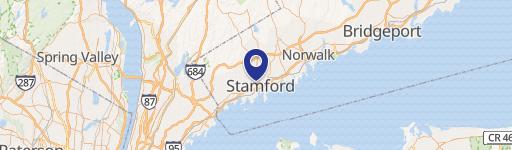
The property is located at 34 Baxter Stamford, CT.
What is the asking price?
The asking price for this property is $999,000.
What are key features of this property?
This property features: Prime location with immediate access to I‑95 for seamless regional connectivity.; 3,200 sq ft light industrial building with an additional 1,000 sq ft basement.; Features a drive‑in bay and 3‑phase power.


