Auto Service Building with
For Sale
Contact for pricing
1575 N Bendix Drive, South Bend, IN 46628
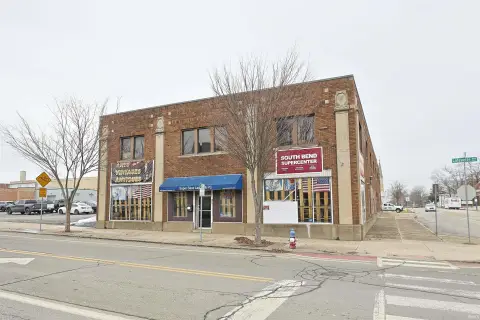
Former auto service building for sale or lease with three grade-level overhead doors, office/showroom space, and 30 parking spaces.
Property Size13,200 SF
Price / SF$82.58
Days on Market197
Property Features for 1575 N Bendix Drive
General Information
Standard status
Active
Size
13,200 SF
Total Parking Spaces
30
Property subtype
Retail
Zoning
C - Commercial
Lease Type
NNN
Investment Type
Owner/User
Site & Location
Neighborhood
Lww Gateway
Traffic Count
10,700 vehicles/day
Highway Access
Yes
Road Access
Yes
Warehouse & Industrial
Clear Height
18 ft
Drive-In Doors
3
Building Details
Buildings
1
Tenancy
Single
Construction
clear span
Listing Agency:
NAI Cressy - Mishawaka
Listed By:
Ryan Gableman · License #IN RB14049453
(574) 264-2050
Source:
Crexi
Added: Apr 11
Changed: Oct 16
Last Checked: Oct 23 at 7:00AM
Displayed information is deemed reliable but is not guaranteed and should be independently verified. All listing content including descriptions, pricing, images are the copyrighted material of NAI Cressy - Mishawaka

Ask AI about this property
Review the available facts, identify missing information and prepare questions for the agent.
Investment Insights
Based on property information with market context.
Former auto service building with approximately 13,200 SF total and 1,690 SF of office/showroom space. The service area features liner panel walls, clear span construction with no columns, and three 14' grade-level overhead doors. Ceiling heights range from 16' to 18' clear, supporting practical shop operations.
The property includes 30 on-site parking spaces and an existing monument sign along the street. It is located on Bendix Drive in South Bend, Indiana, providing visibility to over 10,700 vehicles per day (AADT) along a high-traffic corridor. The site is within 3 miles of the US-20 Bypass, the I-80/90 Toll Road, and downtown South Bend.
Zoned C-Commercial, the building is well-suited for automotive and service users, with potential for light industrial uses subject to use approval. Personal property is not included in the sale or lease and is negotiable separately.
The property includes 30 on-site parking spaces and an existing monument sign along the street. It is located on Bendix Drive in South Bend, Indiana, providing visibility to over 10,700 vehicles per day (AADT) along a high-traffic corridor. The site is within 3 miles of the US-20 Bypass, the I-80/90 Toll Road, and downtown South Bend.
Zoned C-Commercial, the building is well-suited for automotive and service users, with potential for light industrial uses subject to use approval. Personal property is not included in the sale or lease and is negotiable separately.
Key Highlights
- 13,200 SF former auto service building for sale or lease, including 1,690 SF office/showroom space
- Service area features three 14' grade‑level overhead doors and 16'-18' clear ceiling heights
- Clear span construction with no columns in the building interior; liner panel walls in the service area
Financial Insights
Estimated NOI and Cap Rate
NOI / Yr
$89,724
Cap Rate
8.23%
Suggested Prices Based on Cap Rates
Cap Rate 5%
$1,794,480
$1.8M
Cap Rate 7%
$1,281,771
$1.3M
Cap Rate 9%
$996,933
$996.9K
Market Conditions
NOI Build-Up for 13,200 SF
Gross rent
$134.6K $10.20/SF
− Vacancy
−$6.5K −$0.49/SF
EGI
$128.2K $9.71/SF
− OpEx
−$38.5K −$2.91/SF
NOI
$89.7K $6.80/SF
Area
South Bend, IN
Vacancy
4.80%
Lease Rate
$10.20 /SF/Yr
Expense Ratio
30.00%
Simulate Cap Rate and NOI
Suggested Prices Based on Cap Rates
Cap Rate 5%
$1,794,480
Cap Rate 7%
$1,281,771
Cap Rate 9%
$996,933
Alternative Uses
Best Use
Retail
$1.85M
$1.62M – $2.16M
NOI $129,730 @ 7.0% cap · market cap 11.90%
Second Best
Industrial
$1.28M
$1.12M – $1.50M
NOI $89,724 @ 7.0% cap · market cap 8.23%
Theoretical Best
Office A
$3.34M
$2.92M – $3.90M
NOI $233,760 @ 7.0% cap · market cap 21.45%
Zoning and permitted uses should be independently verified with authorities.
How Realmo checks its estimates
Property Analytics
Unlock full access to Insights
Subscribe to Realmo Intelligence
Open Analytics
Current Use
Lease Details
18 ft
Clear height
3
Drive-in doors
10,700 VPD
Traffic count
Yes
Highway access
Yes
Paved road access
Location Intelligence
Trade Area within ½ mile
267
Businesses Nearby
36k
Monthly Visits Nearby
Balanced
Demand for This Use
Explore this area
Business Placement
Foot Traffic Nearby
Shops & Services 71%
Dining 27%
Electronics 2%
Dollar General
Shops & Services
7,187 visits/mo
0.4 miles
Taco Bell
Dining
6,709 visits/mo
0.3 miles
BP
Shops & Services
6,098 visits/mo
0.1 miles
Citgo
Shops & Services
3,073 visits/mo
0.4 miles
Phillips 66
Shops & Services
2,641 visits/mo
0.3 miles
Demographics for 46628, IN
27,011
Population
12,266
Households
2.2
Avg Household Size
38
Median Age
26%
College-Educated
92%
High-School Grad
34.2 sq mi
ZIP Area
790
Density / Sq Mi
$56,889
Median Household Income
$37,423
Median Earnings
$1,068
Median Rent
$164,500
Median Home Value
Check the figures for this property
Cap Rate, Value Estimation, Potential NOI and more
View Realmo Analytics
Market
Vacancy Rate% for Retail in Midwest region




Similar Off Market Nearby
- A's MezMorEyez collision repair — 813 N Elmer St, South Bend, IN 46628
- Diesel DPF Cleaners — 1657 Commerce Dr #1b, South Bend, IN 46628
- TMT Automotive South Bend — 1575 N Bendix Dr, South Bend, IN 46628
- Hertz - Service Garage — 4477 progress dr, south bend, in 46628
Frequently Asked Questions
What type of property is this?
Auto shop - Former auto service building for sale or lease with three grade-level overhead doors, office/showroom space, and 30 parking spaces.
Where is this auto shop located?
The property is located at 1575 N Bendix Drive South Bend, IN.
What is the asking price?
The asking price for this property is $1,090,000.
What are key features of this property?
This property features: 13,200 SF former auto service building for sale or lease, including 1,690 SF office/showroom space; Service area features three 14' grade‑level overhead doors and 16'-18' clear ceiling heights; Clear span construction with no columns in the building interior; liner panel walls in the service area


