Park-Adjacent Professional Office
For Sale
$1,000,000
1530 Woodstock Road, Roswell, GA 30075
Commercial Sale, Roswell, GA
Property Size5,126 SF
Lot Size1.03 Acres
Price / SF$195.08
Days on Market109
Property Features for 1530 Woodstock Road
General Information
Property type
Commercial Sale
Property subtype
Office
Parking
2
Parking features
Parking Lot
Lot features
Level
Directions
From Marietta: North on Sandy Plains to right on Hwy 92/Woodstock Road. Home will be on your right directly across from the Leita Thompson Park. From 400: Take Holcomb Bridge toward Roswell/Woodstock. Home will be on the left directly across from the Leita Thompson Park.
Standard status
Active
APN
12 140201110201
Size
5,126 SF
Lot size
1.03 Acres
Taxes and HOA fees
Tax Year
2025
Tax Annual Amount
3320
Utilities
Utilities
Cable Available
Sewer type
Septic Tank
Heating system
Central, Forced Air
Cooling system
Electric, Central Air
Water source
Public
Amenities
private offices
conference rooms
break room
kitchenette
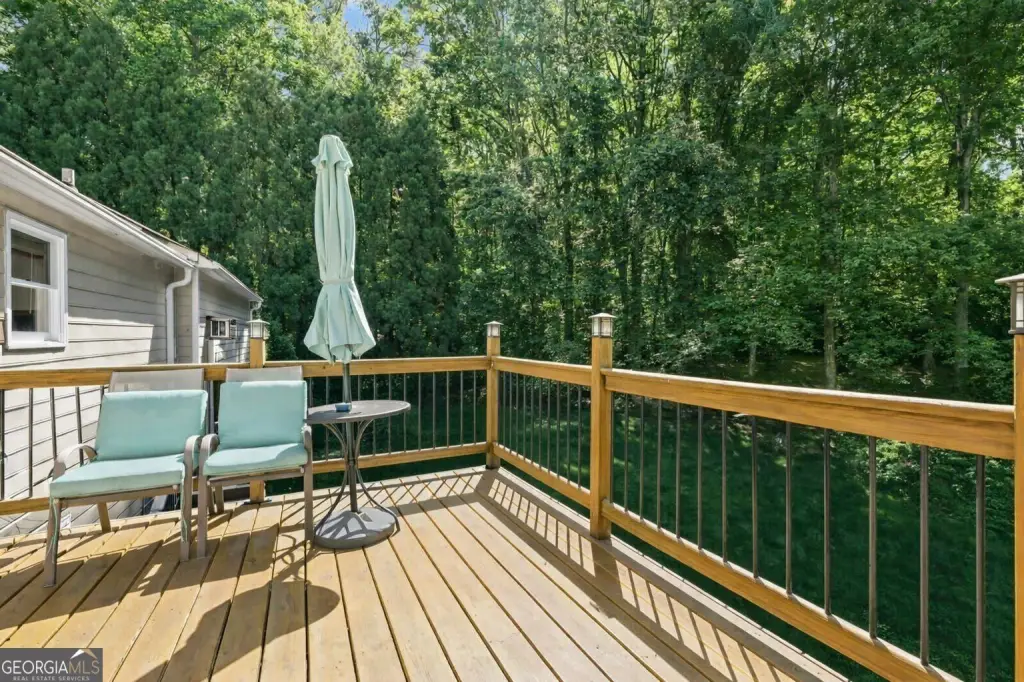
private patio
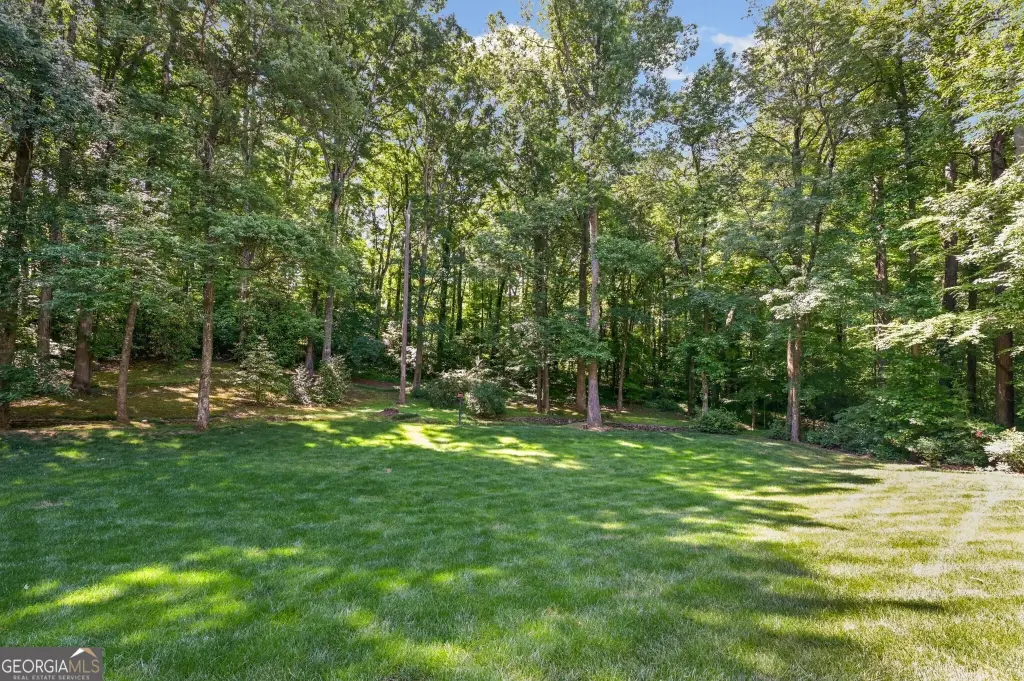
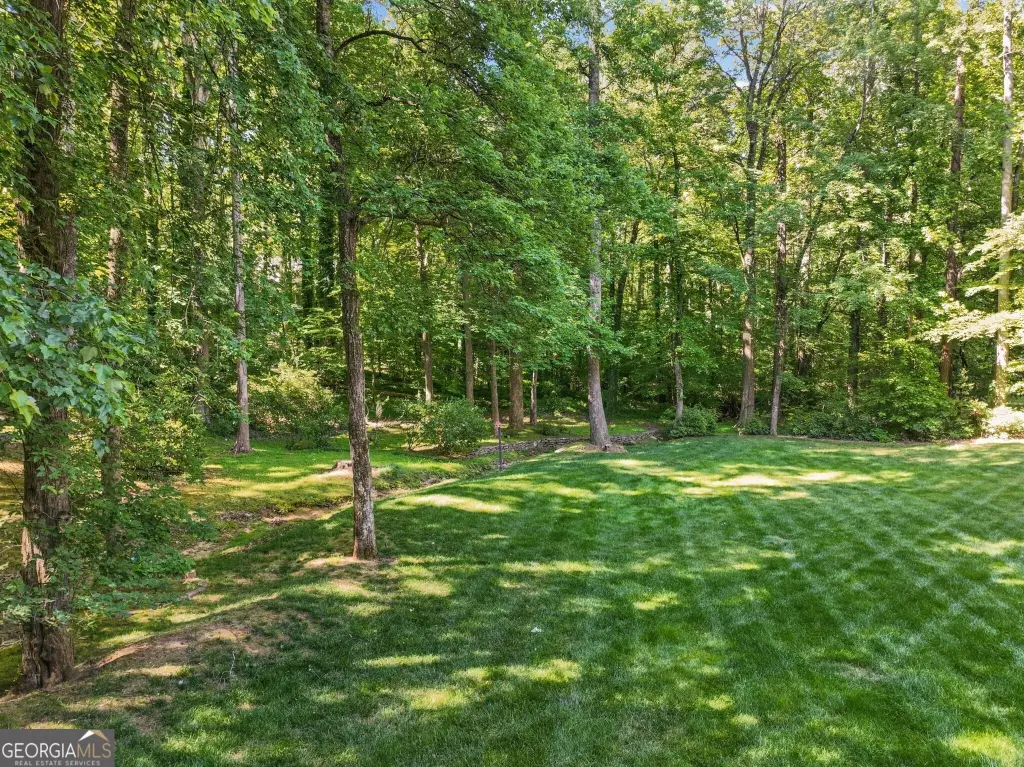
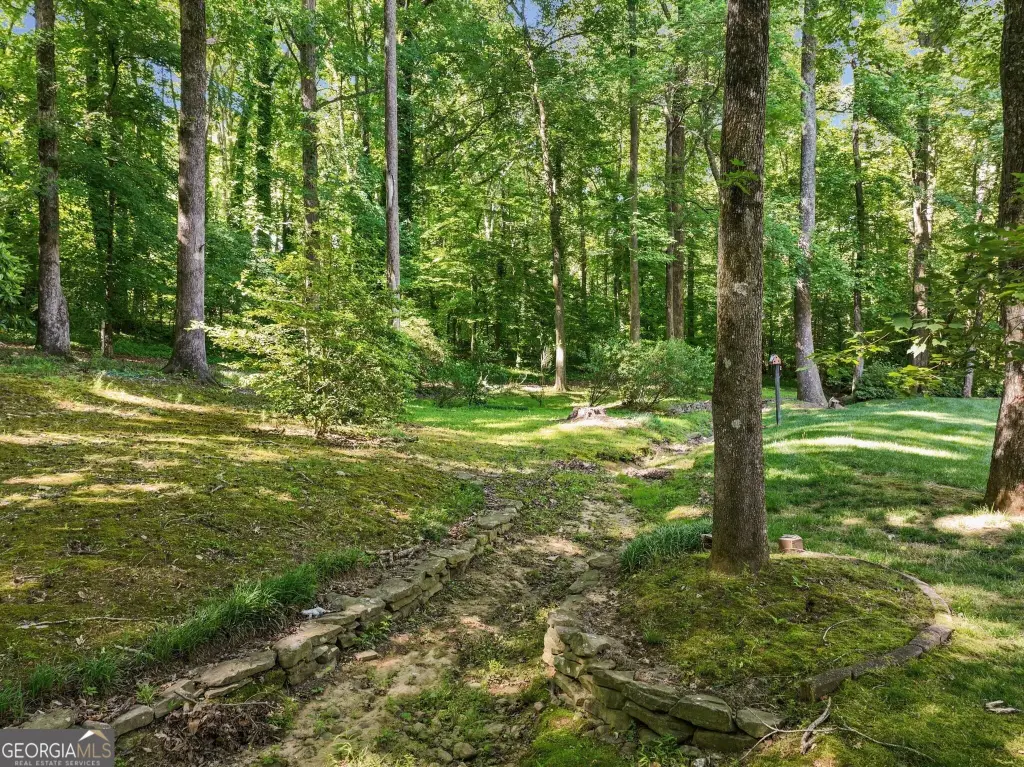
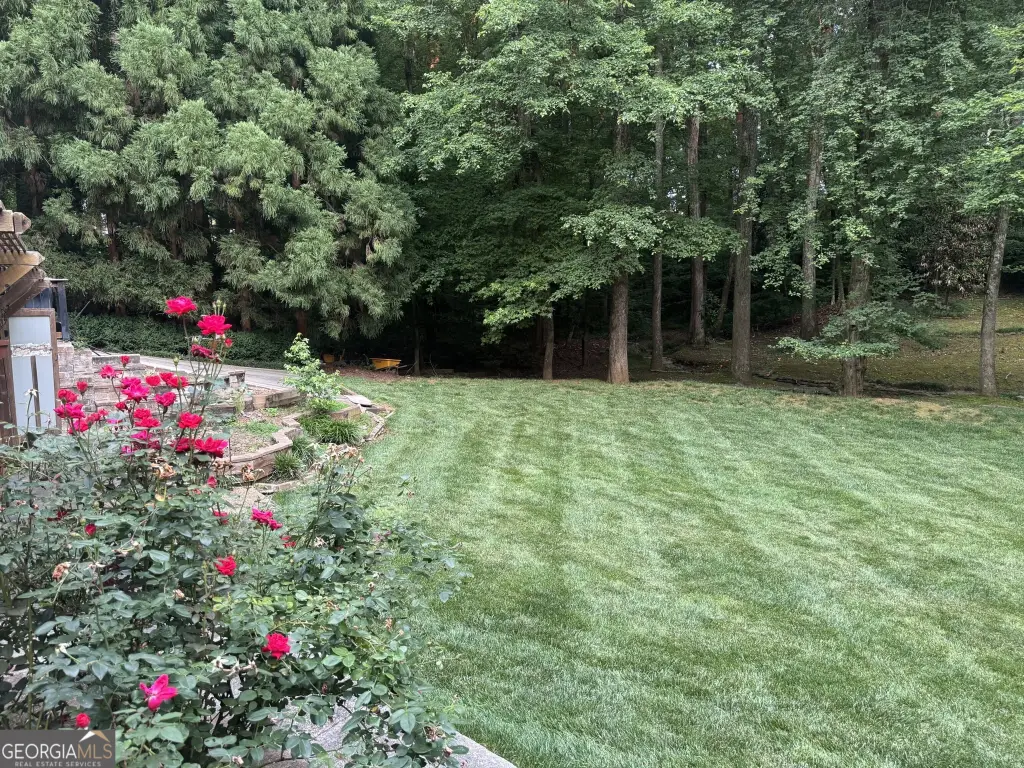
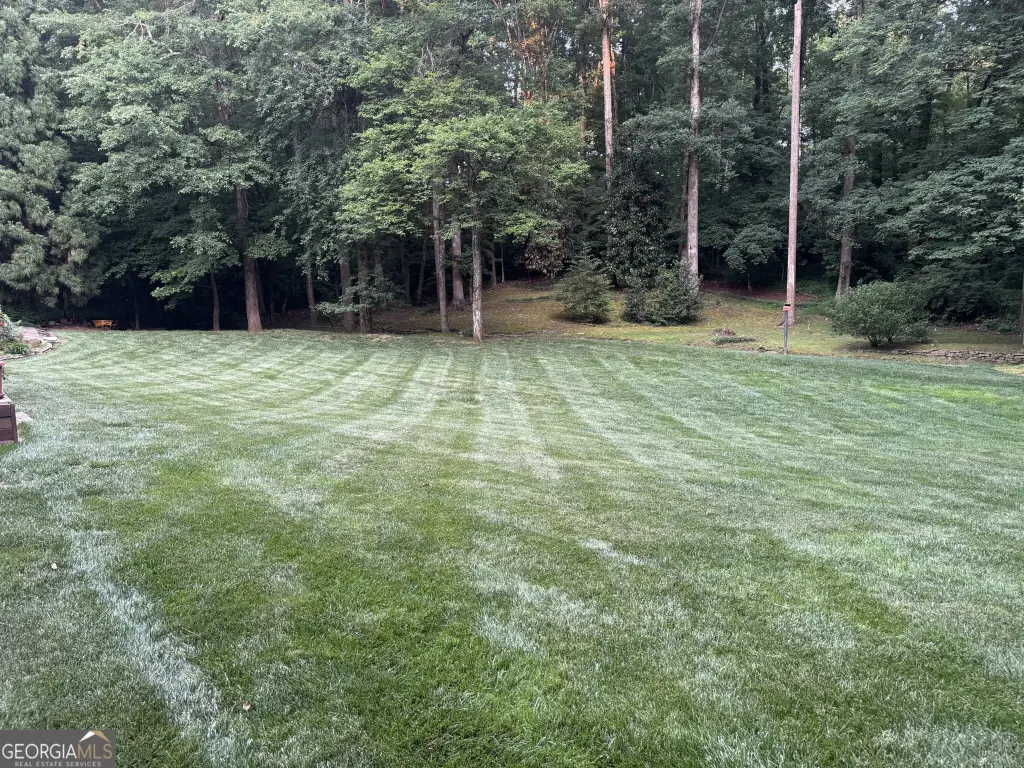
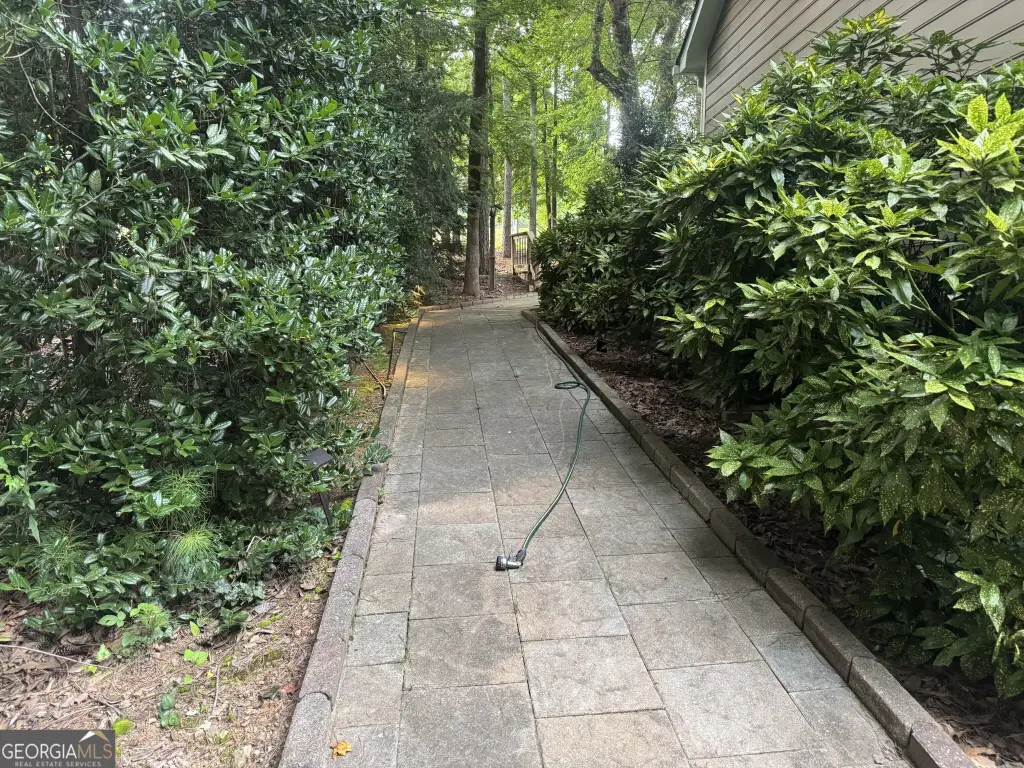
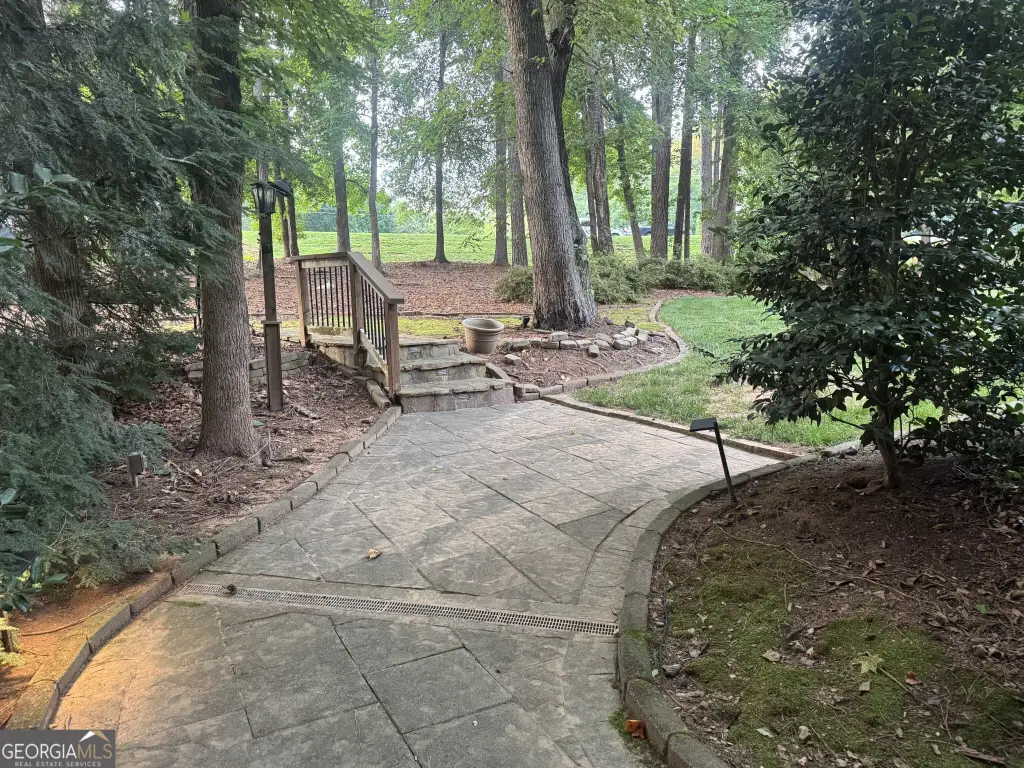
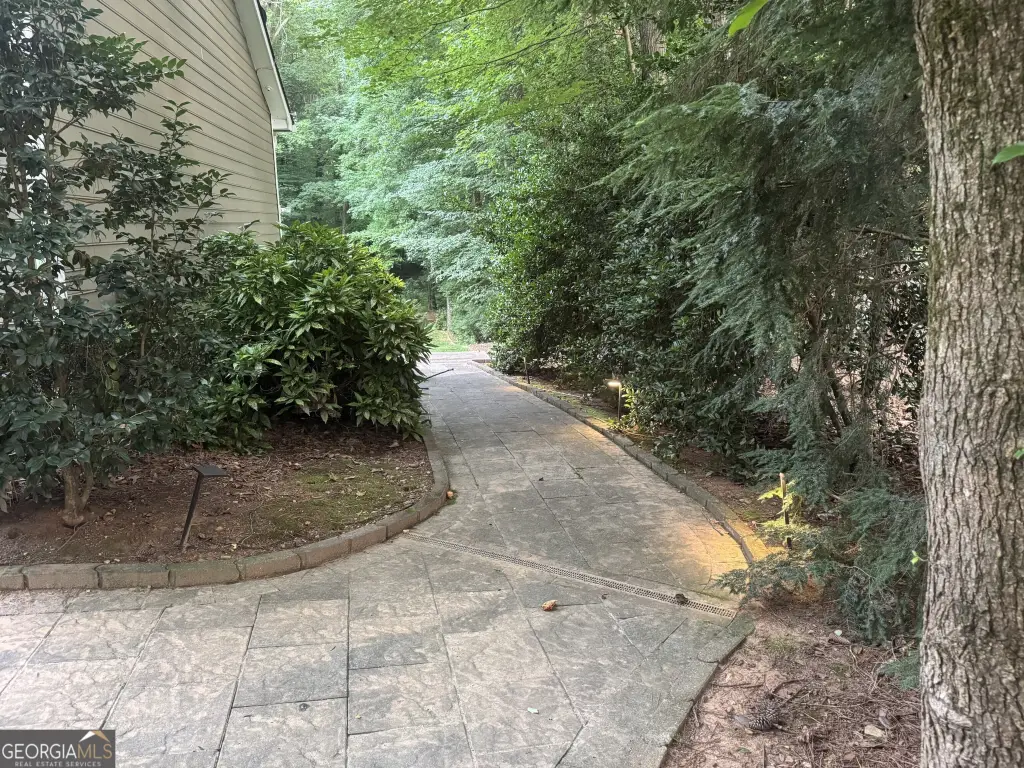
park-like setting
Building Details
Year built
1970
Flooring type
Hardwood, Tile
Building materials
Frame, Stone
Roof type
Composition
Listing Agency:
Atlanta Communities
(770) 240-2001
Listed By:
Shannon Ferreira
(404) 759-9949
Added: Jun 19
Changed: Sep 13
Last Checked: Oct 5 at 5:06PM
MLS# 10794980
Copyright © 2026 Georgia Multiple Listing Service. All rights reserved. All information provided by the listing agent/broker is deemed reliable but is not guaranteed and should be independently verified.
Investment Insights
Based on property information with market context.
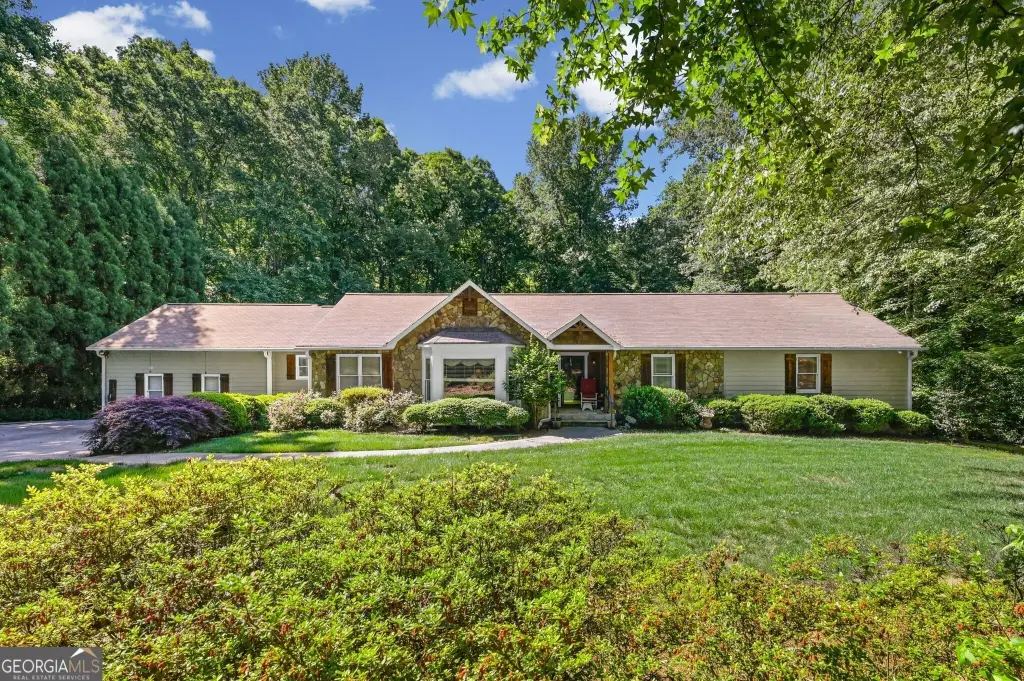
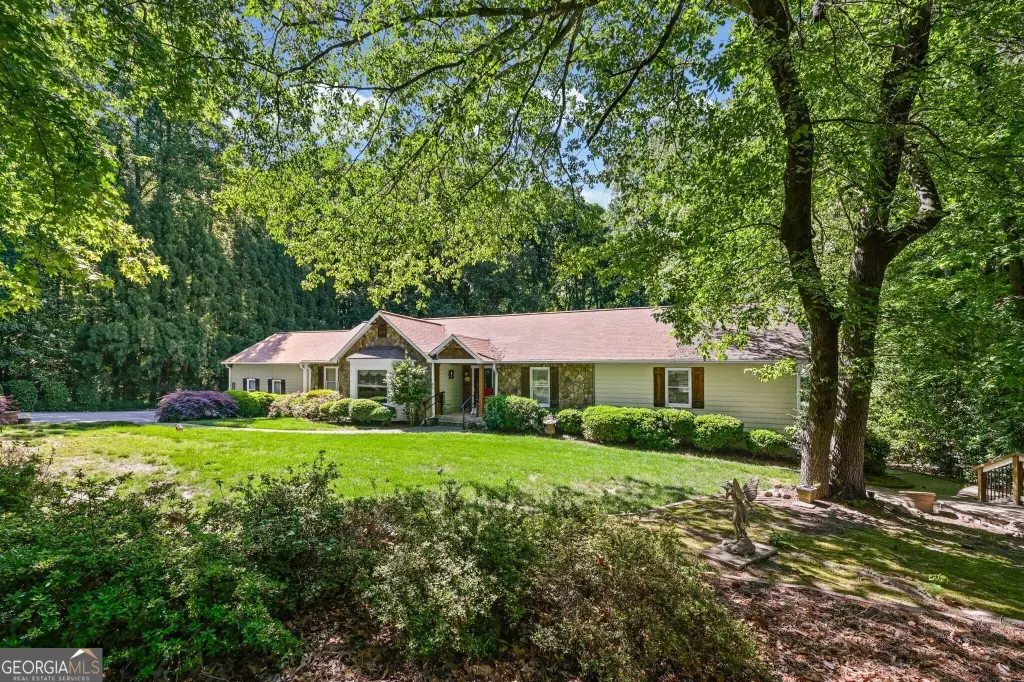
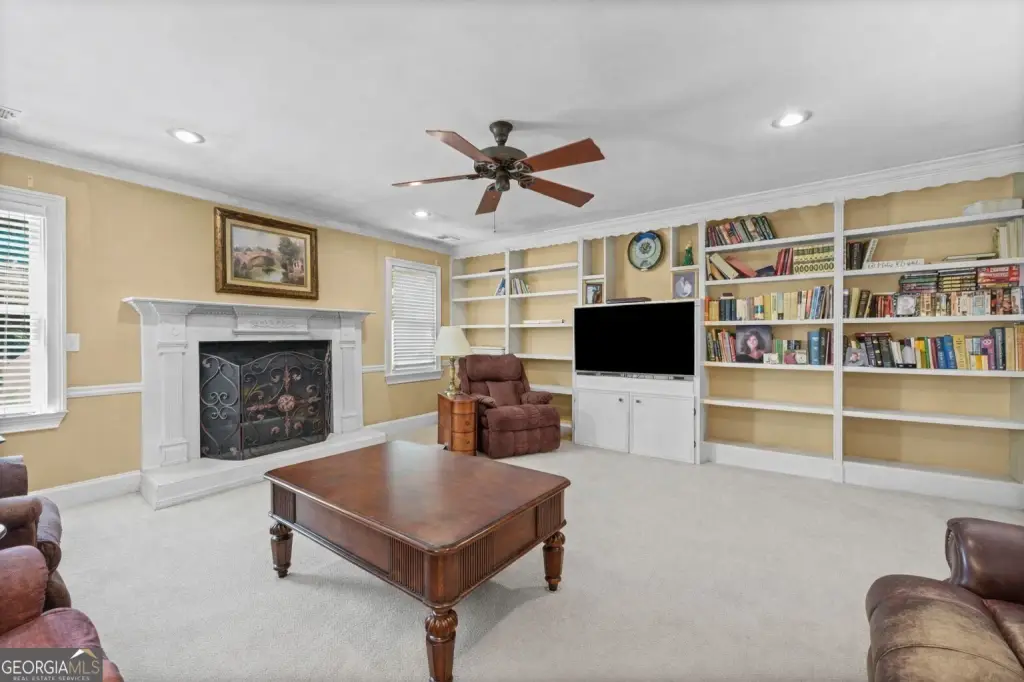
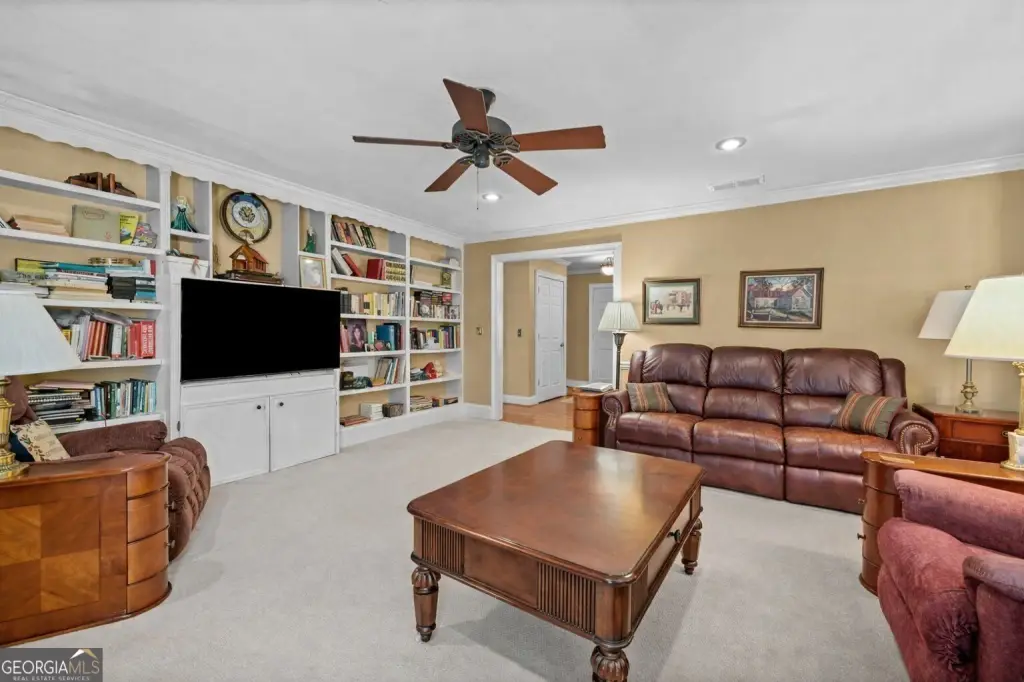
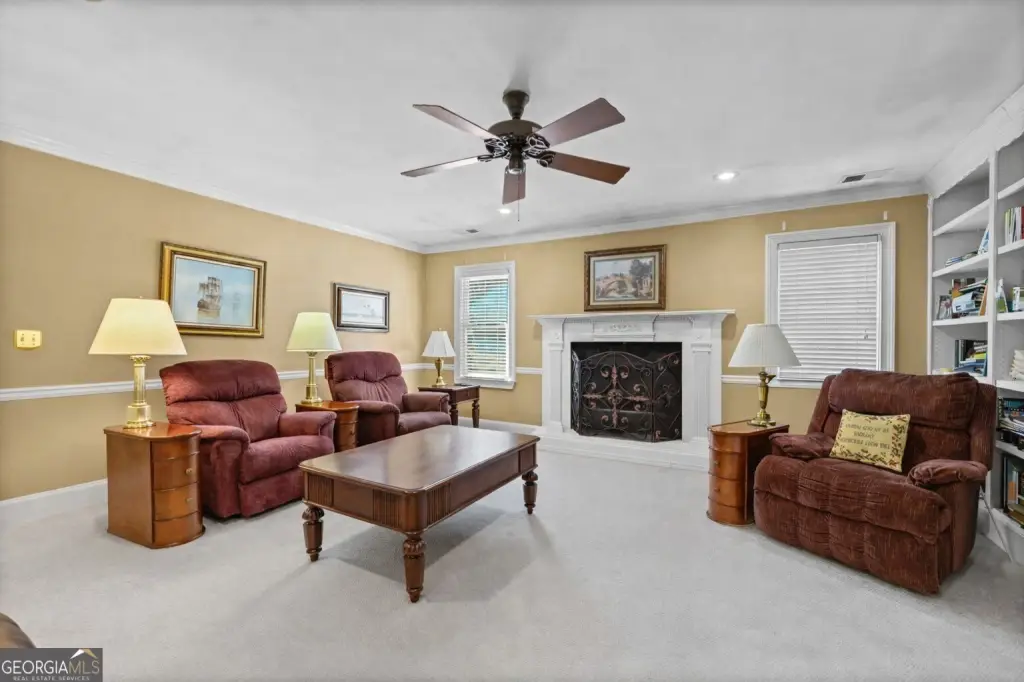
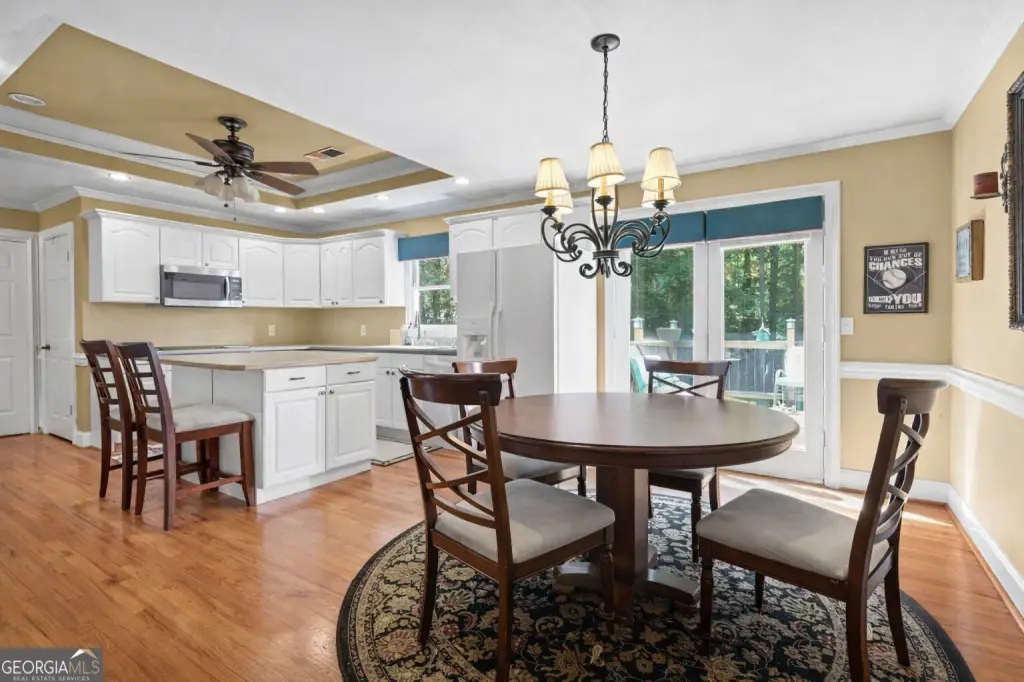
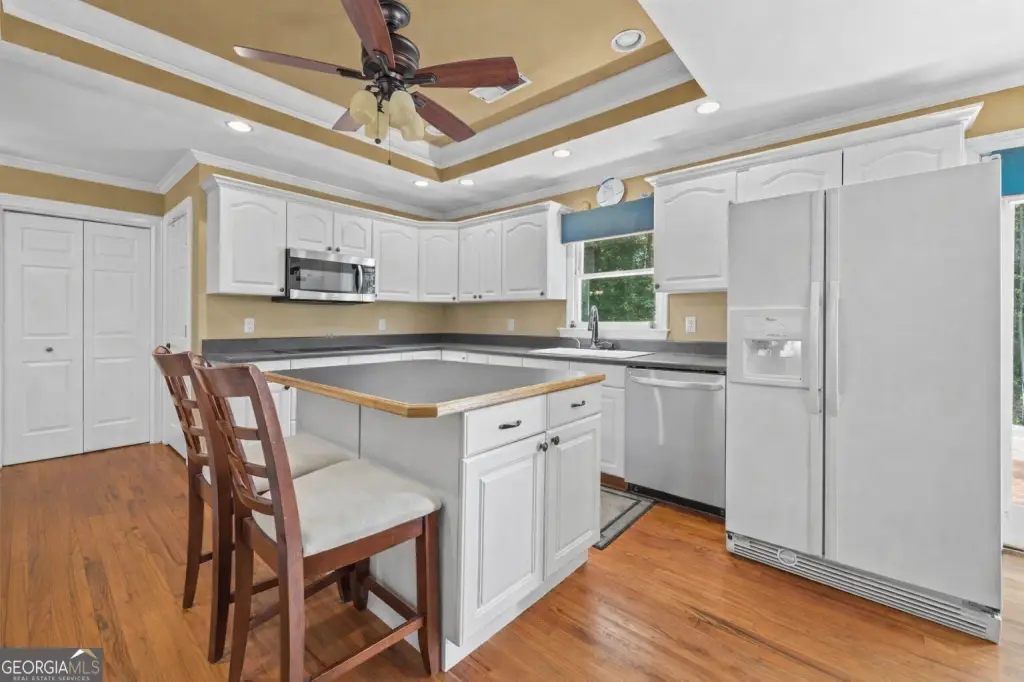
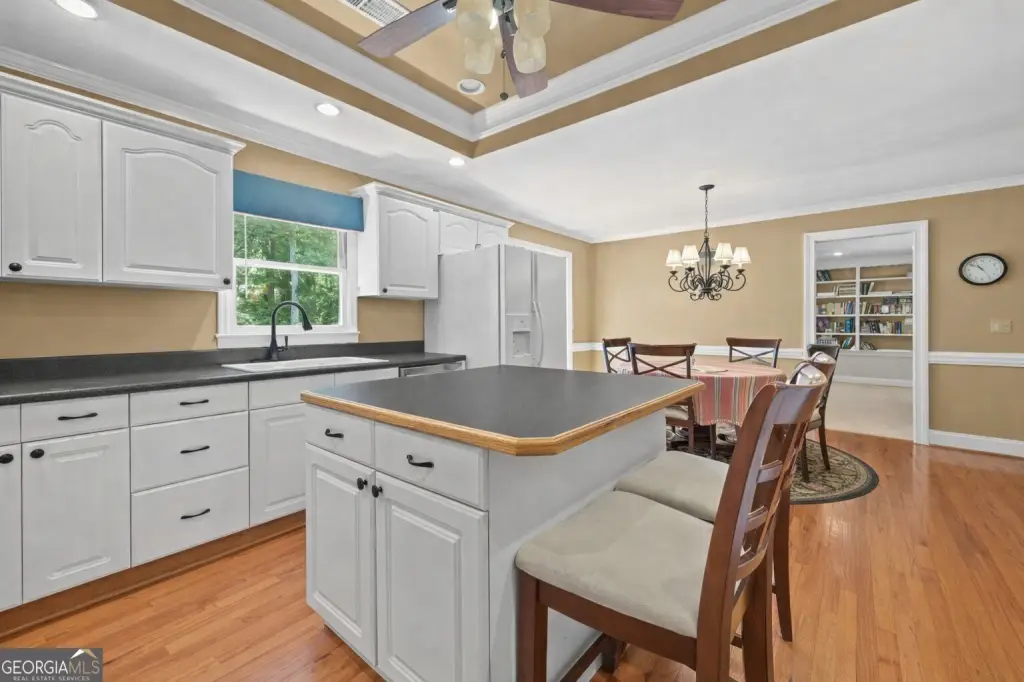
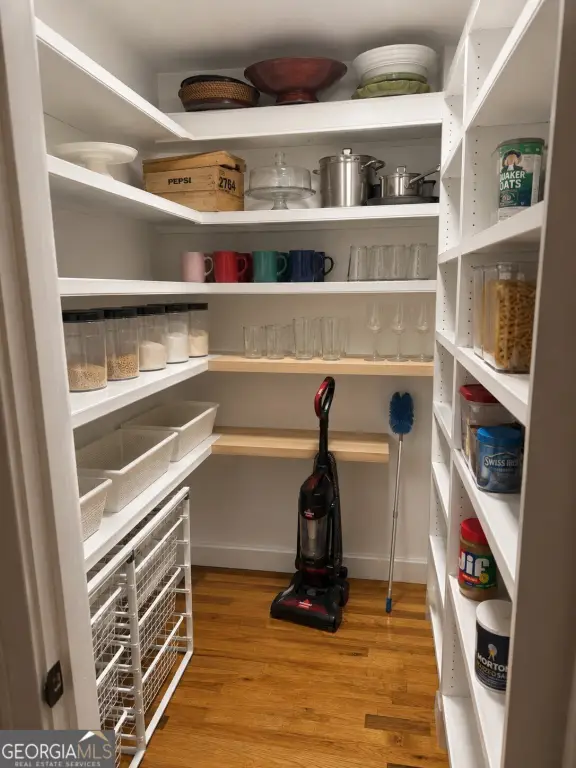
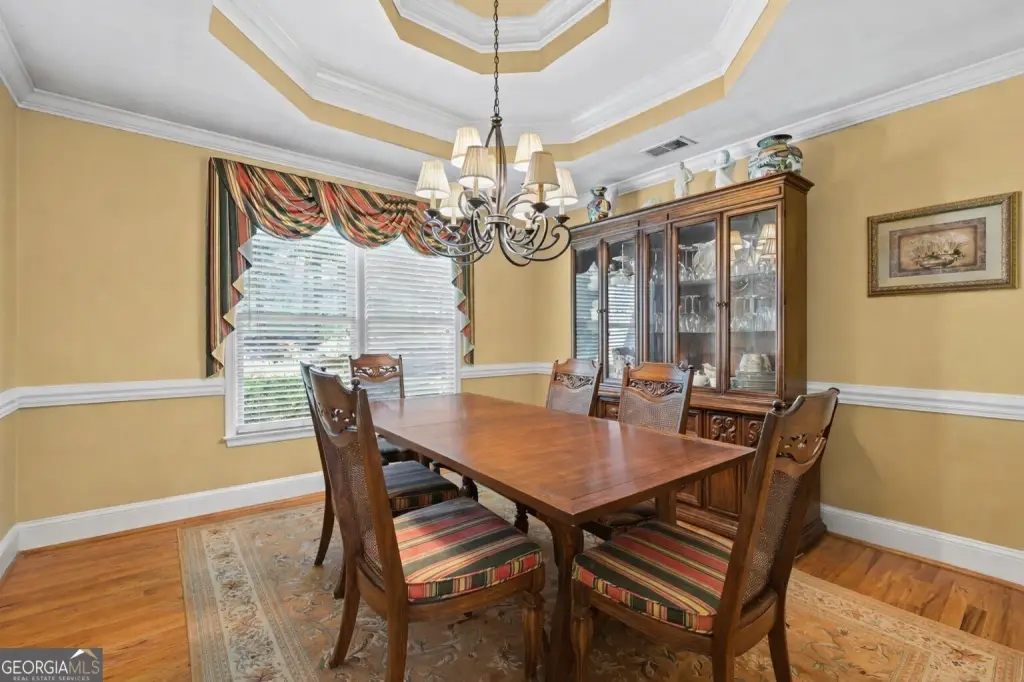
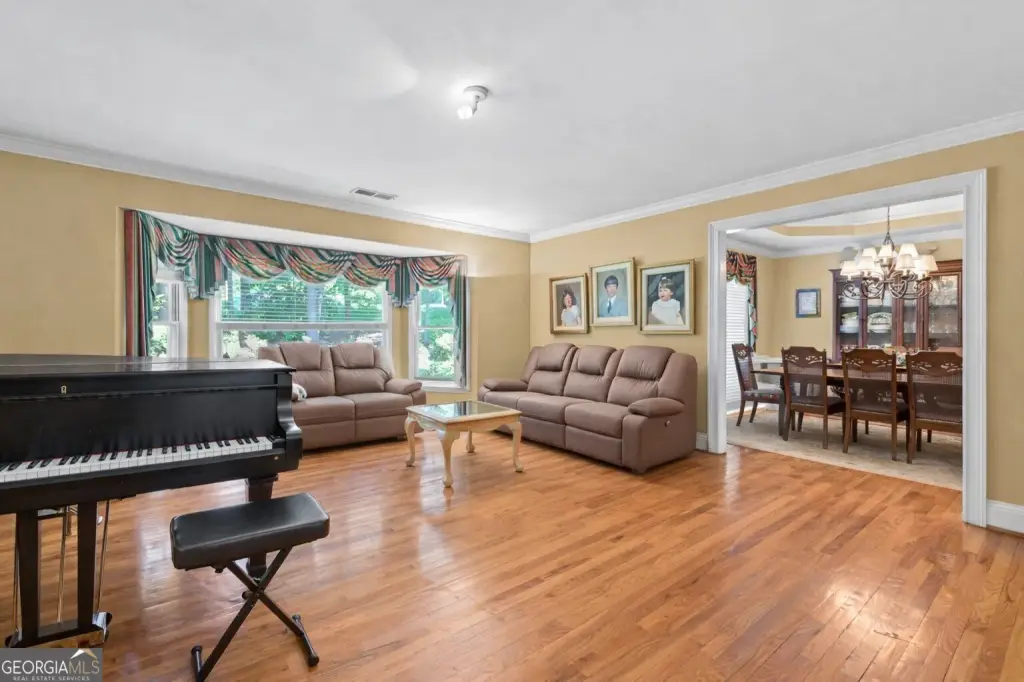
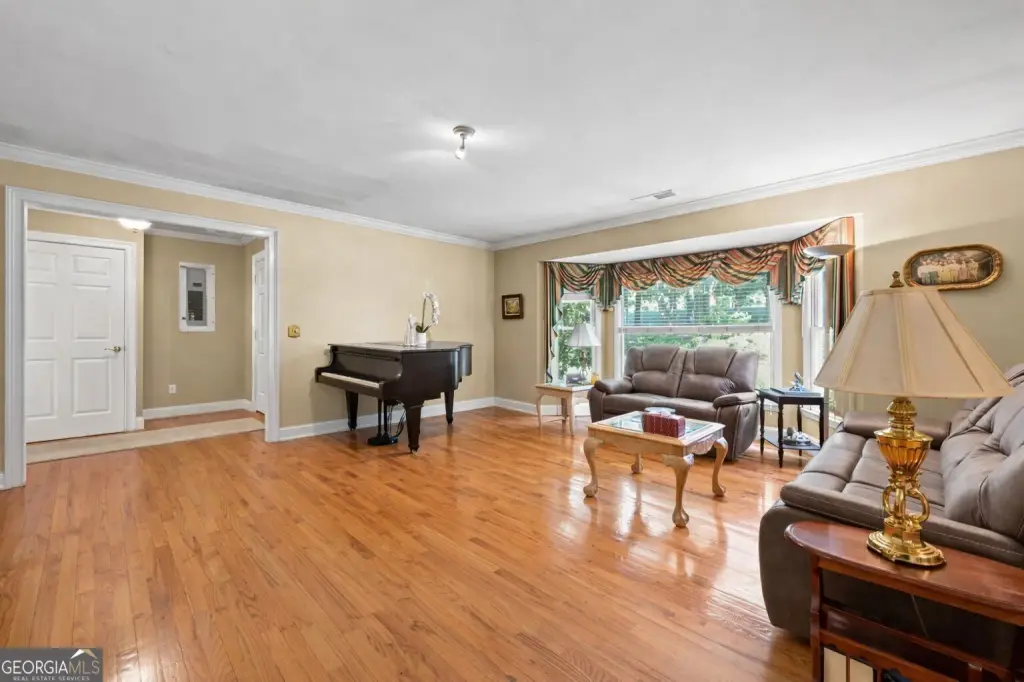
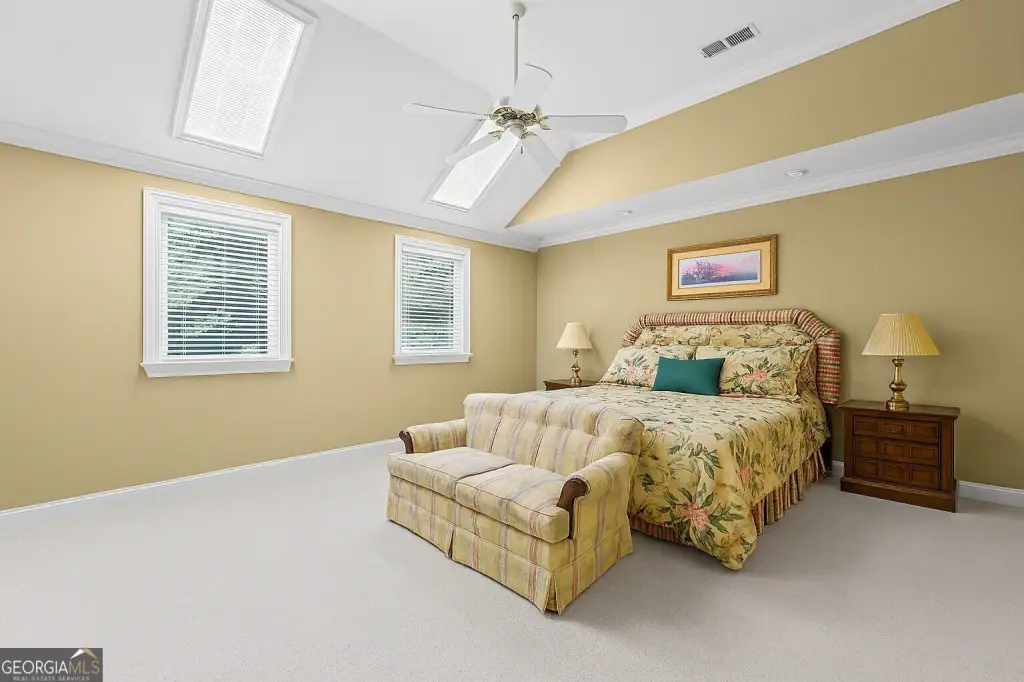
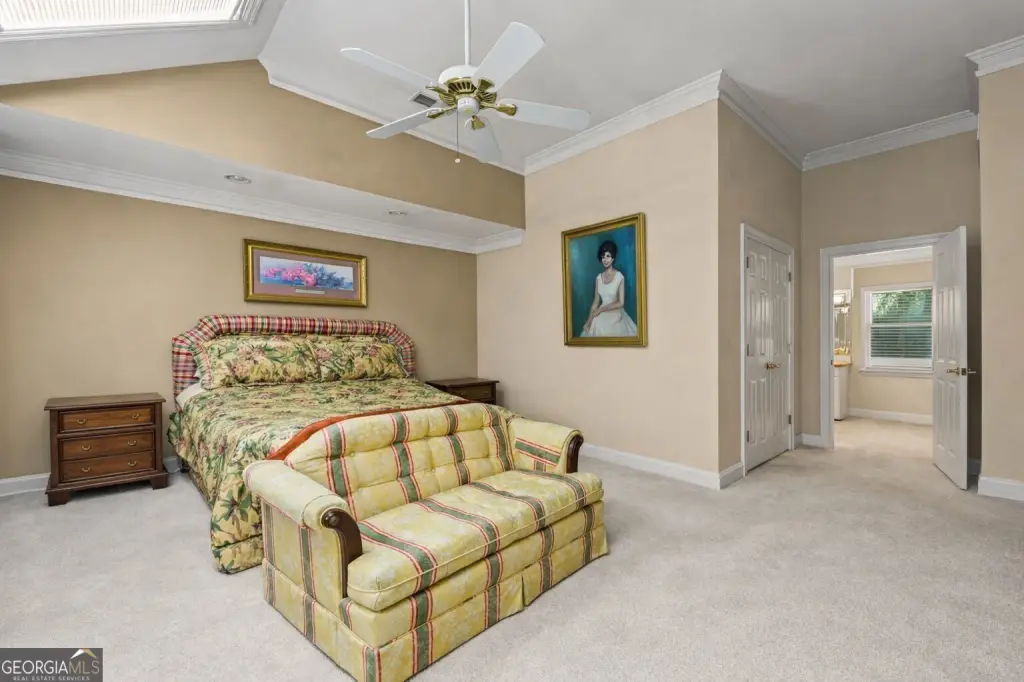
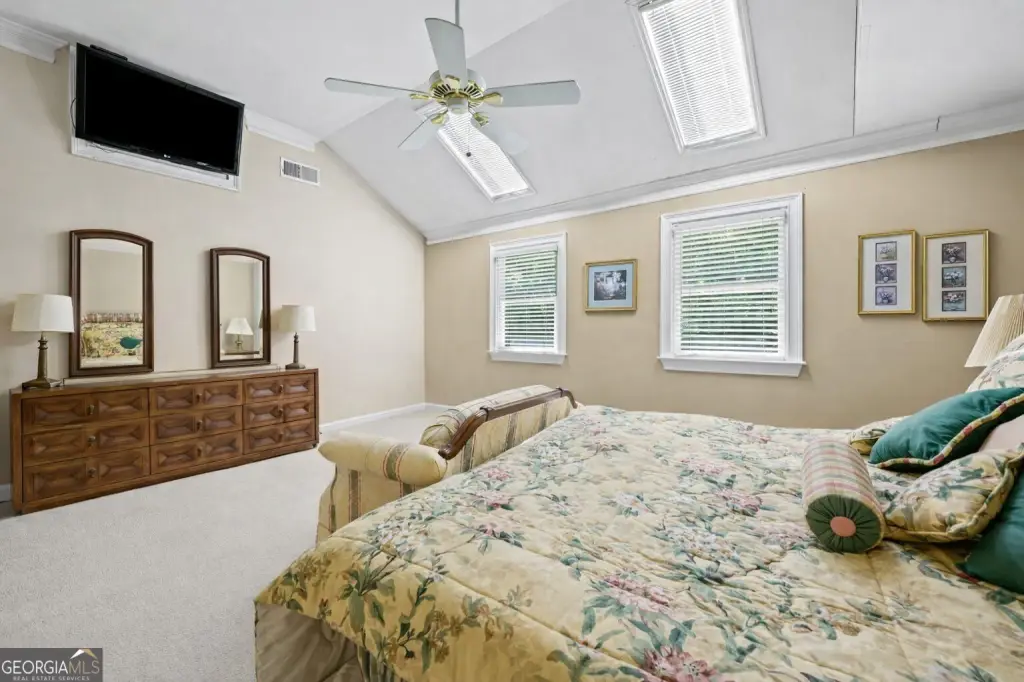
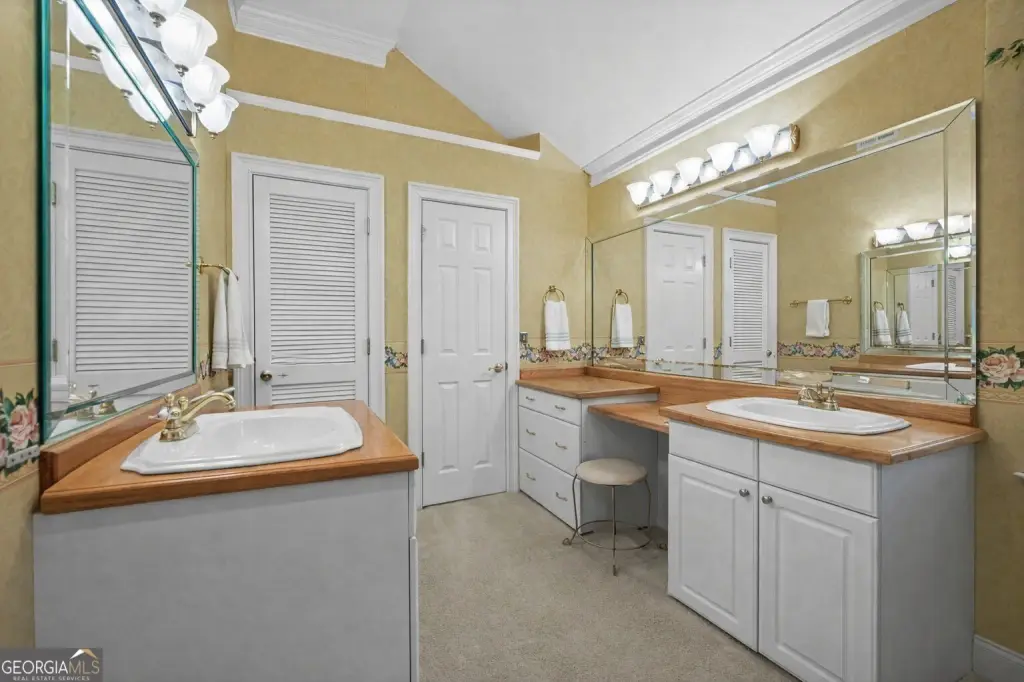
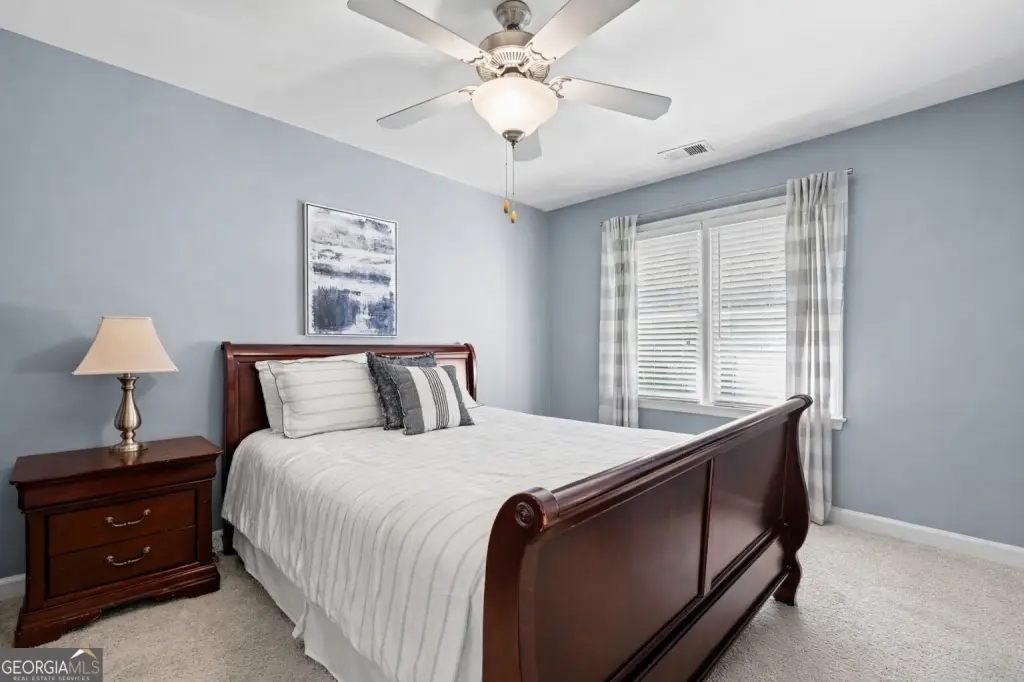
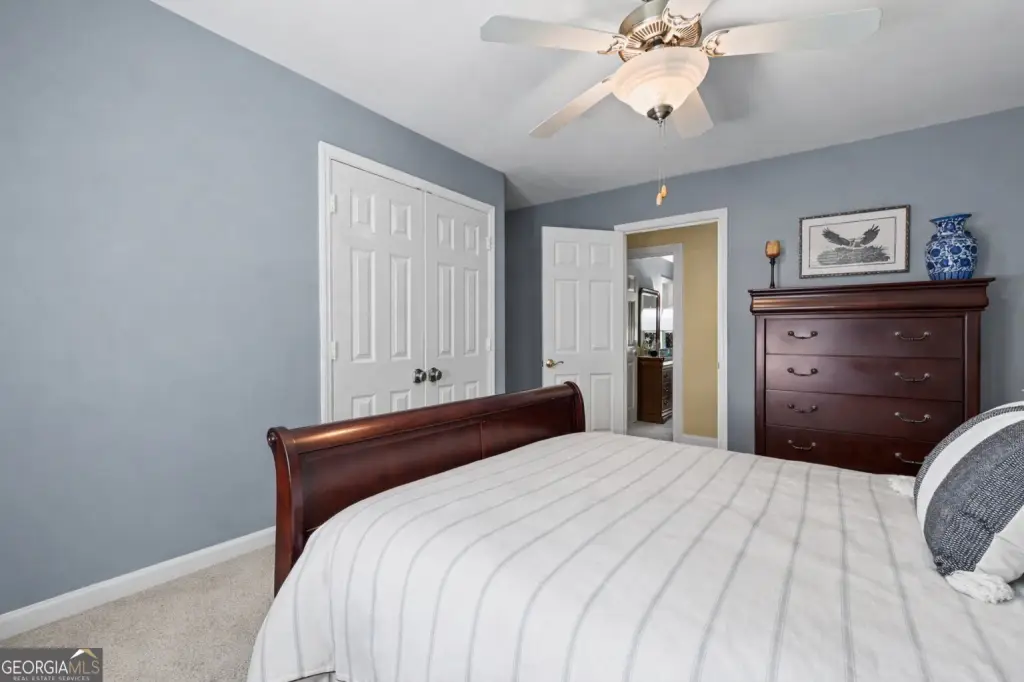
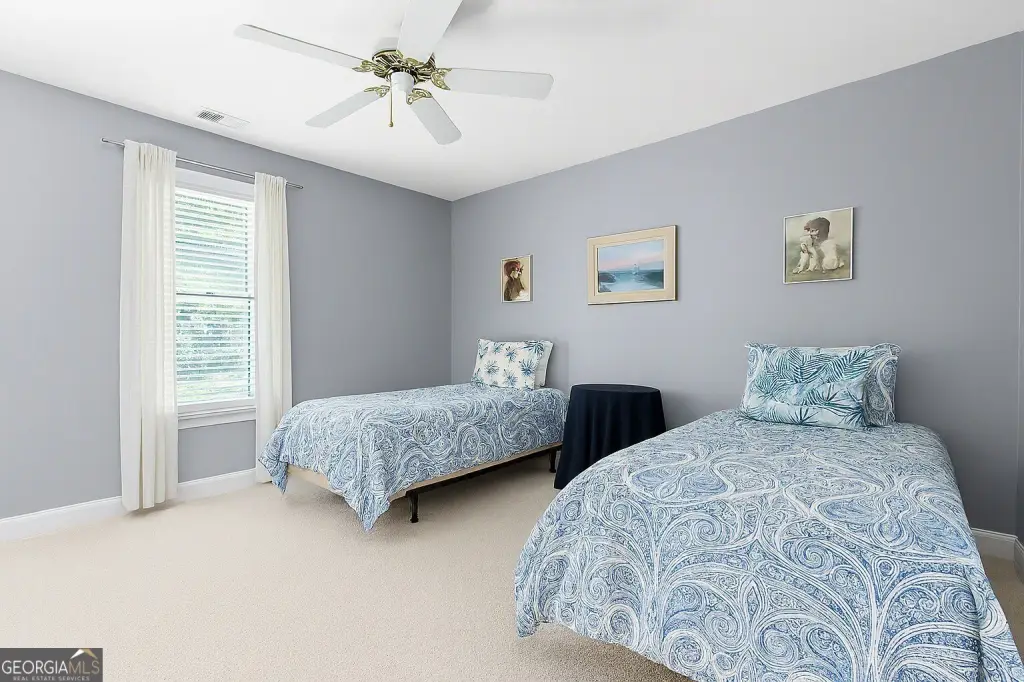
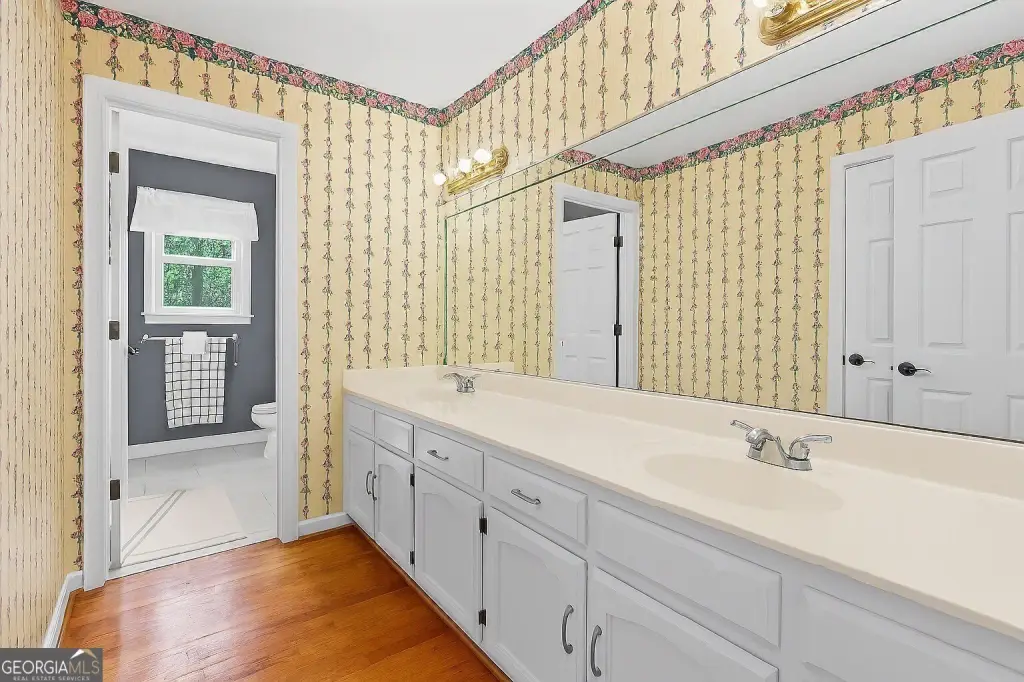
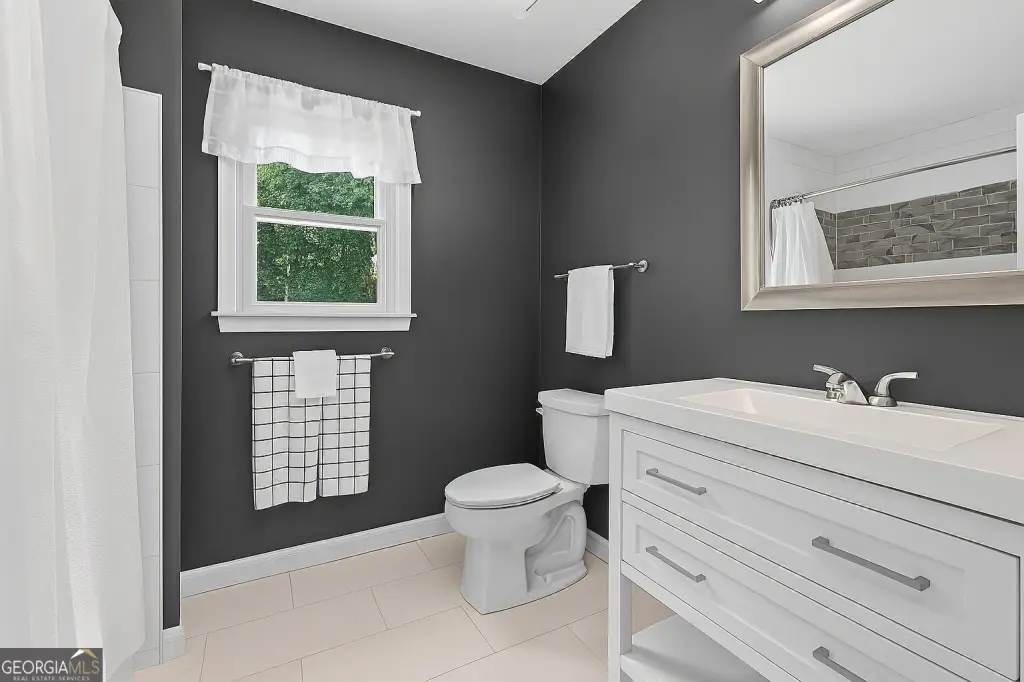
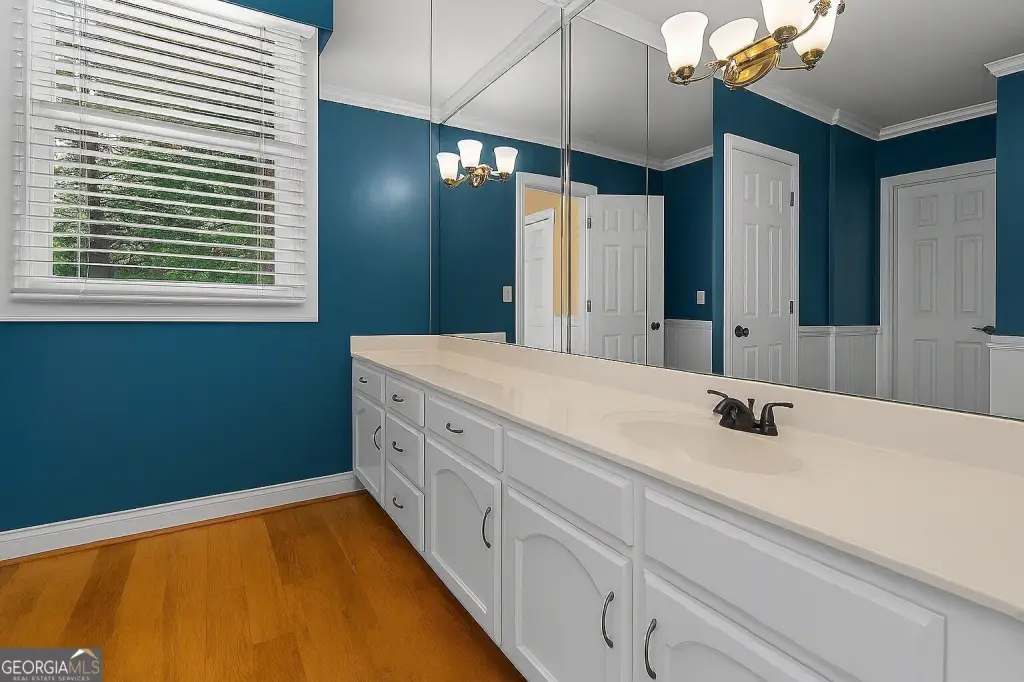
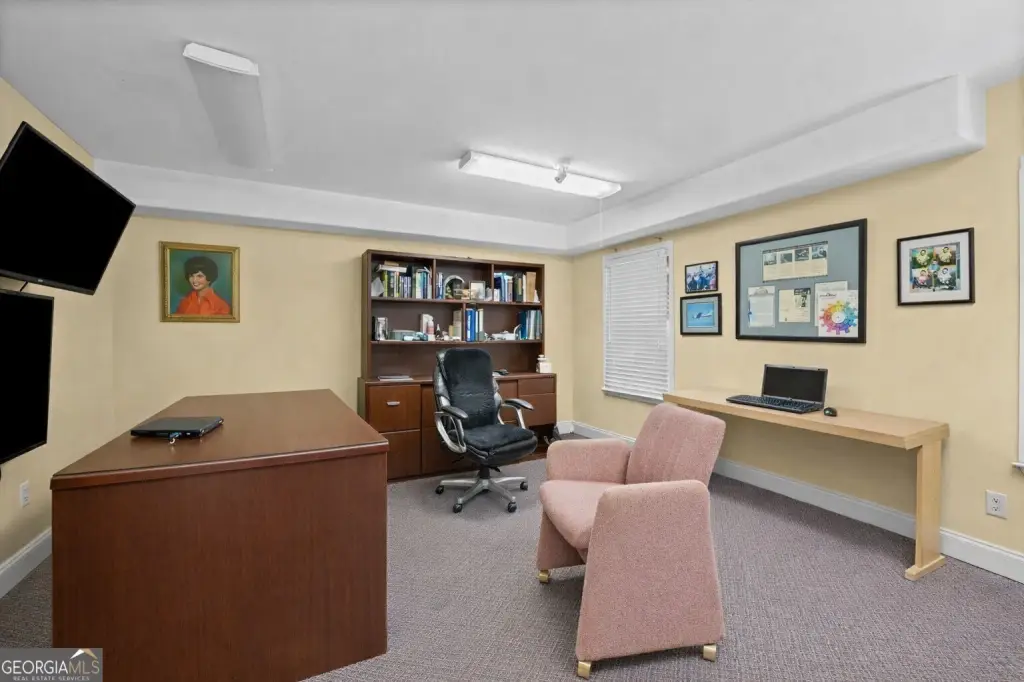
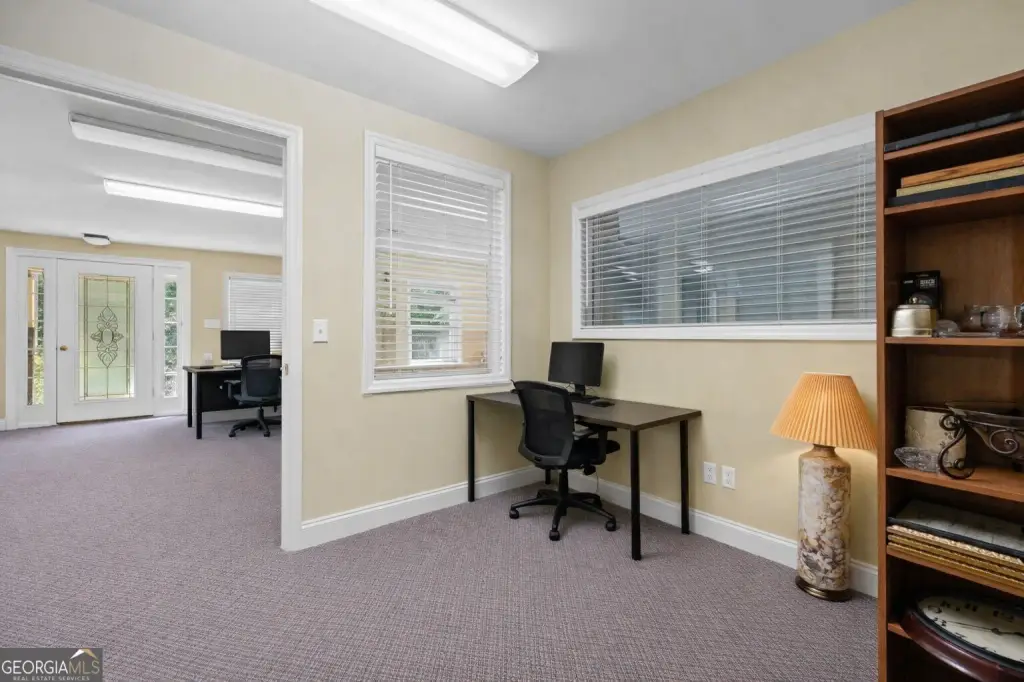
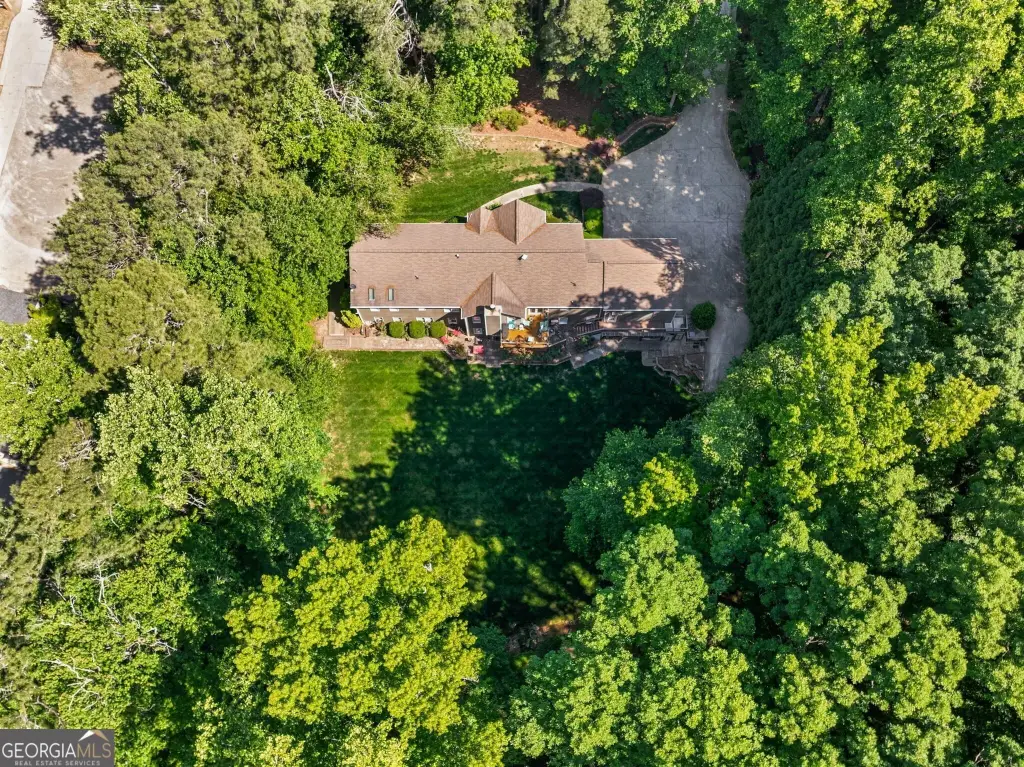
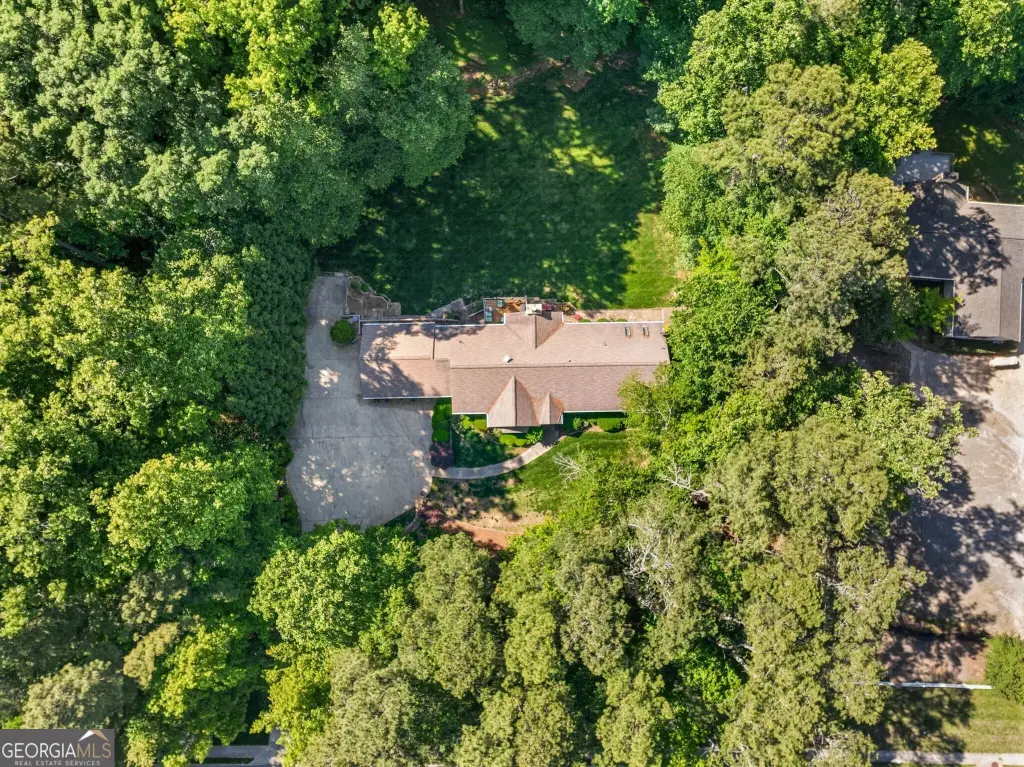
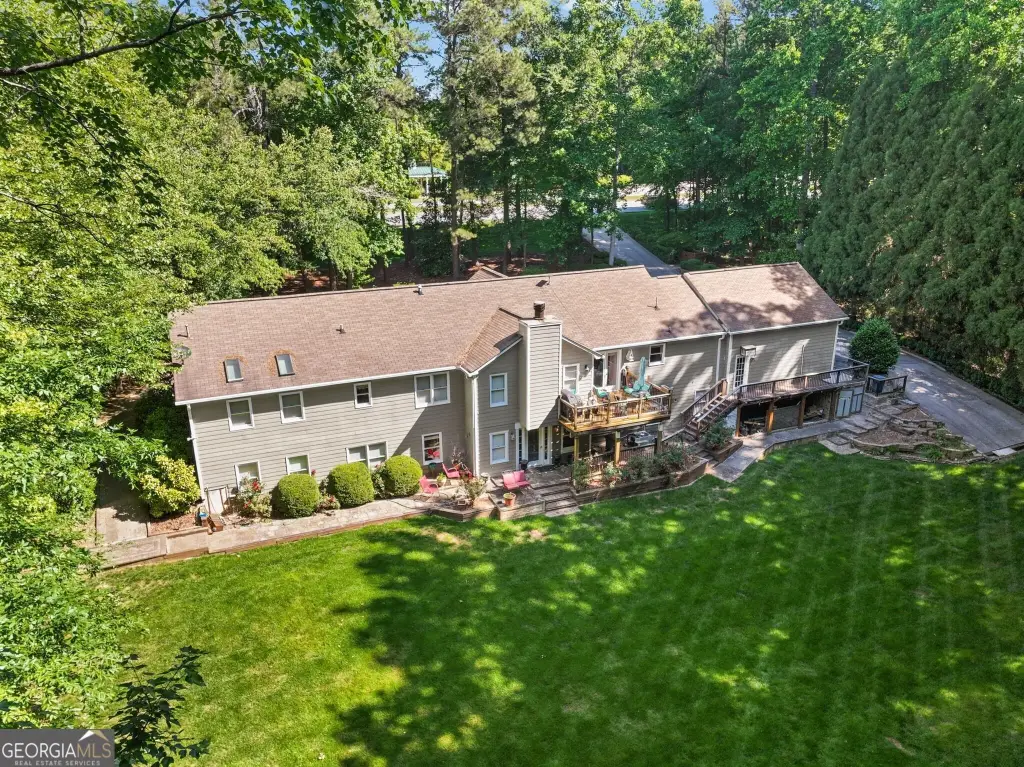
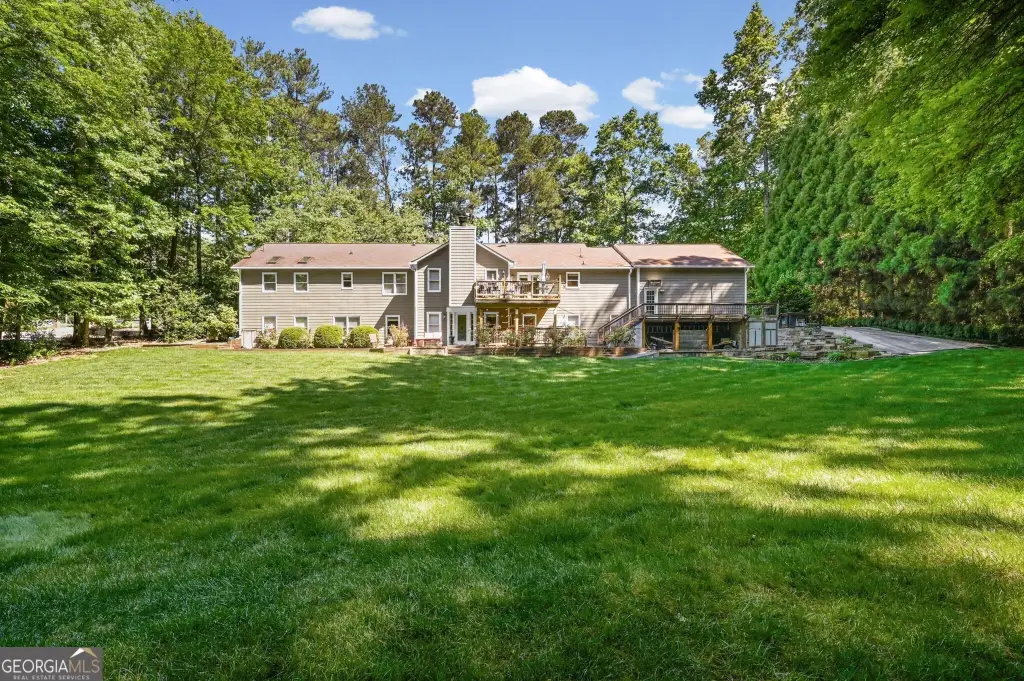
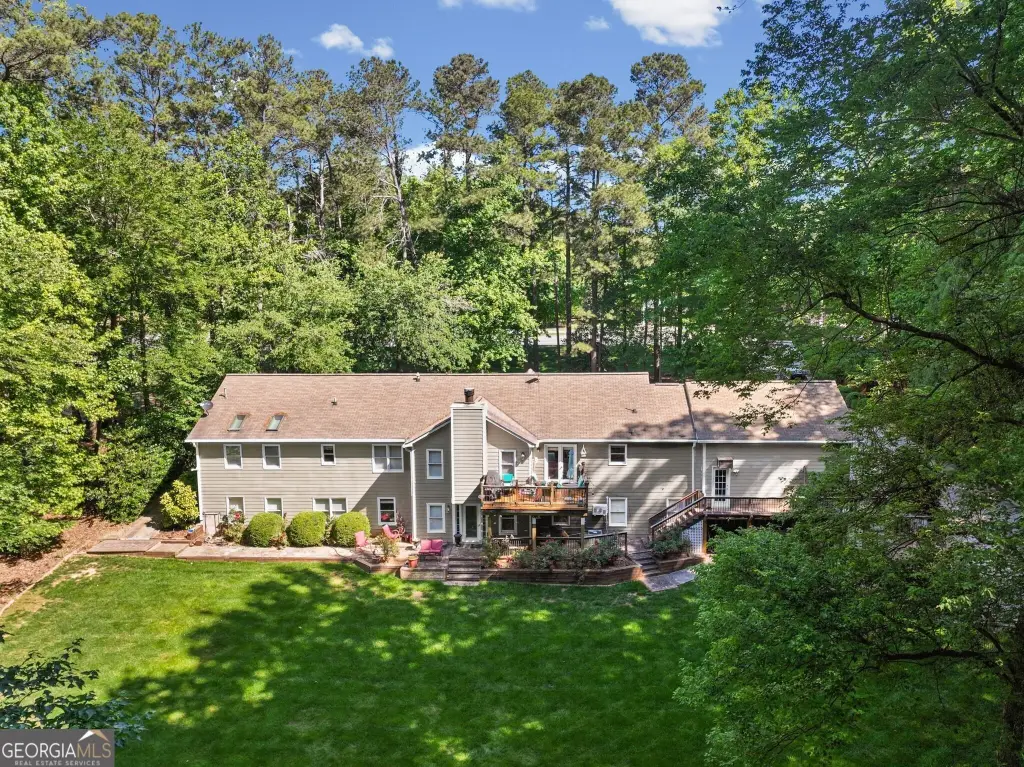
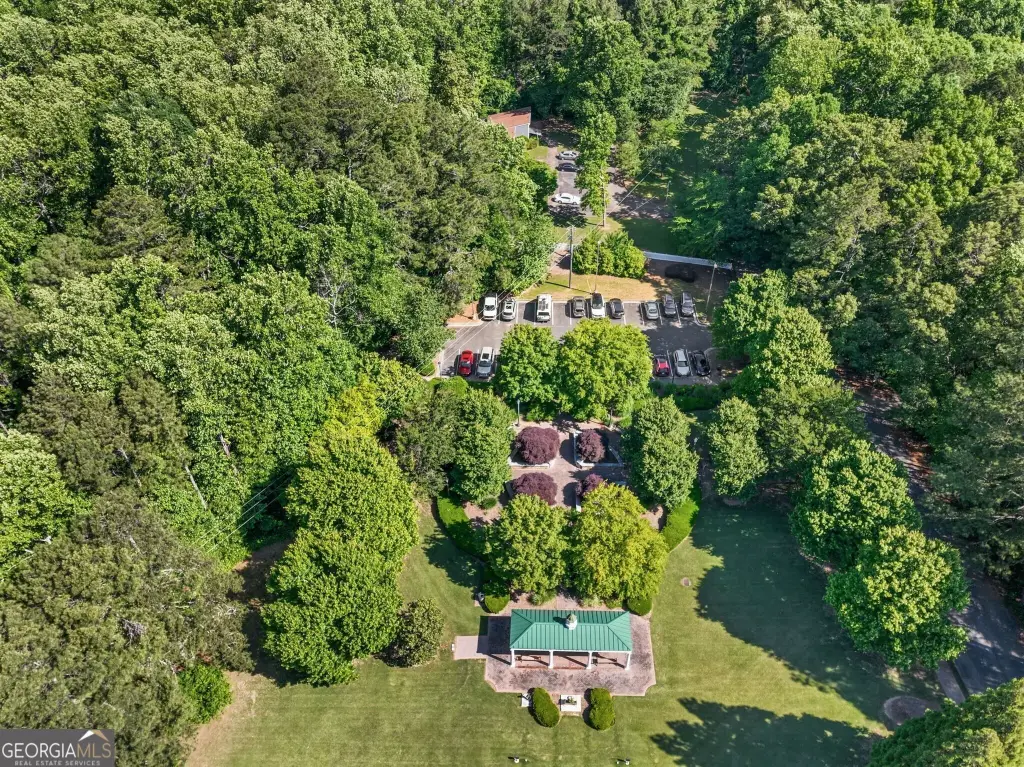
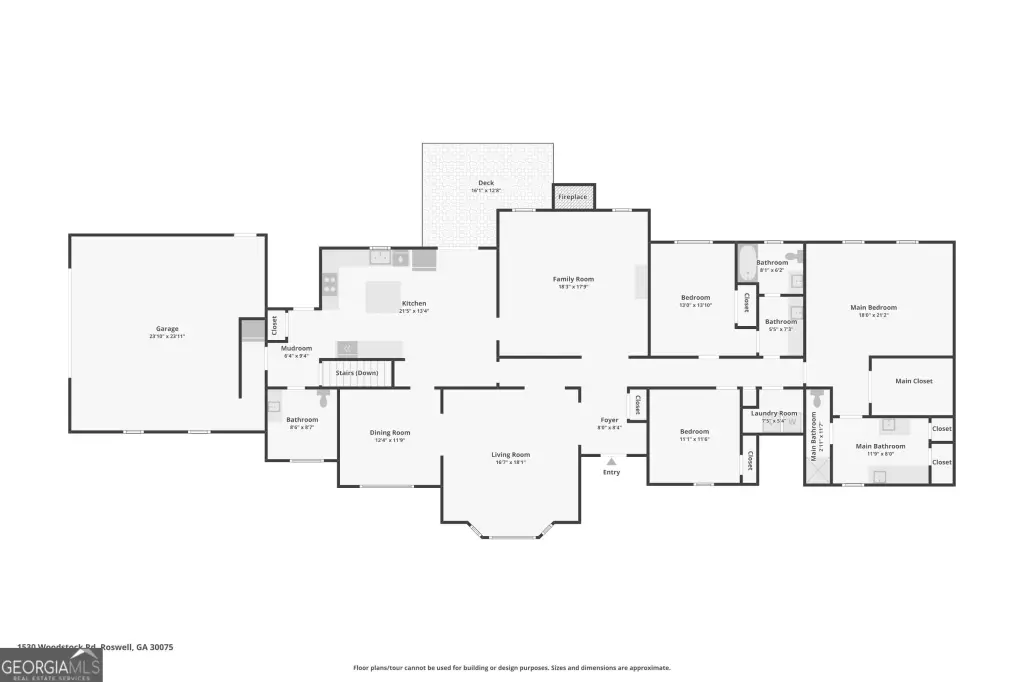
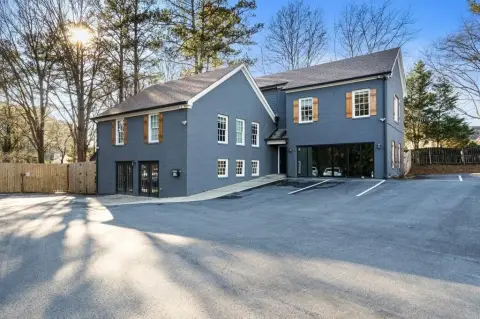
Located at 1530 Woodstock Road in Roswell, this 5,126-square-foot office property sits on 1.032 acres directly across from Leita Thompson Park. The 1970 building includes a polished main level with hardwood flooring, a reception area, multiple offices or conference rooms, built-in bookcases, and a substantial break room with a center island, double ovens, and pantry storage.
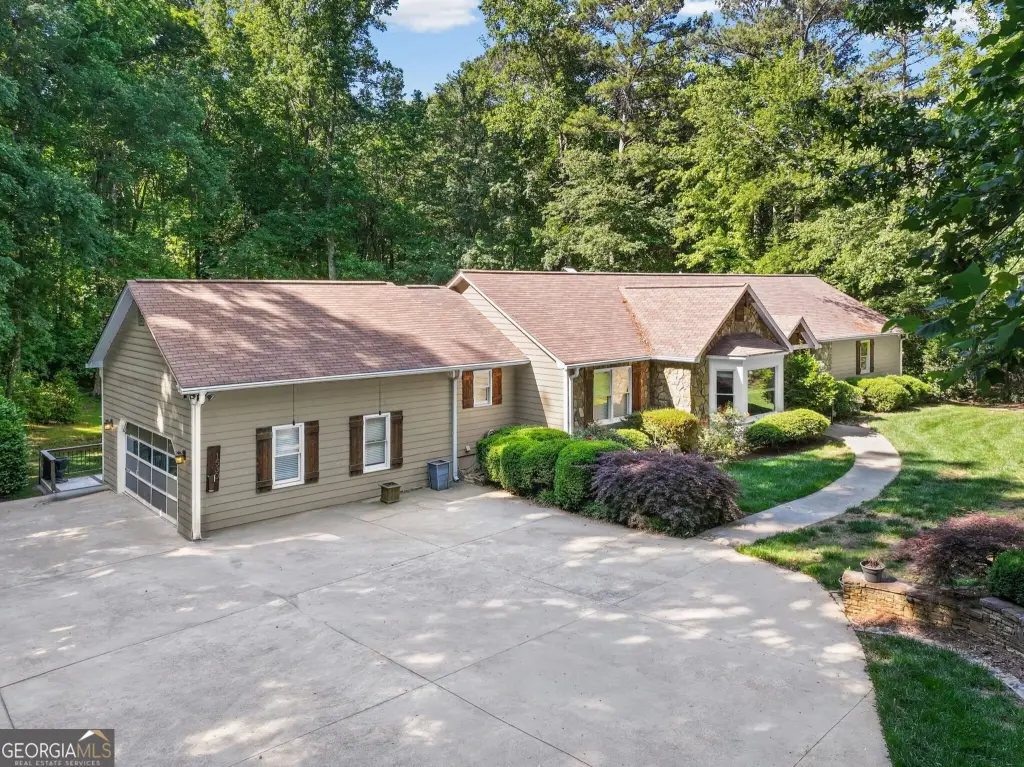
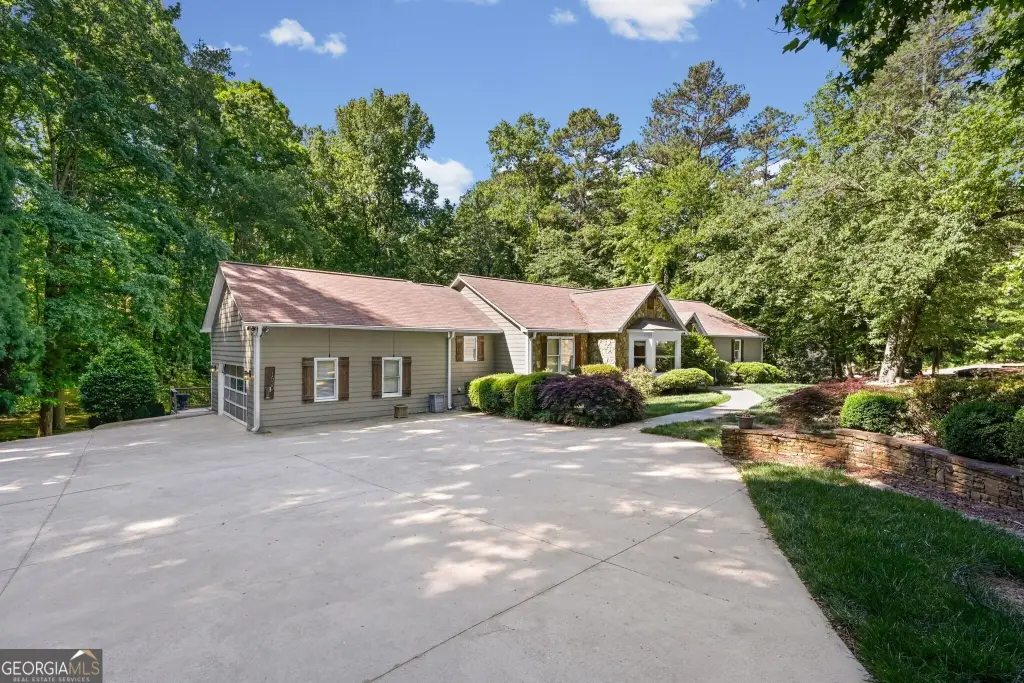
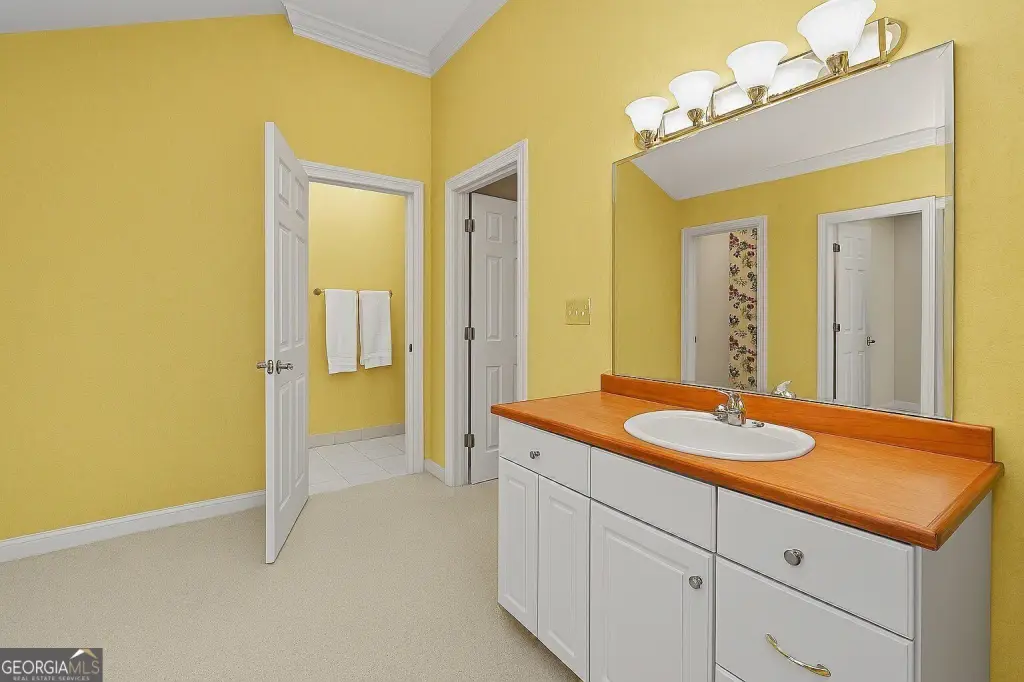
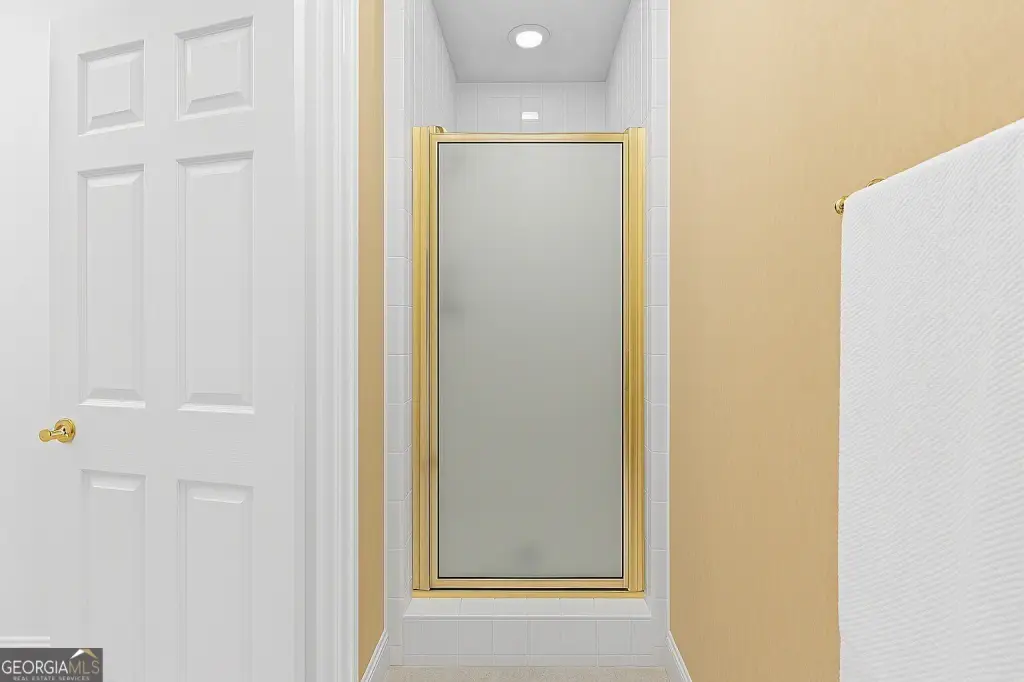
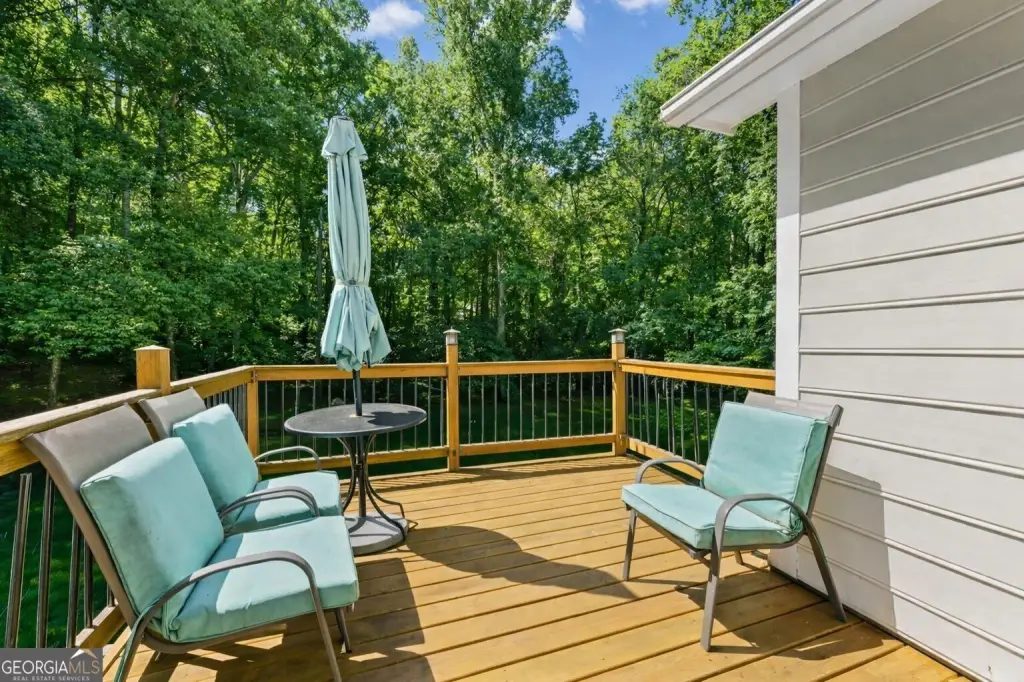
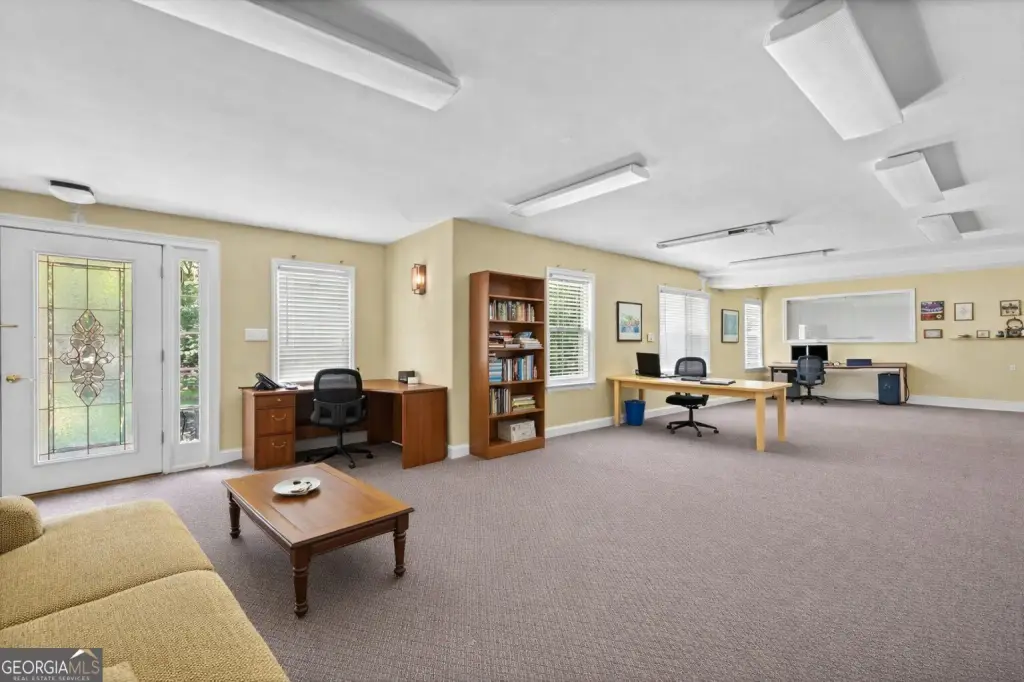
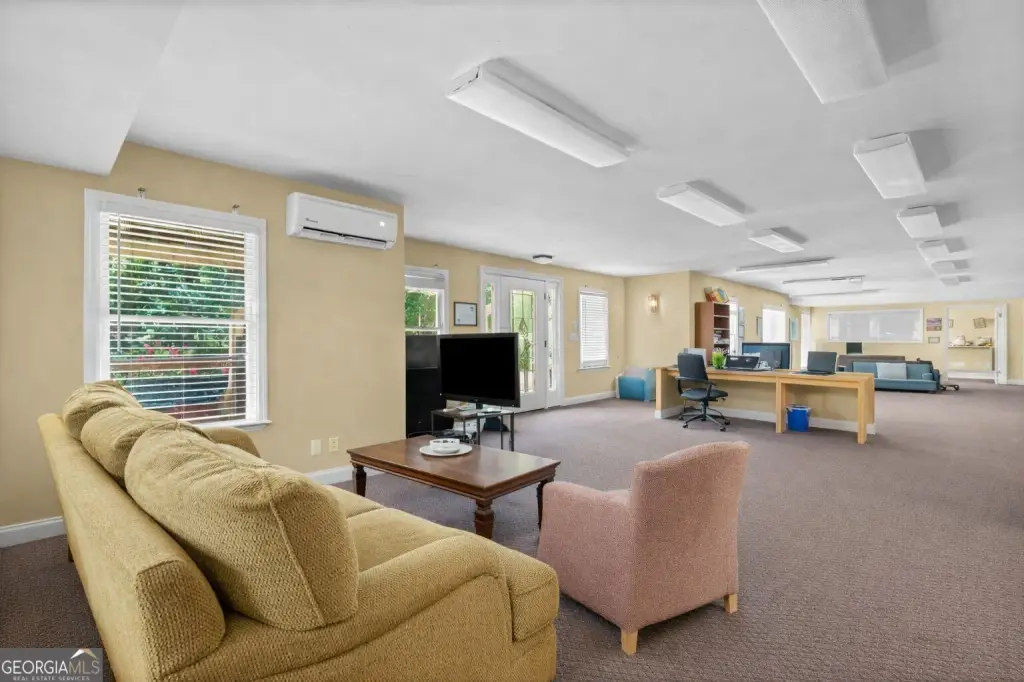
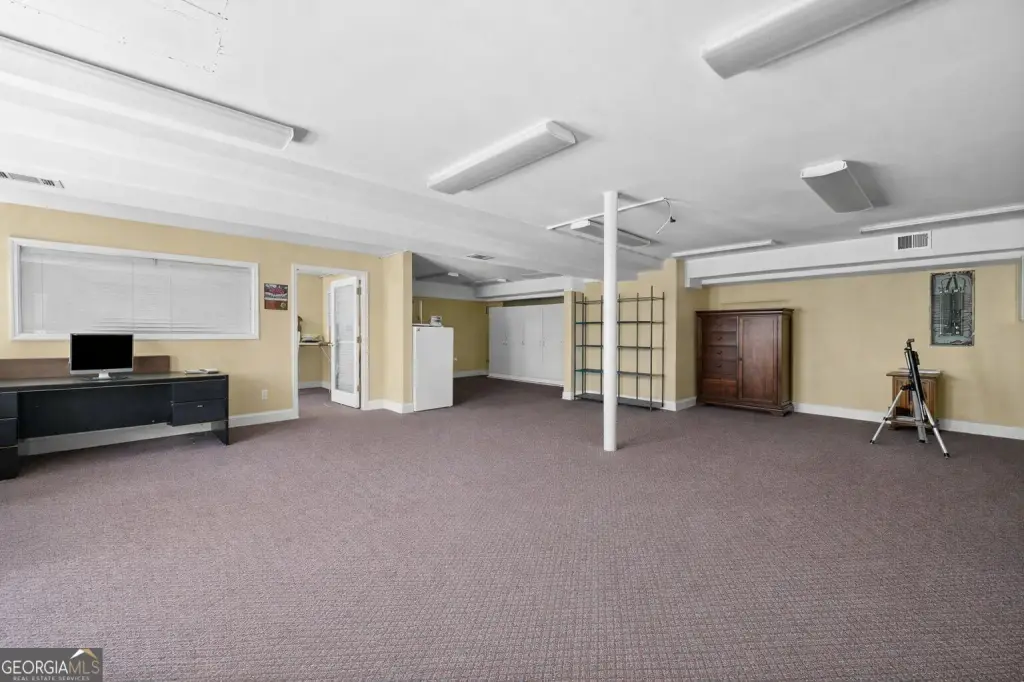
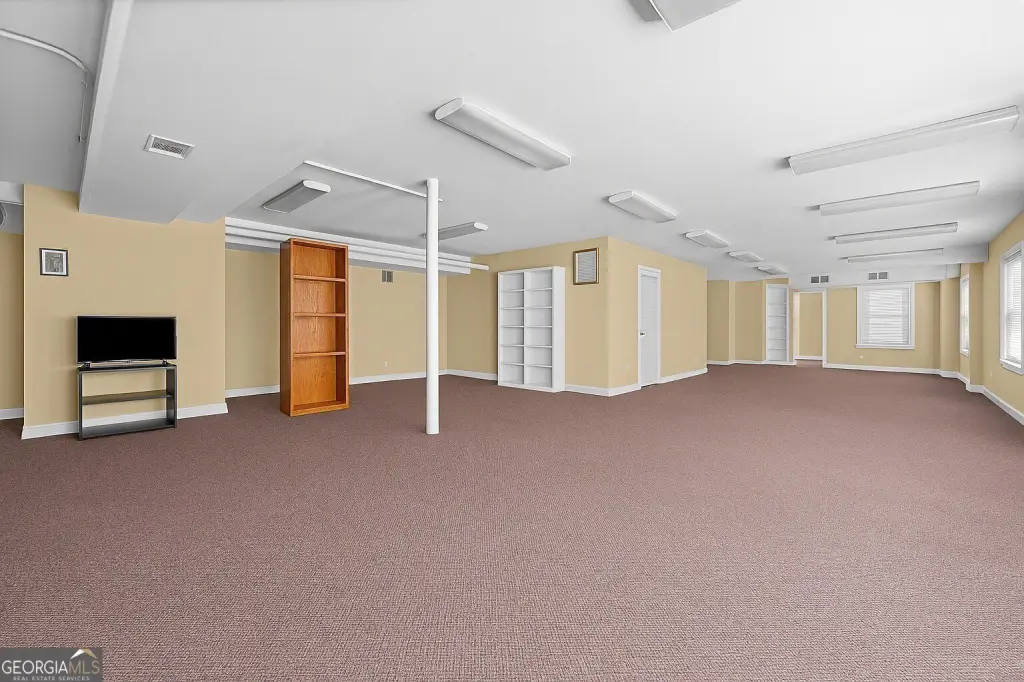
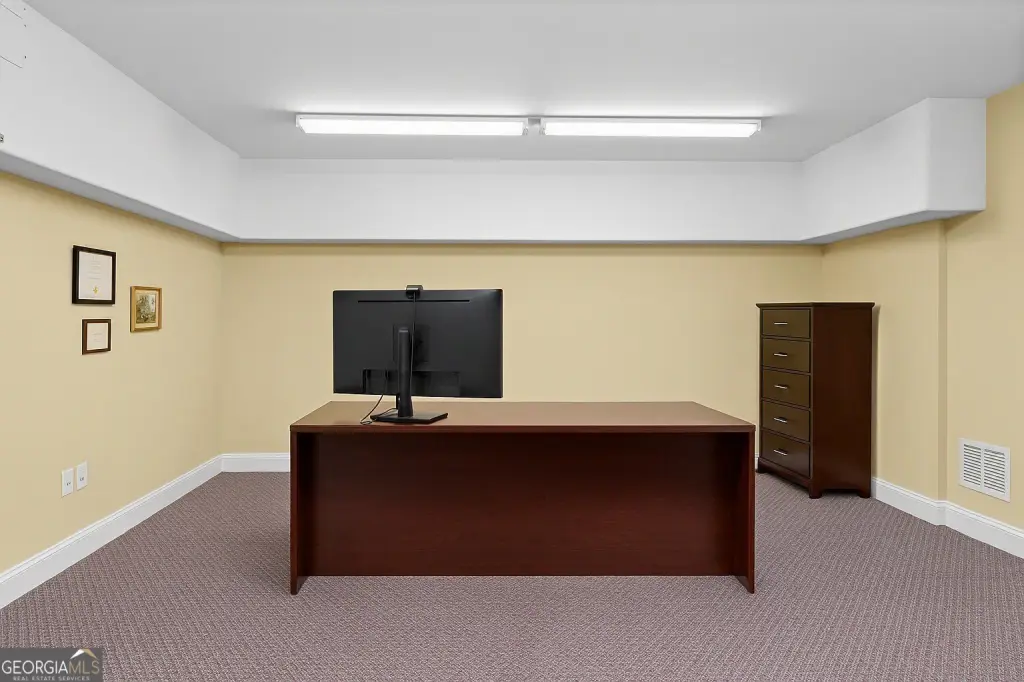
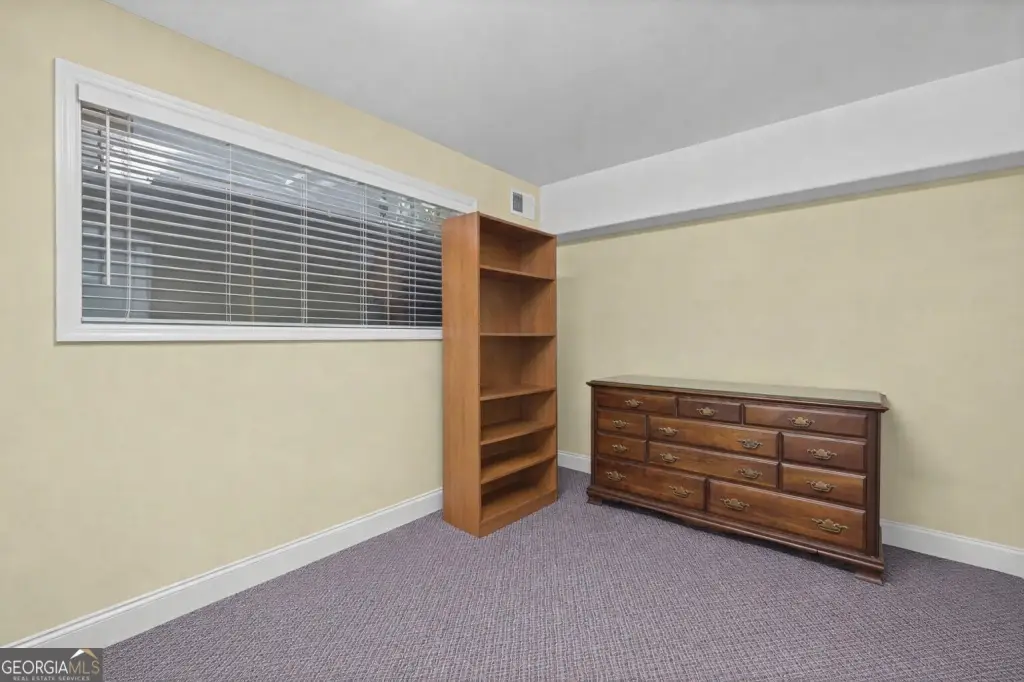
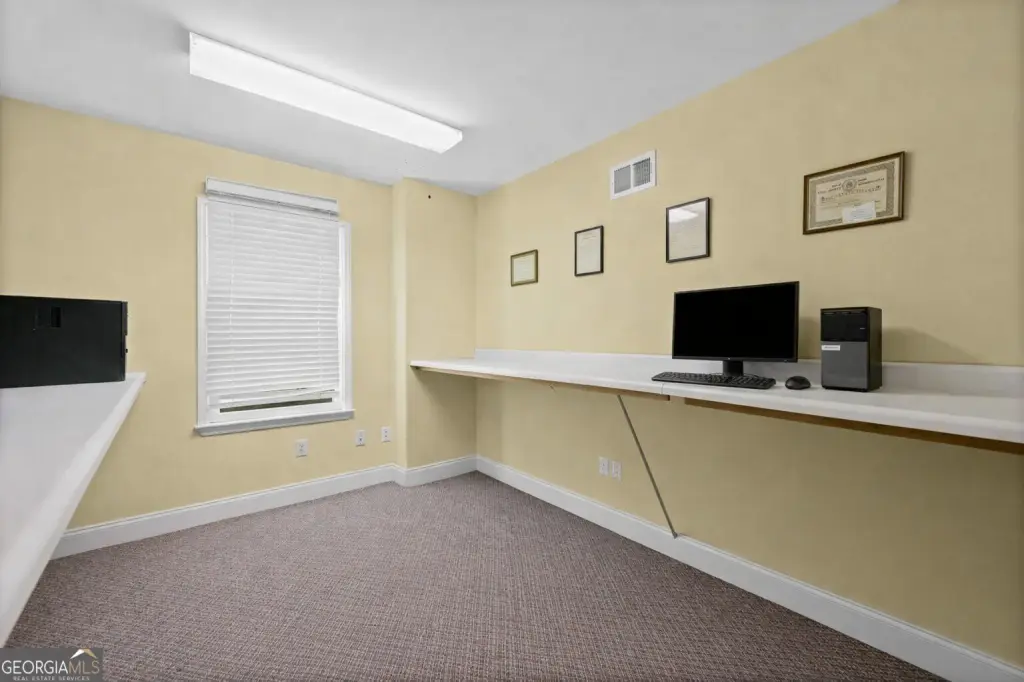
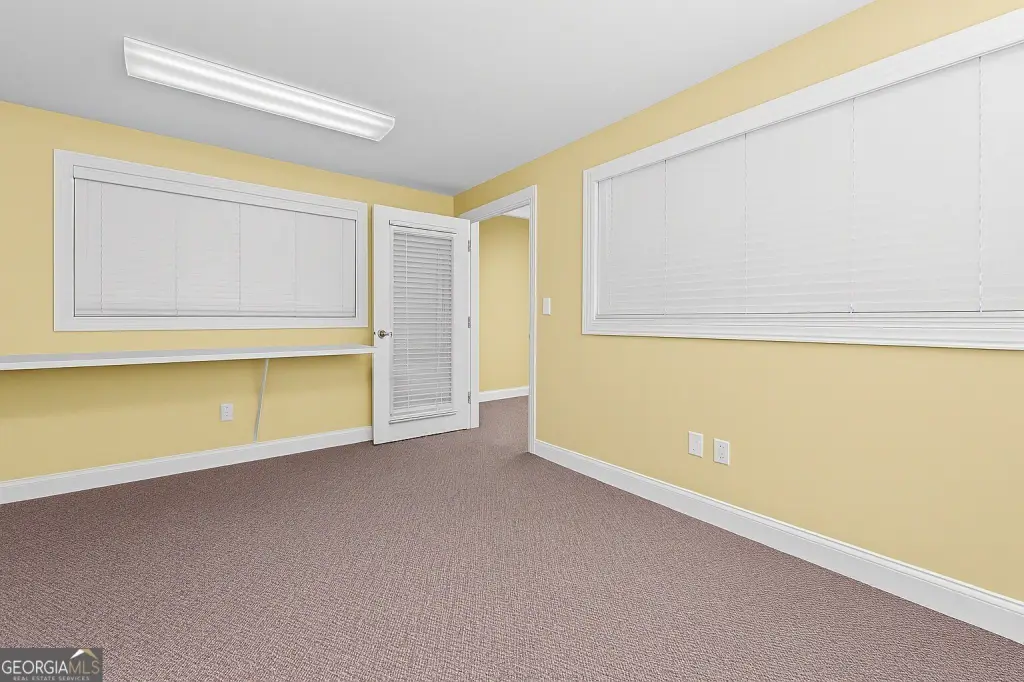
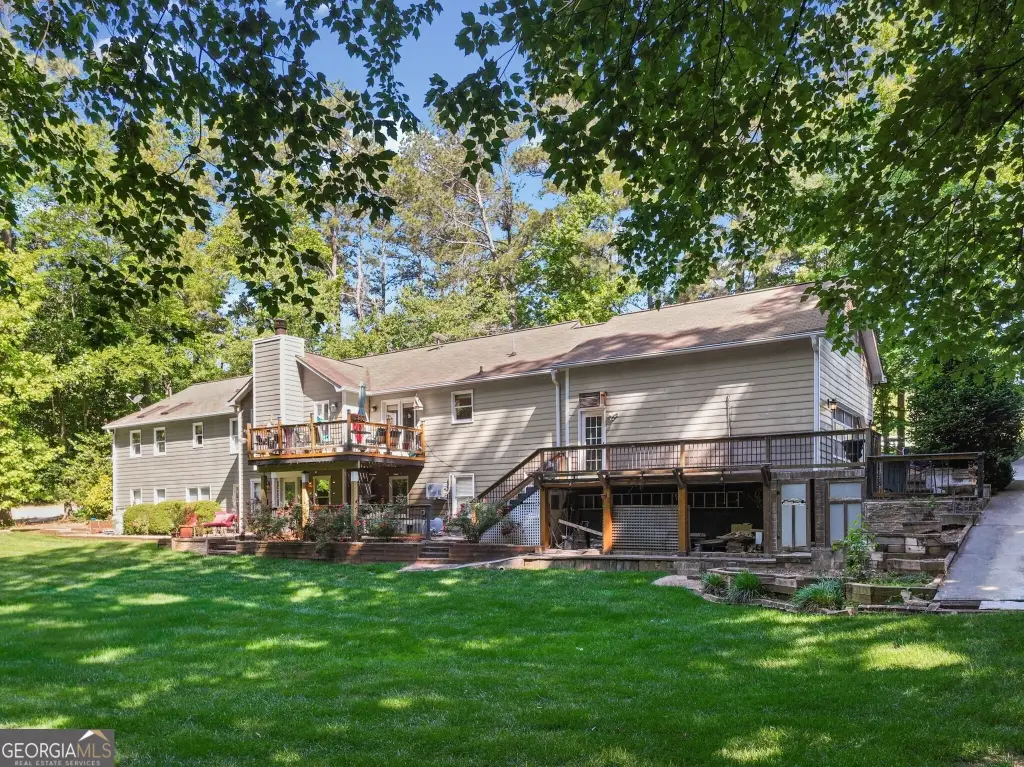
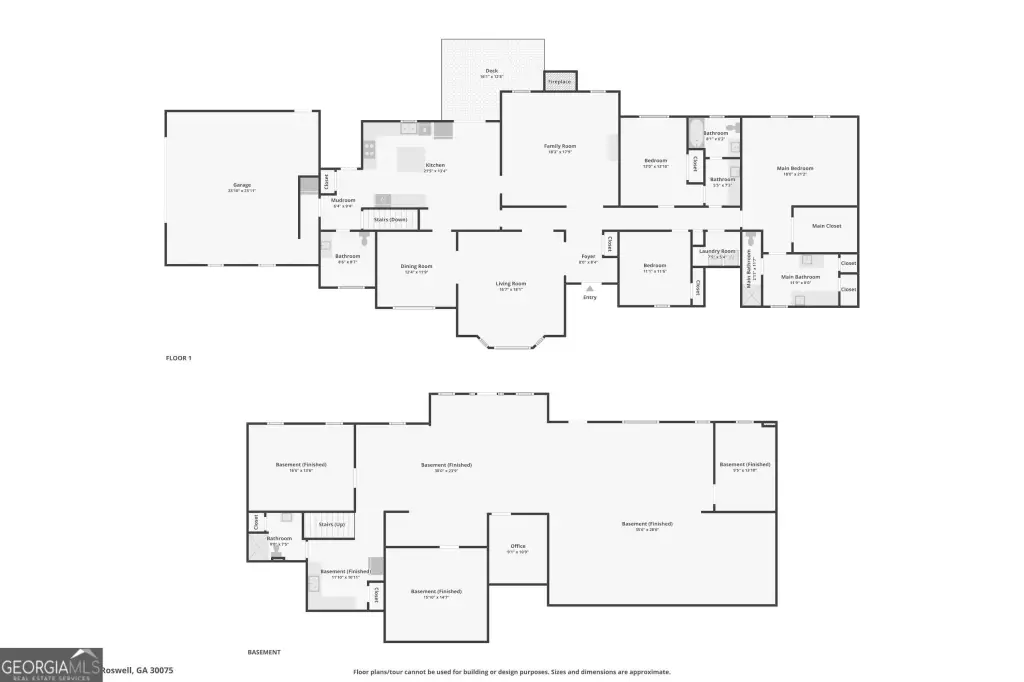
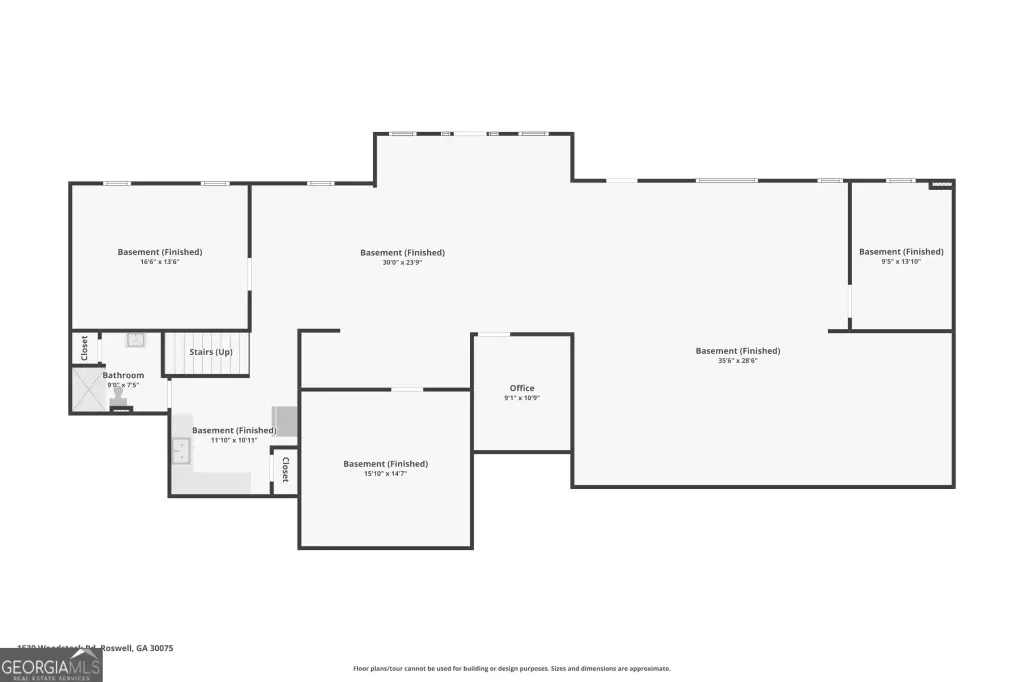
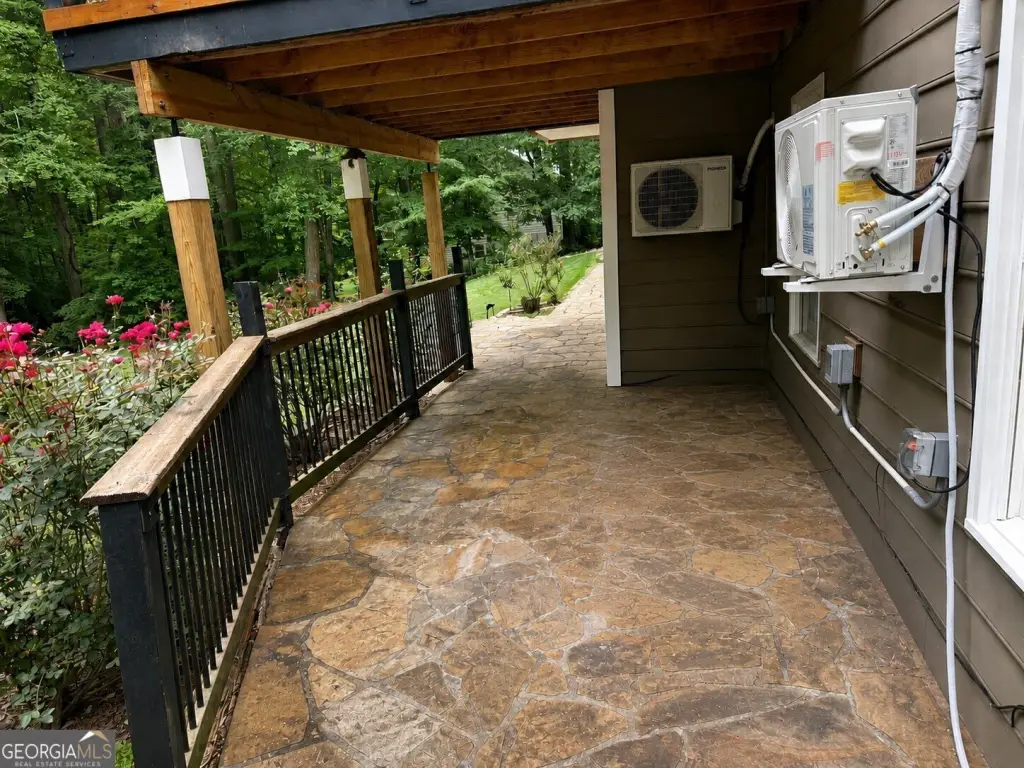
The finished terrace level adds a collaborative workspace, four private offices, a kitchenette, full bathroom, and access to a private patio. An oversized two-car garage provides additional storage or work area, while the extended driveway and parking lot support on-site parking. Rear driveway access may accommodate additional parking expansion. The property has public water, a septic tank, central heating, forced air, central air, electric cooling, frame and stone construction, and a composition roof. Its zoning allows both commercial and residential use.
The finished terrace level adds a collaborative workspace, four private offices, a kitchenette, full bathroom, and access to a private patio. An oversized two-car garage provides additional storage or work area, while the extended driveway and parking lot support on-site parking. Rear driveway access may accommodate additional parking expansion. The property has public water, a septic tank, central heating, forced air, central air, electric cooling, frame and stone construction, and a composition roof. Its zoning allows both commercial and residential use.
Key Highlights
- 5,126 SF professional office building on 1.032 acres
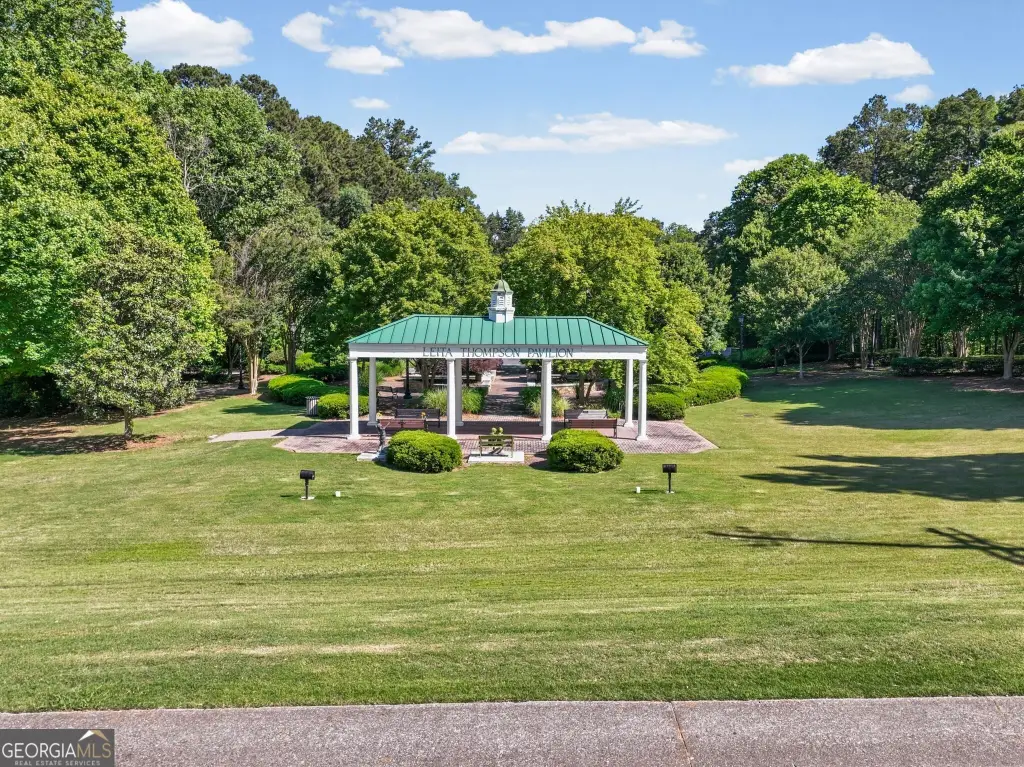
- Directly across from Leita Thompson Park in Roswell
- Finished terrace level with collaborative workspace, 4 private offices, kitchenette, full bathroom, and patio access
Financial Insights
Estimated NOI and Cap Rate
NOI / Yr
$68,643
Cap Rate
6.86%
Suggested Prices Based on Cap Rates
Cap Rate 5%
$1,372,860
$1.4M
Cap Rate 7%
$980,614
$980.6K
Cap Rate 9%
$762,700
$762.7K
Market Conditions
NOI Build-Up for 5,126 SF
Gross rent
$122.4K $23.87/SF
− Vacancy
−$30.8K −$6.02/SF
EGI
$91.5K $17.85/SF
− OpEx
−$22.9K −$4.46/SF
NOI
$68.6K $13.39/SF
Area
Fulton County, GA
Vacancy
25.20%
Lease Rate
$23.87 /SF/Yr
Expense Ratio
25.00%
Simulate Cap Rate and NOI
Suggested Prices Based on Cap Rates
Cap Rate 5%
$1,372,860
Cap Rate 7%
$980,614
Cap Rate 9%
$762,700
Alternative Uses
Best Use
Office B
$980.6K
$858.0K – $1.14M
NOI $68,643 @ 7.0% cap · market cap 6.86%
Second Best
—
—
no second resolved use
Theoretical Best
Office A
$1.43M
$1.25M – $1.67M
NOI $100,304 @ 7.0% cap · market cap 10.03%
Zoning and permitted uses should be independently verified with authorities.
Property Analytics
Unlock full access to Insights
Subscribe to Realmo Intelligence
Open Analytics
Current Use
Lease Details
Yes
Paved road access
Location Intelligence
Trade Area within ½ mile
289
Businesses Nearby
Explore this area
Business Placement
Demographics for 30075, GA
56,161
Population
22,190
Households
2.5
Avg Household Size
43
Median Age
70%
College-Educated
98%
High-School Grad
29.7 sq mi
ZIP Area
1,891
Density / Sq Mi
$153,743
Median Household Income
$76,630
Median Earnings
$1,790
Median Rent
$575,200
Median Home Value
Check the figures for this property
Cap Rate, Value Estimation, Potential NOI and more
View Realmo Analytics
Market
Vacancy Rate% for Office in South region

Questions? Ask Rey
Realmo’s AI knows this listing — price, zoning, demand, history. Ask anything.


Frequently Asked Questions
What type of property is this?
Office building - Two-level office property with private offices, collaborative areas, extensive parking, and commercial-residential use flexibility.
Where is this office building located?
The property is located at 1530 Woodstock Road Roswell, GA.
What is the asking price?
The asking price for this property is $1,000,000.
What are key features of this property?
This property features: 5,126 SF professional office building on 1.032 acres; Directly across from Leita Thompson Park in Roswell; Finished terrace level with collaborative workspace, 4 private offices, kitchenette, full bathroom, and patio access


