Four-Unit Mixed-Use
For Sale
$1,598,000
Pending
1467-1469 Pine Street, San Francisco, CA 94109
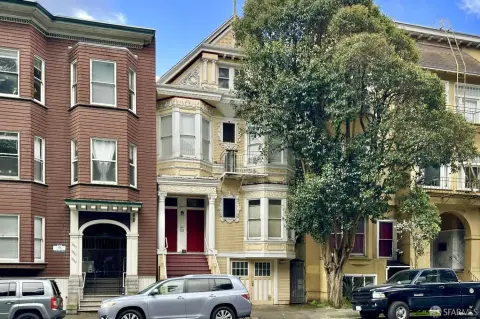
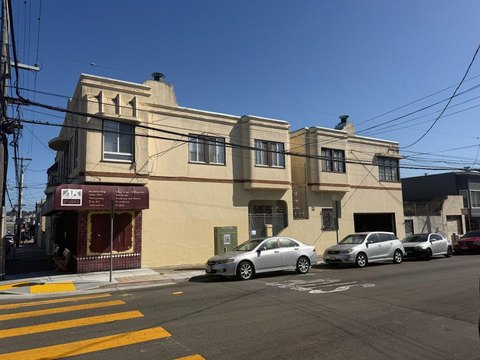
A 1910 building combines commercial space with residential units that currently generate rental income.
Property Size5,600 SF
Days on Market247
Property Features for 1467-1469 Pine Street
General Information
Standard status
Pending
Size
5,600 SF
Property subtype
Mixed Use
Building Details
Building Size
5,600 SF
Year Built
1910
Listing Agency:
eXp Realty of California, Inc
Listed By:
Jason Tam
(415) 730-3775
Source:
Paytonslist
Added: Feb 11
Changed: Oct 7
Last Checked: Oct 15 at 7:07AM
Displayed information is deemed reliable but is not guaranteed and should be independently verified. All listing content including descriptions, pricing, images are the copyrighted material of eXp Realty of California, Inc

Ask AI about this property
Review the available facts, identify missing information and prepare questions for the agent.
Investment Insights
Based on property information with market context.
Located at 1467-1469 Pine Street in San Francisco’s Nob Hill neighborhood, this 5,600-square-foot mixed-use property was built in 1910 and contains four units. The configuration includes a commercial unit with generous ceiling height and abundant natural light, along with residential units that are currently generating rental income. The commercial space is presented as an open canvas for a future operator, while the residential portion offers an established income component within the same building.
The property is positioned in Nob Hill, an area identified in the source information for its restaurants, boutiques, and local dining destinations, including Swan Depot and House of Prime Rib. Its combination of commercial and residential space creates a single asset with multiple occupancy components and an urban San Francisco setting.
The property is positioned in Nob Hill, an area identified in the source information for its restaurants, boutiques, and local dining destinations, including Swan Depot and House of Prime Rib. Its combination of commercial and residential space creates a single asset with multiple occupancy components and an urban San Francisco setting.
Key Highlights
- Four‑unit mixed‑use property at 1467‑1469 Pine Street
- 5,600 SF building constructed in 1910
- Commercial unit features generous ceiling height and abundant natural light
Financial Insights
Estimated NOI and Cap Rate
NOI / Yr
$107,100
Cap Rate
6.70%
Suggested Prices Based on Cap Rates
Cap Rate 5%
$2,142,000
$2.1M
Cap Rate 7%
$1,530,000
$1.5M
Cap Rate 9%
$1,190,000
$1.2M
Market Conditions
NOI Build-Up for 5,600 SF
Gross rent
$201.6K $36.00/SF
− Vacancy
−$30.2K −$5.40/SF
EGI
$171.4K $30.60/SF
− OpEx
−$64.3K −$11.48/SF
NOI
$107.1K $19.13/SF
Area
ZIP 94109
Vacancy
15.00%
Lease Rate
$36.00 /SF/Yr
Expense Ratio
37.50%
Simulate Cap Rate and NOI
Suggested Prices Based on Cap Rates
Cap Rate 5%
$2,142,000
Cap Rate 7%
$1,530,000
Cap Rate 9%
$1,190,000
Alternative Uses
Best Use
Apartment 5plus
$2.39M
$2.09M – $2.79M
NOI $167,270 @ 7.0% cap · market cap 10.47%
Second Best
Mixed Use
$1.53M
$1.34M – $1.79M
NOI $107,100 @ 7.0% cap · market cap 6.70%
Theoretical Best
Retail
$25.53M
$22.34M – $29.79M
NOI $1,787,108 @ 7.0% cap · market cap 111.83%
Zoning and permitted uses should be independently verified with authorities.
How Realmo checks its estimates
Property Analytics
Current Use
Location Intelligence
Trade Area within ½ mile
12,112
Businesses Nearby
Explore this area
Business Placement
Demographics for 94109, CA
58,501
Population
39,043
Households
1.5
Avg Household Size
38
Median Age
65%
College-Educated
90%
High-School Grad
1.1 sq mi
ZIP Area
53,183
Density / Sq Mi
$112,201
Median Household Income
$89,841
Median Earnings
$2,172
Median Rent
$1,390,000
Median Home Value


Frequently Asked Questions
What type of property is this?
Mixed-use property - A 1910 building combines commercial space with residential units that currently generate rental income.
Where is this mixed-use property located?
The property is located at 1467-1469 Pine Street San Francisco, CA.
What is the asking price?
The asking price for this property is $1,598,000.
What are key features of this property?
This property features: Four‑unit mixed‑use property at 1467‑1469 Pine Street; 5,600 SF building constructed in 1910; Commercial unit features generous ceiling height and abundant natural light


