Self-Storage Facility with Traffic
For Sale
$8,700,000
1445 N Woodruff Ave, Idaho Falls, ID 83401
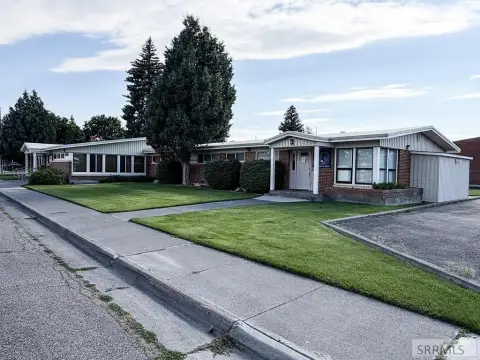
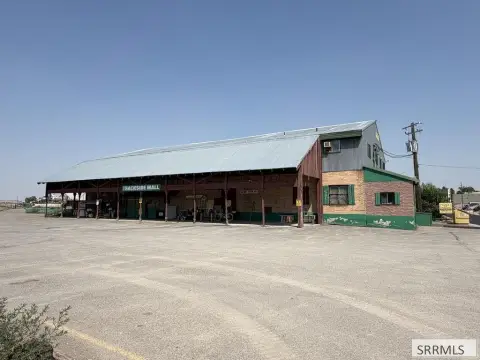
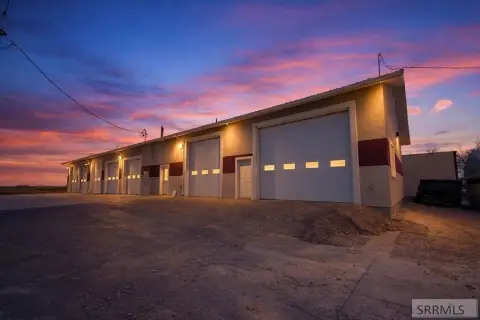
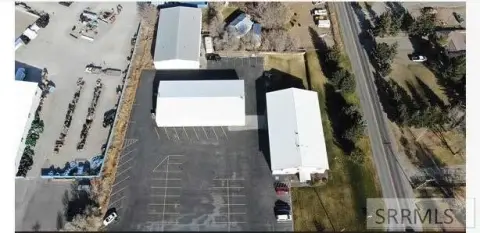
Storage property with current occupancy and documented gains over the past year.
Property Size90,000 SF
Price / SF$111.06
Days on Market8
Property Features for 1445 N Woodruff Ave
General Information
Standard status
Active
Size
90,000 SF
Property subtype
Self-Storage Facility
Occupancy
87%
Additional Details
Road Access
Yes
Amenities
STRONG MOMENTUM
GROWTH MARKET AND STABILITY
HISTORIC MANAGEMENT INSTABILITY
GREAT LOCATION AND DEMOGRAPHICS
Building Details
Building Size
90,000 SF
Year Built
1987
Units
767
Listing Agency:
Marcus & Millichap - Salt Lake City
Listed By:
Jordan Farrer · License #License(s): UT: 9220604-SA00, NV: S.0192979, ID: SP54637
(801) 736-2643
Source:
Marcusmillichap
Added: Sep 20
Last Checked: Sep 26 at 3:27AM
Displayed information is deemed reliable but is not guaranteed and should be independently verified. All listing content including descriptions, pricing, images are the copyrighted material of Marcus & Millichap - Salt Lake City
Investment Insights
Based on property information with market context.
The self-storage facility at 1445 N Woodruff Ave. in Idaho Falls contains 78,338 square feet and was built in 1987. Physical occupancy is currently 85 percent, reflecting a 13 percent increase from last September. Current ownership has also transitioned between self-management and third-party management, with SAM engaged during the past 12 months.
The property has visibility to more than 18,000 vehicles daily. Within a three-mile radius, the population is 72,168, with projected growth of approximately four percent over the next five years. Average household income in the trade area is $83,542. Idaho Falls has recorded several recent storage deliveries, while those properties have largely been absorbed and no known developments are in the pipeline.
The property has visibility to more than 18,000 vehicles daily. Within a three-mile radius, the population is 72,168, with projected growth of approximately four percent over the next five years. Average household income in the trade area is $83,542. Idaho Falls has recorded several recent storage deliveries, while those properties have largely been absorbed and no known developments are in the pipeline.
Key Highlights
- 78,338‑square‑foot self‑storage facility
- 85 percent physical occupancy
- Occupancy increased 13 percent from last September
Financial Insights
Estimated NOI and Cap Rate
NOI = area × lease_rate × (100 − vacancy) / 100 × (1 − expense_ratio). Net Operating Income — what the owner takes home each year before mortgage payments and income tax. Effective rent (asking rent minus vacancy losses) minus operating costs (taxes, insurance, maintenance, management).
NOI / Yr
$625,137
Cap rate = NOI / list price × 100. Capitalization rate — annual return on a fully cash purchase, before financing. NOI divided by price. Higher means more income per dollar invested, but usually also more risk or older condition. 5–8% is typical for stabilized commercial property; double digits often signal distressed deals.
Cap Rate
7.19%
Suggested Prices Based on Cap Rates
Cap rates vary significantly by property type, market, and asset quality.
Typical U.S. stable-market ranges:
Multifamily — 4.5% to 6.5% (Class A in primary markets often sub-5%; Class C in secondary markets 6%+)
Industrial / Logistics — 5.0% to 7.0% (compressed heavily in recent years due to e-commerce demand)
Office — 6.5% to 9%+ (wide spread post-2020; CBD Class A vs. suburban Class B varies dramatically)
Retail — 5.5% to 8.5% (grocery-anchored on the low end, unanchored strip centers higher)
Hospitality / Hotels — 7.5% to 10%+ (higher due to operational risk)
Self-Storage — 5.5% to 7.5%
Medical Office — 6.0% to 7.5%
Net Lease (single tenant, credit) — 5.0% to 7.0% depending on tenant credit and lease term
Rules of thumb:
Primary markets (NYC, SF, LA, Boston, DC) trade at lower cap rates than secondary/tertiary markets, often by 100–200 bps (bps, aka basis points; 1 bp = 0.01%).
Class A assets trade ~50–150 bps tighter than Class B, and Class B tighter than Class C.
Cap rates move inversely with price — a lower cap rate means a higher price for the same NOI.
Spread to the 10-year Treasury is a common benchmark; historically 200–400 bps over the 10-year.
Cap Rate 5%
$12,502,740
$12.5M
Cap Rate 7%
$8,930,529
$8.9M
Cap Rate 9%
$6,945,967
$6.9M
Market Conditions
NOI Build-Up for 78,338 SF
Vacancy — income lost from leasable area expected to sit empty during the year, subtracted from gross rent.
EGI (Effective Gross Income) — gross rent minus vacancy losses, the realistic income before paying operating costs.
OpEx (Operating Expenses) — recurring costs to operate the property (property tax, insurance, utilities, maintenance, management); excludes financing and capital improvements.
NOI (Net Operating Income) — income a property generates after operating costs but before financing and taxes.
Gross rent
$940.1K $12.00/SF
− Vacancy
−$47.0K −$0.60/SF
EGI
$893.1K $11.40/SF
− OpEx
−$267.9K −$3.42/SF
NOI
$625.1K $7.98/SF
Area
Bonneville County, ID
Vacancy
5.00%
Lease Rate
$12.00 /SF/Yr
Expense Ratio
30.00%
Simulate Cap Rate and NOI
Suggested Prices Based on Cap Rates
Cap rates vary significantly by property type, market, and asset quality.
Typical U.S. stable-market ranges:
Multifamily — 4.5% to 6.5% (Class A in primary markets often sub-5%; Class C in secondary markets 6%+)
Industrial / Logistics — 5.0% to 7.0% (compressed heavily in recent years due to e-commerce demand)
Office — 6.5% to 9%+ (wide spread post-2020; CBD Class A vs. suburban Class B varies dramatically)
Retail — 5.5% to 8.5% (grocery-anchored on the low end, unanchored strip centers higher)
Hospitality / Hotels — 7.5% to 10%+ (higher due to operational risk)
Self-Storage — 5.5% to 7.5%
Medical Office — 6.0% to 7.5%
Net Lease (single tenant, credit) — 5.0% to 7.0% depending on tenant credit and lease term
Rules of thumb:
Primary markets (NYC, SF, LA, Boston, DC) trade at lower cap rates than secondary/tertiary markets, often by 100–200 bps (bps, aka basis points; 1 bp = 0.01%).
Class A assets trade ~50–150 bps tighter than Class B, and Class B tighter than Class C.
Cap rates move inversely with price — a lower cap rate means a higher price for the same NOI.
Spread to the 10-year Treasury is a common benchmark; historically 200–400 bps over the 10-year.
Cap Rate 5%
$12,502,740
Cap Rate 7%
$8,930,529
Cap Rate 9%
$6,945,967
Alternative Uses
Best Use
Self Storage
$8.93M
$7.81M – $10.42M
NOI $625,137 @ 7.0% cap · market cap 7.19%
Second Best
Warehouse
$5.59M
$4.89M – $6.53M
NOI $391,533 @ 7.0% cap · market cap 4.50%
Theoretical Best
Office A
$17.31M
$15.14M – $20.19M
NOI $1,211,544 @ 7.0% cap · market cap 13.93%
Zoning and permitted uses should be independently verified with authorities.
Property Analytics
Unlock full access to Insights
Subscribe to Realmo Intelligence
Open Analytics
Current Use
Lease Details
Yes
Paved road access
Location Intelligence
Trade Area within ½ mile
388
Businesses Nearby
Explore this area
Business Placement
Demographics for 83401, ID
47,114
Population
16,026
Households
2.9
Avg Household Size
31
Median Age
30%
College-Educated
90%
High-School Grad
197.3 sq mi
ZIP Area
239
Density / Sq Mi
$75,870
Median Household Income
$35,293
Median Earnings
$1,132
Median Rent
$307,700
Median Home Value
Check the figures for this property
Cap Rate, Value Estimation, Potential NOI and more
View Realmo Analytics
Market
Vacancy Rate% for Industrial in West region

Questions? Ask Rey
Realmo’s AI knows this listing — price, zoning, demand, history. Ask anything.




Frequently Asked Questions
What type of property is this?
Self storage facility - Storage property with current occupancy and documented gains over the past year.
Where is this self storage facility located?
The property is located at 1445 N Woodruff Ave Idaho Falls, ID.
What is the asking price?
The asking price for this property is $8,700,000.
What are key features of this property?
This property features: 78,338‑square‑foot self‑storage facility; 85 percent physical occupancy; Occupancy increased 13 percent from last September