Office Building with Five
For Sale
$1,200,000
890 Oxford Drive, Idaho Falls, ID 83401
Commercial Sale, Idaho Falls, ID
Property Size7,552 SF
Lot Size0.57 Acres
Price / SF$158.90
Days on Market47
Property Features for 890 Oxford Drive
General Information
Property type
Commercial Sale
Property subtype
Other
Zoning description
General Zoning: If Residence 3 A, Specific Zoning: Idaho Falls-R3a-Res Mixed Use
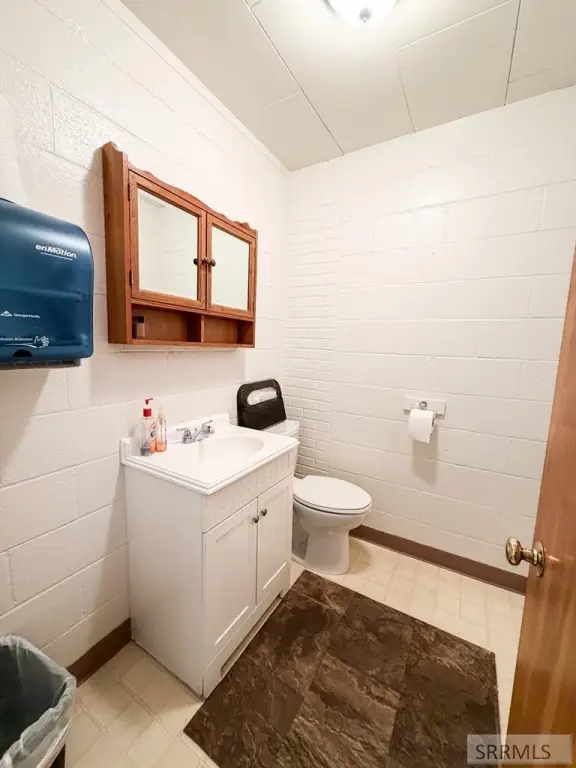
Bathrooms
5
Full bathrooms
5
Rooms
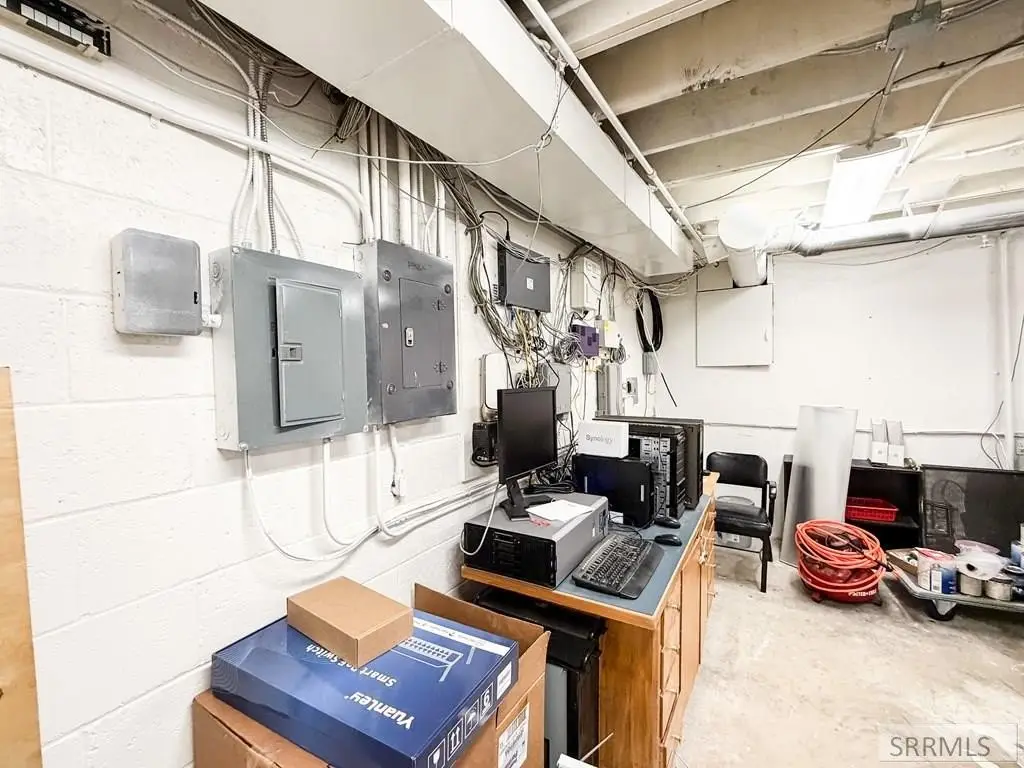
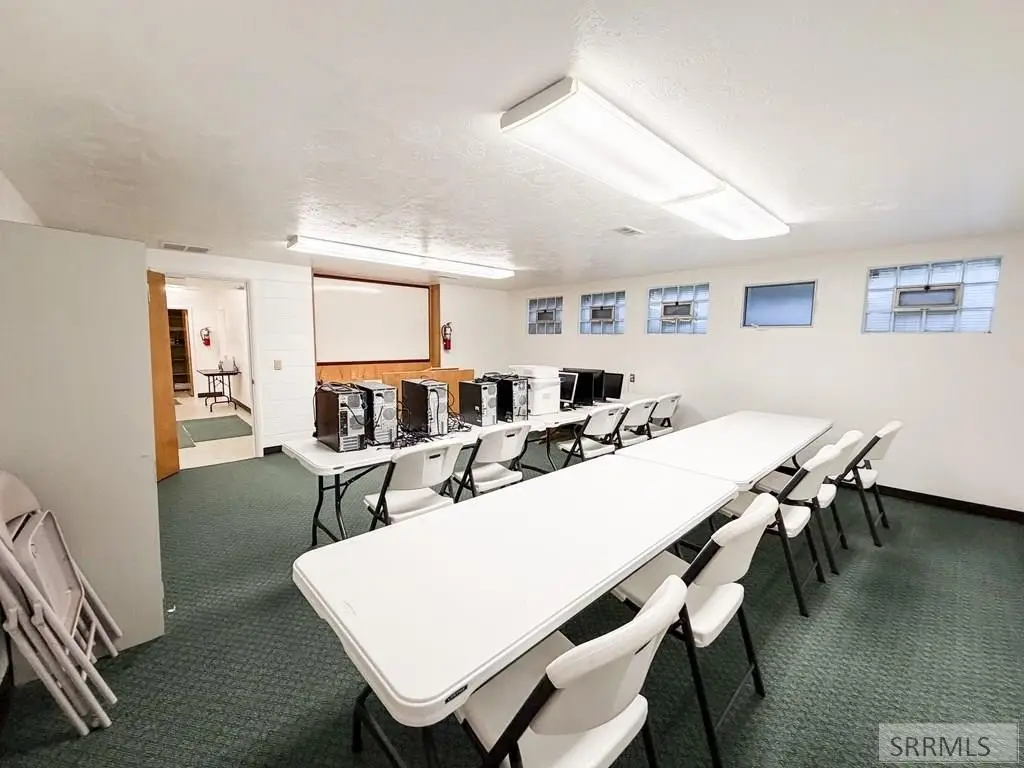
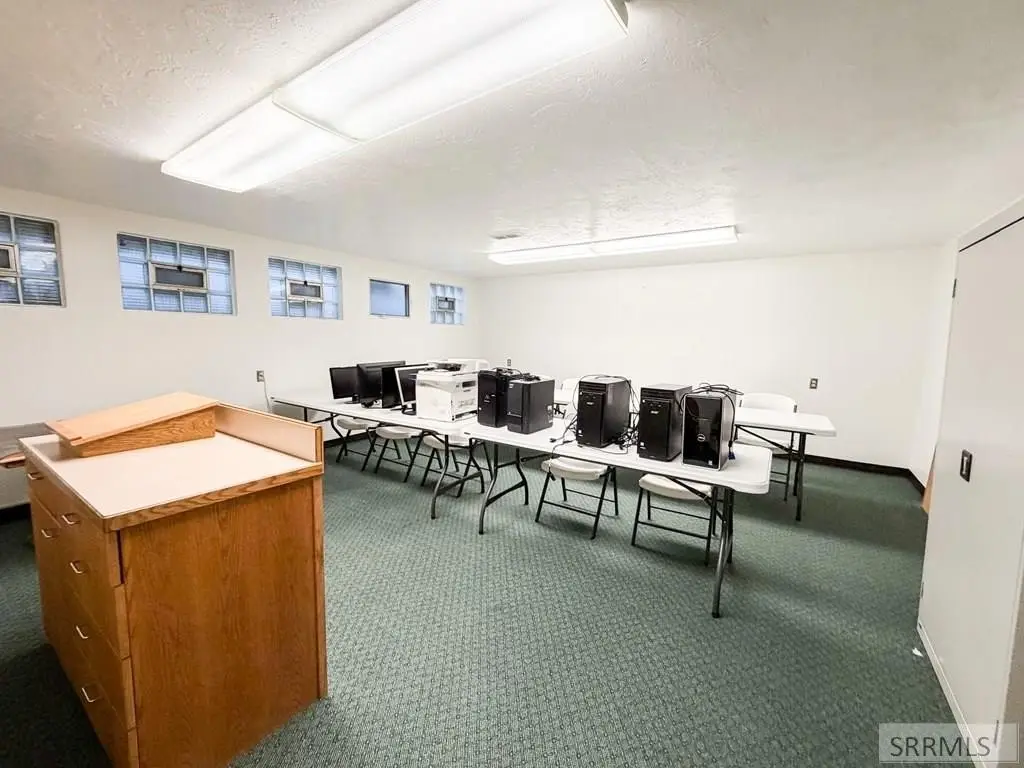
Basement, Bathroom 1, Bathroom 3, Bathroom 5, Bathroom 4, Bathroom 2
Parking
18
Parking features
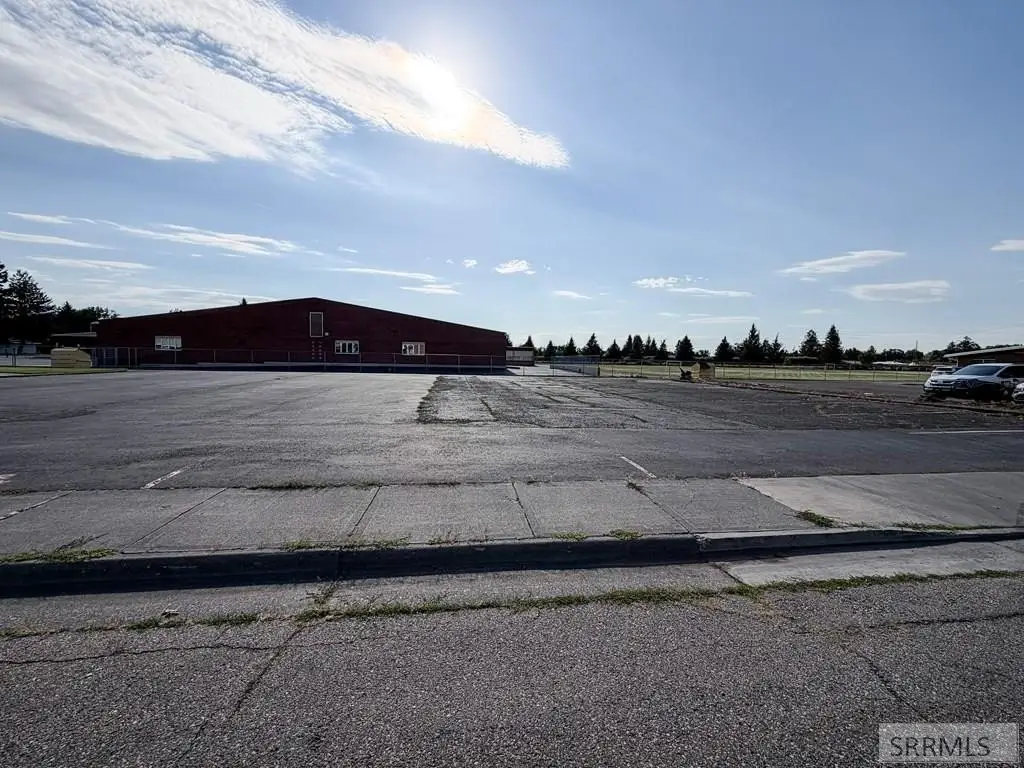
Parking Lot, Off Street, On Street
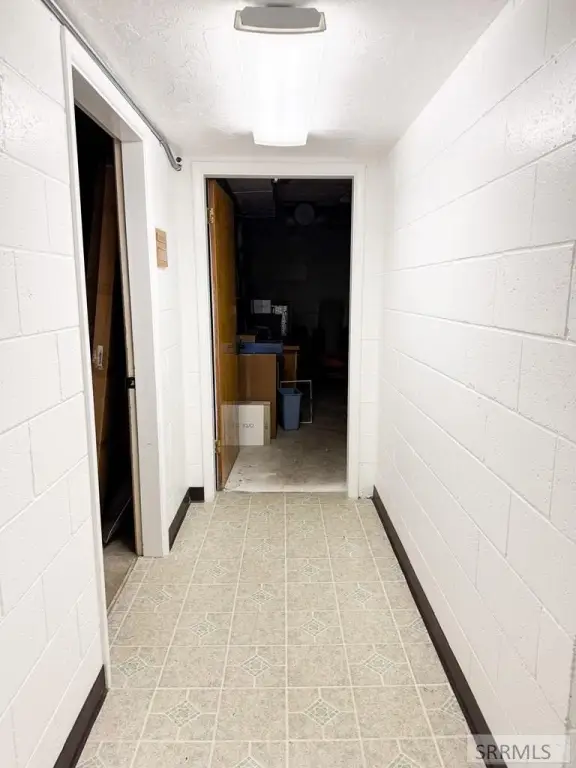
Basement
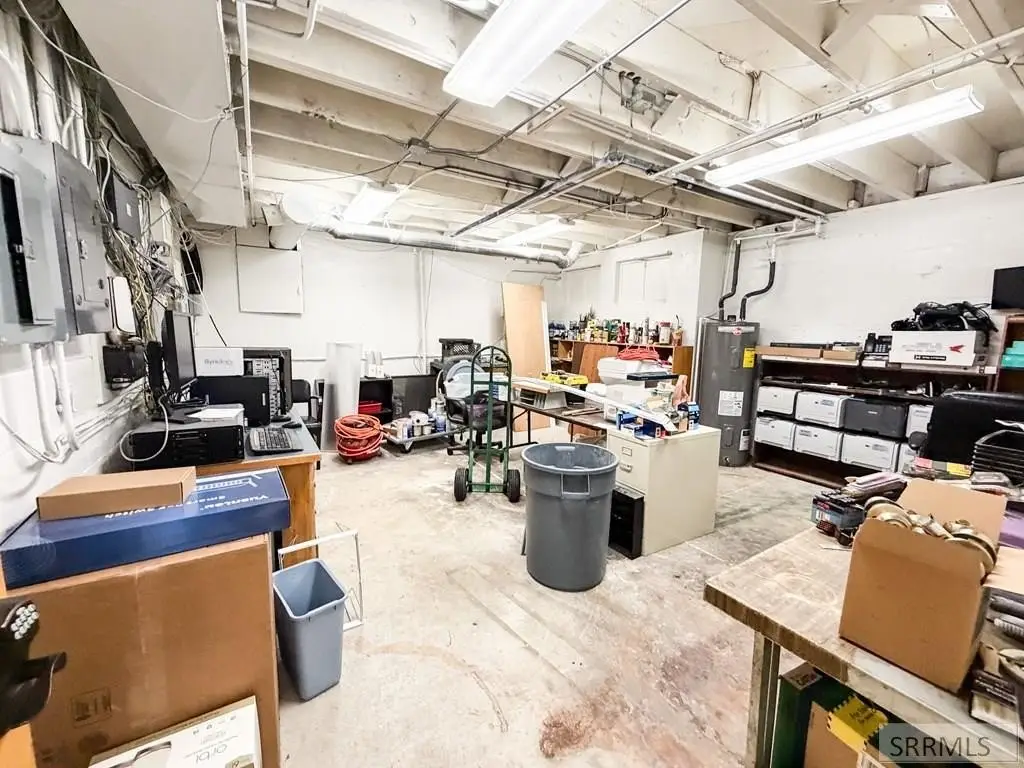
Finished, Partial
Accessibility
Accessible Approach with Ramp
Subdivision
Linden Park-Bon
Lot features
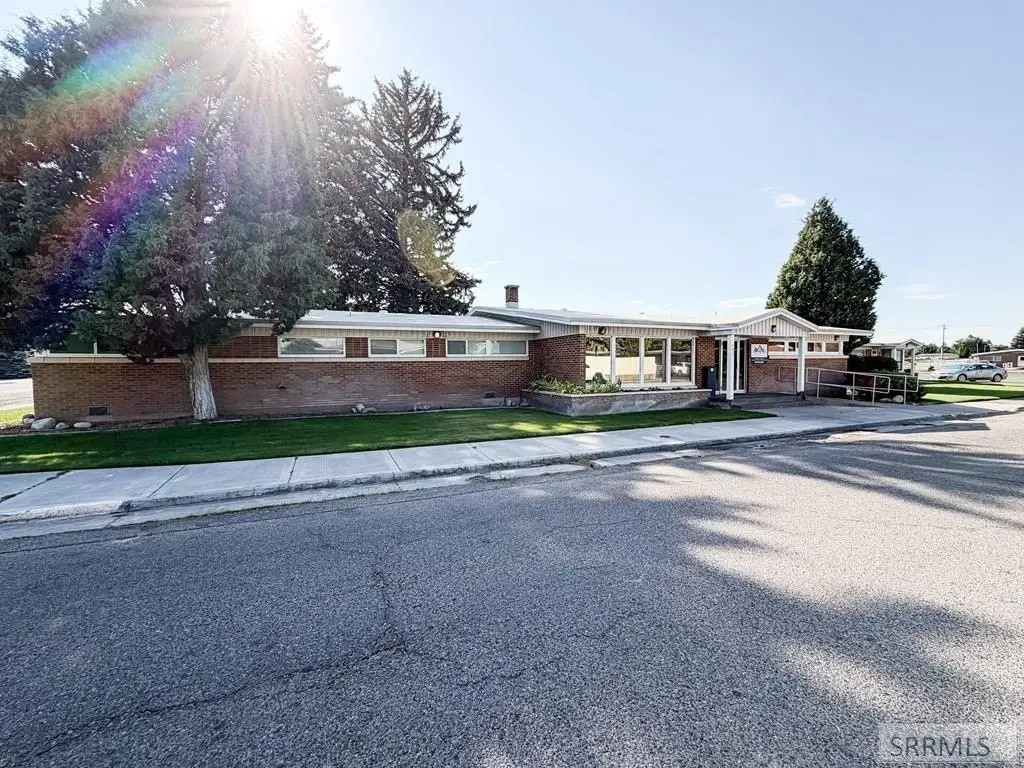
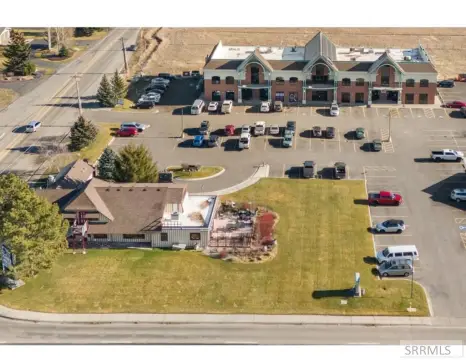
Near Mall/ Shop, Near Schools, Concrete Curbing, Established Lawn, Many Trees, Corner Lot
Directions
From 17th and Woodruff, head north on Woodruff, turn left on 9th ST, property is on the corner of Oxford and 9th.
Standard status
Active
APN
RPA1422006001A
Size
7,552 SF
Lot size
0.57 Acres
Taxes and HOA fees
Tax Year
2025
Tax Description
See Exhibit A
Tax Annual Amount
6619
Legal Description
See Exhibit A
Utilities
Sewer type
Public Sewer
Heating system
Natural Gas, Forced Air
Cooling system
Central Air
Water source
Public
Amenities
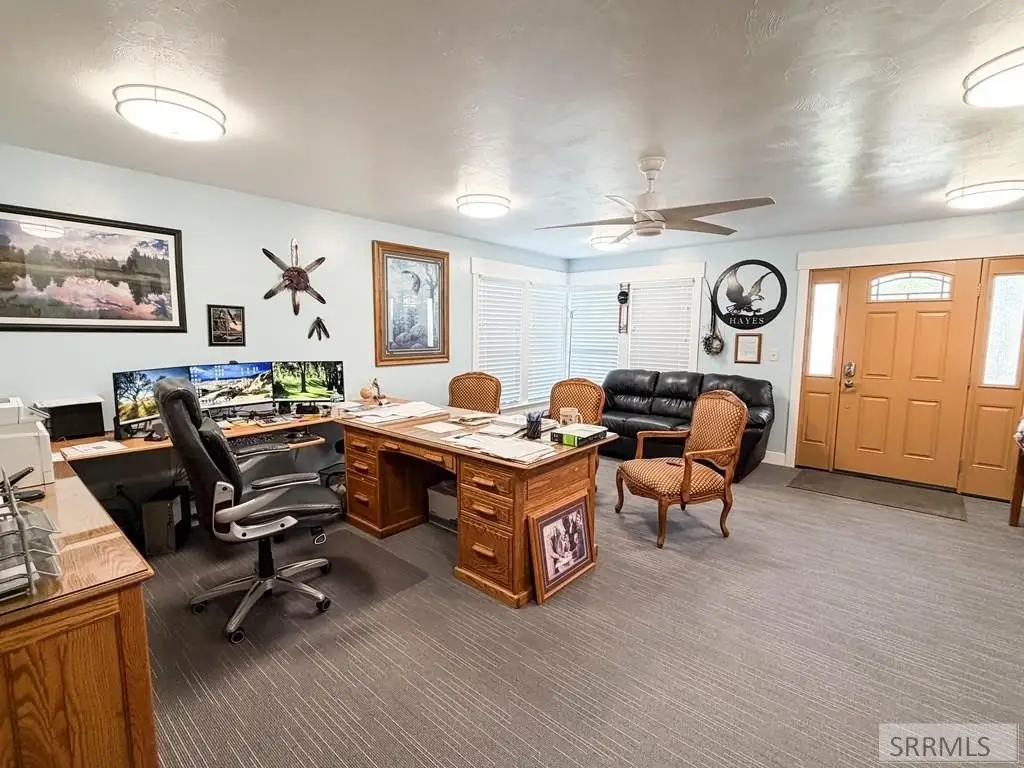
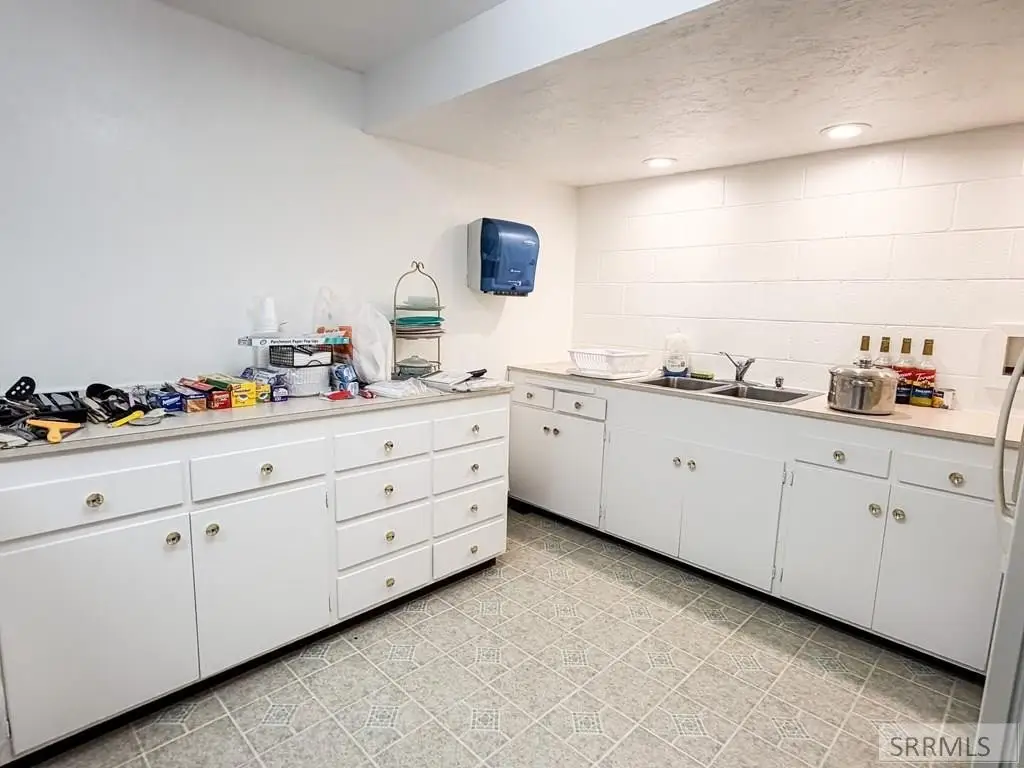
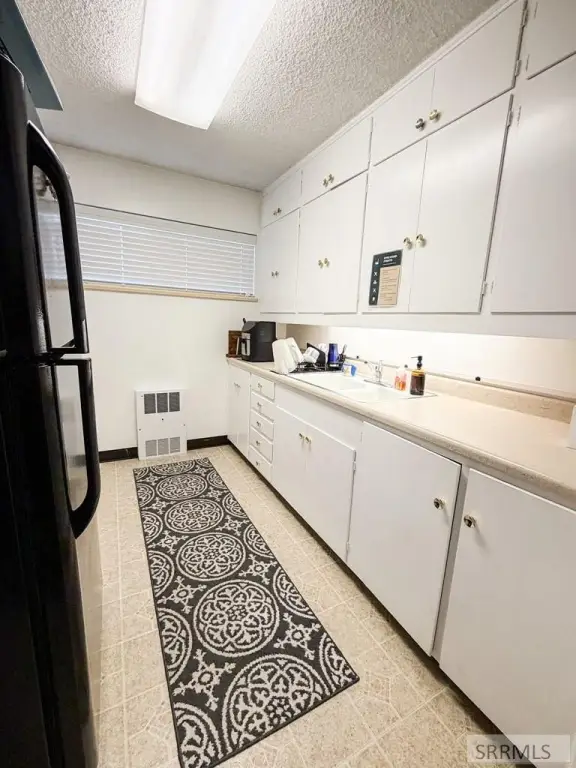
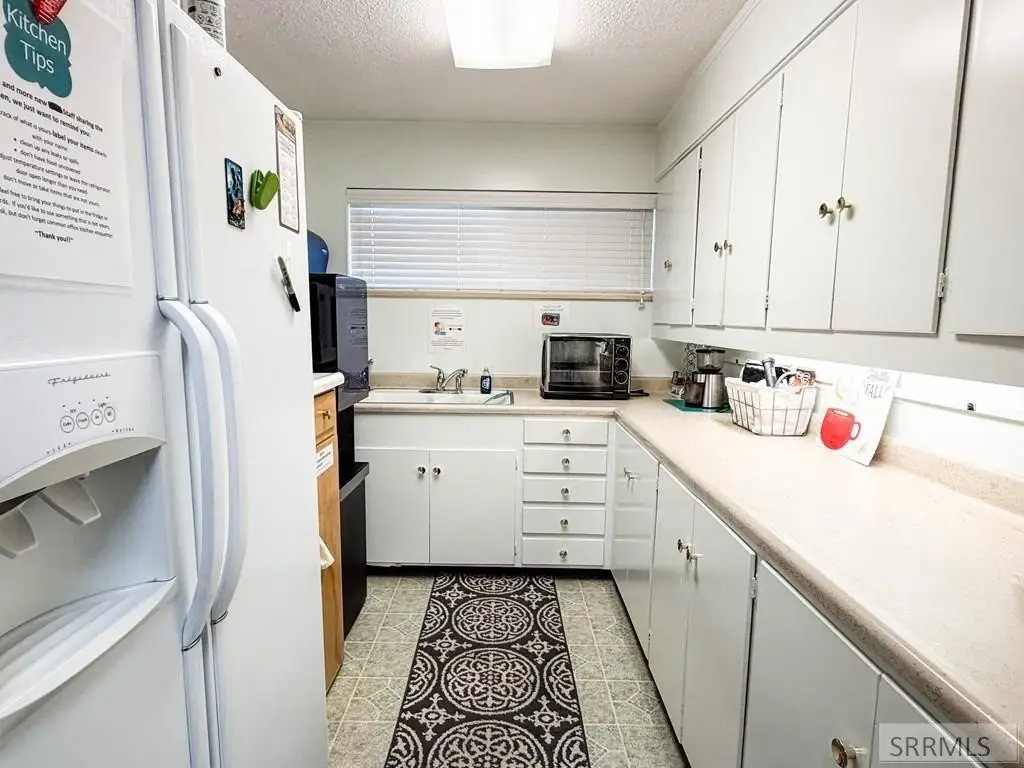
kitchens
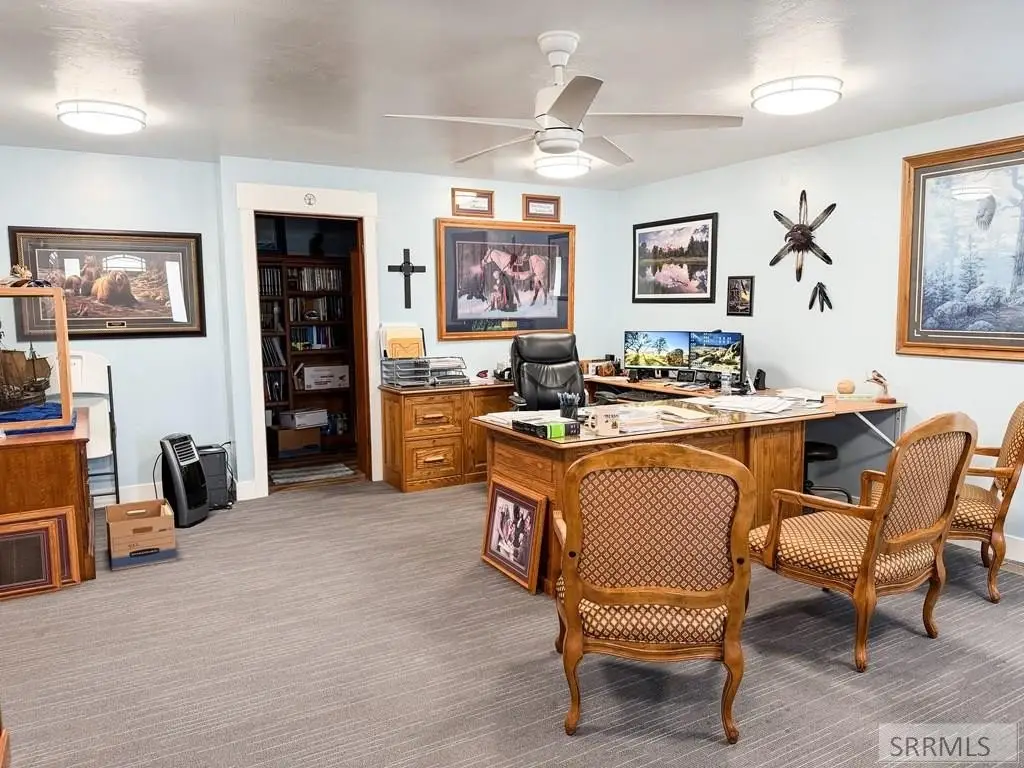
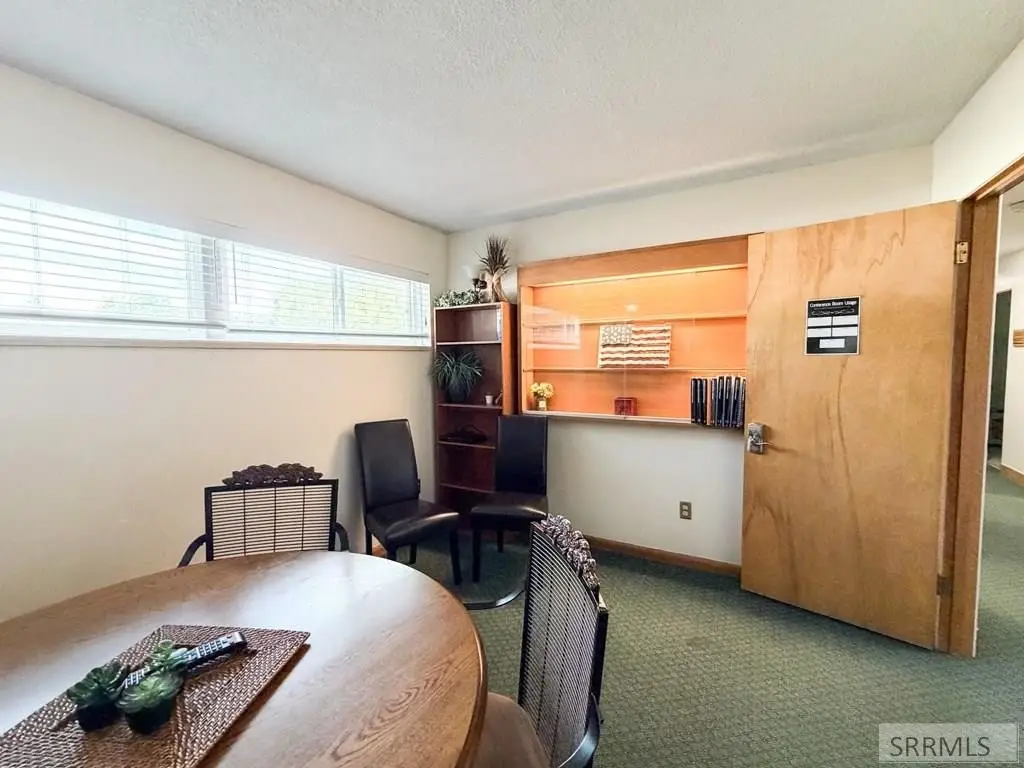
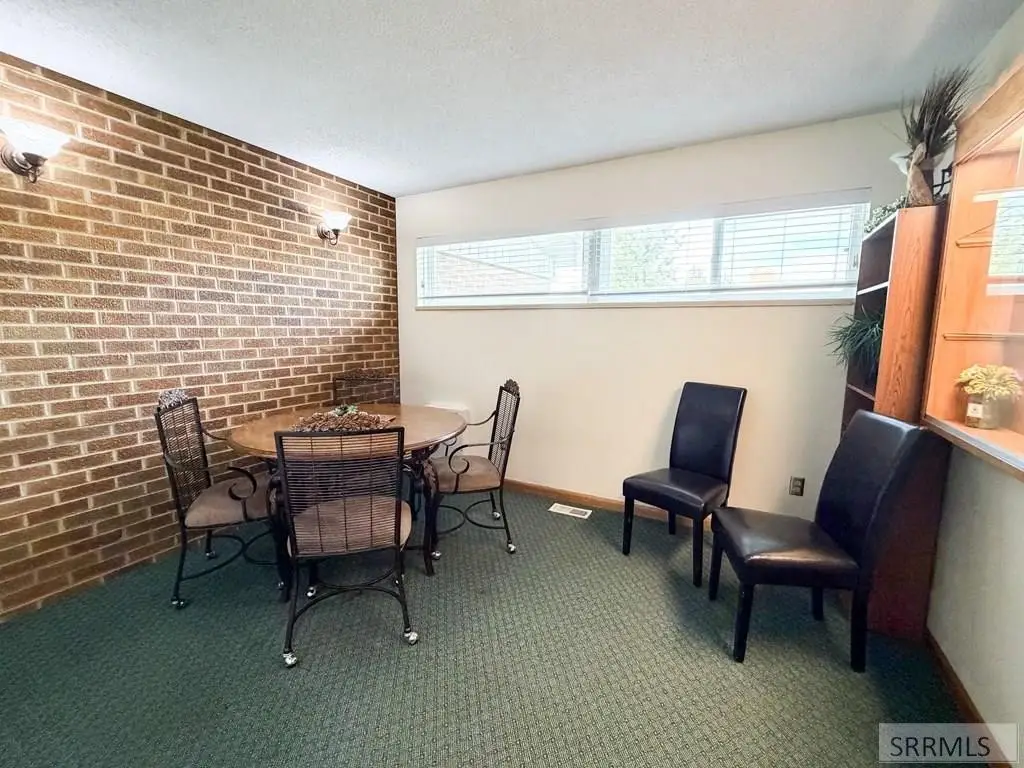
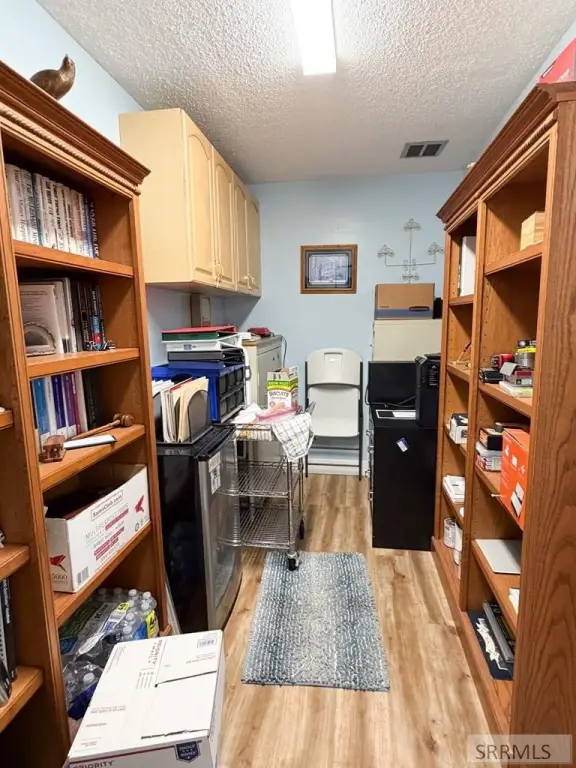
conference room
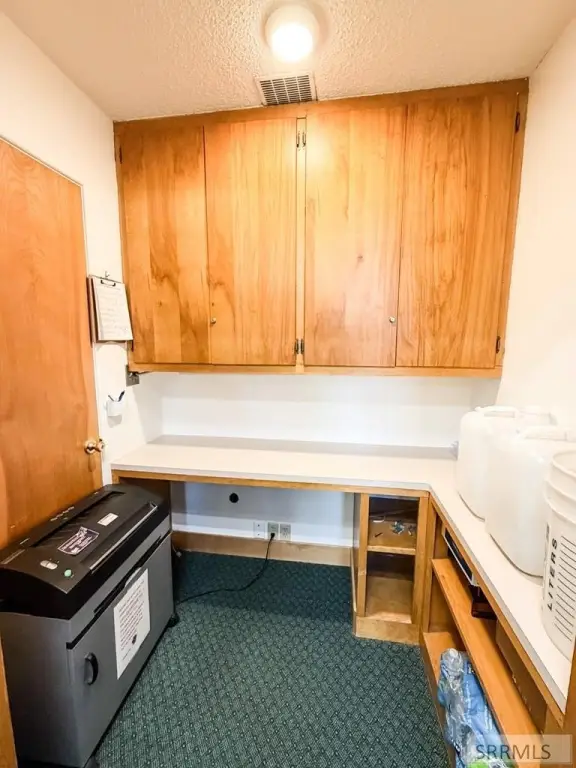
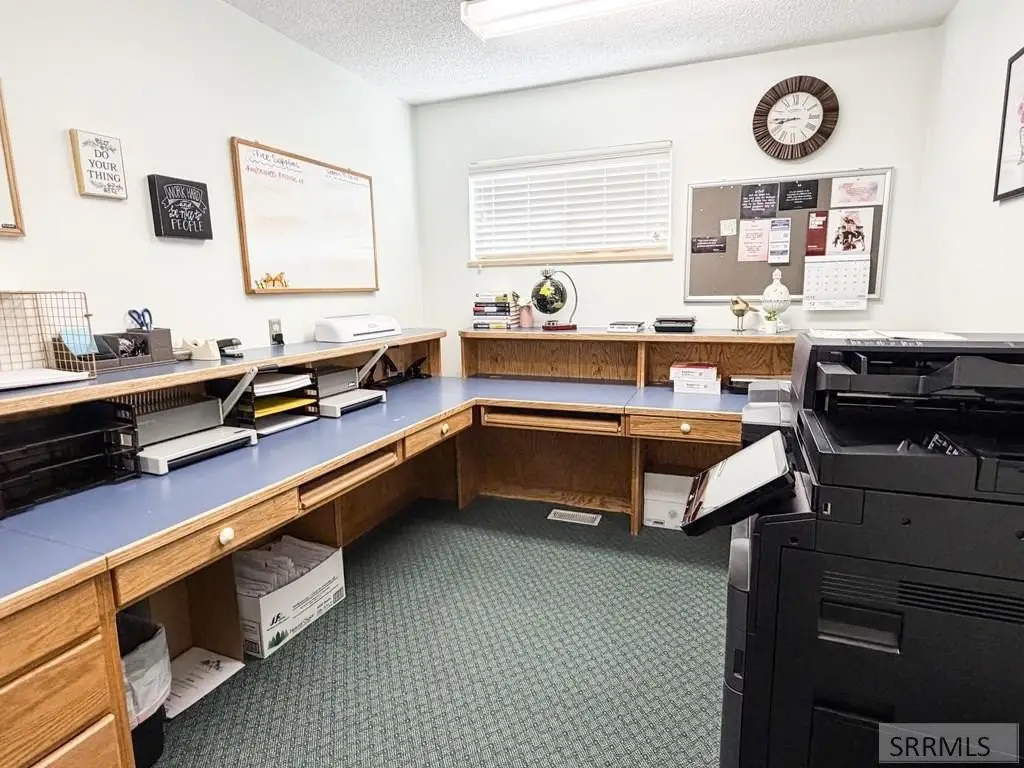
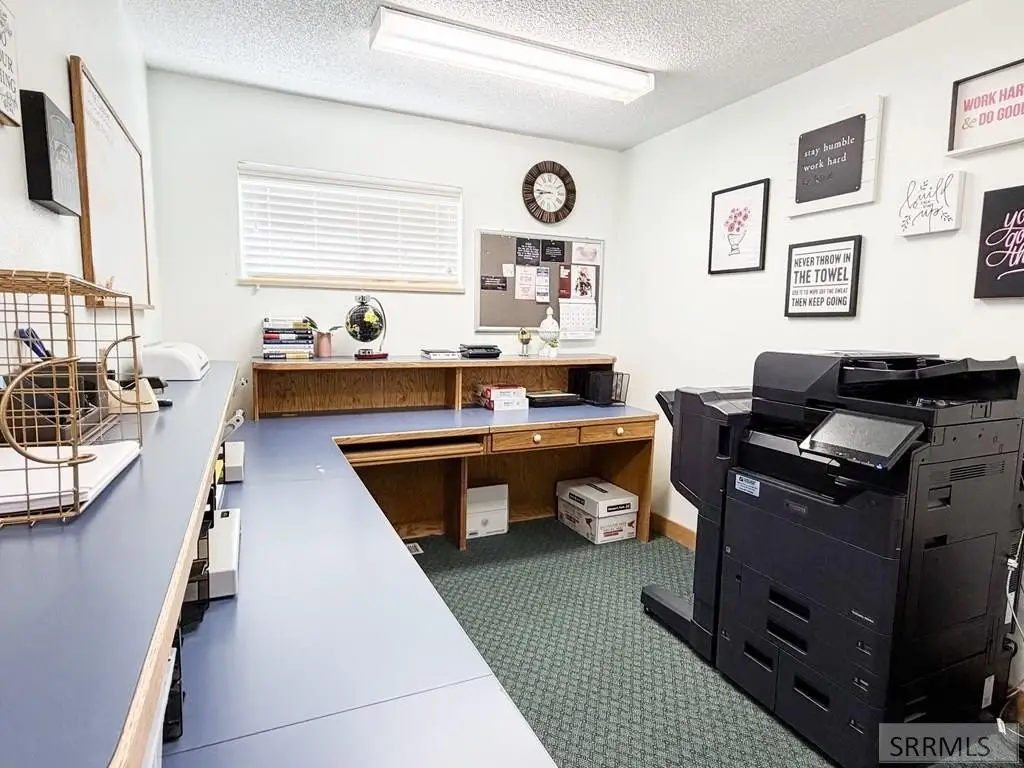
copy room
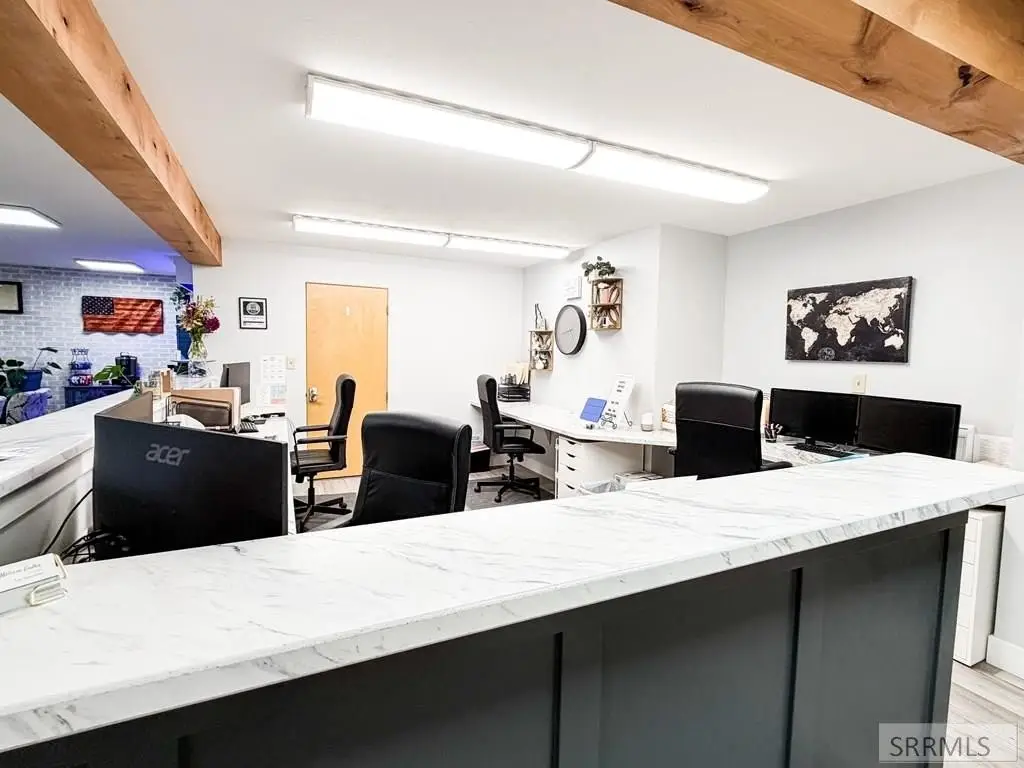
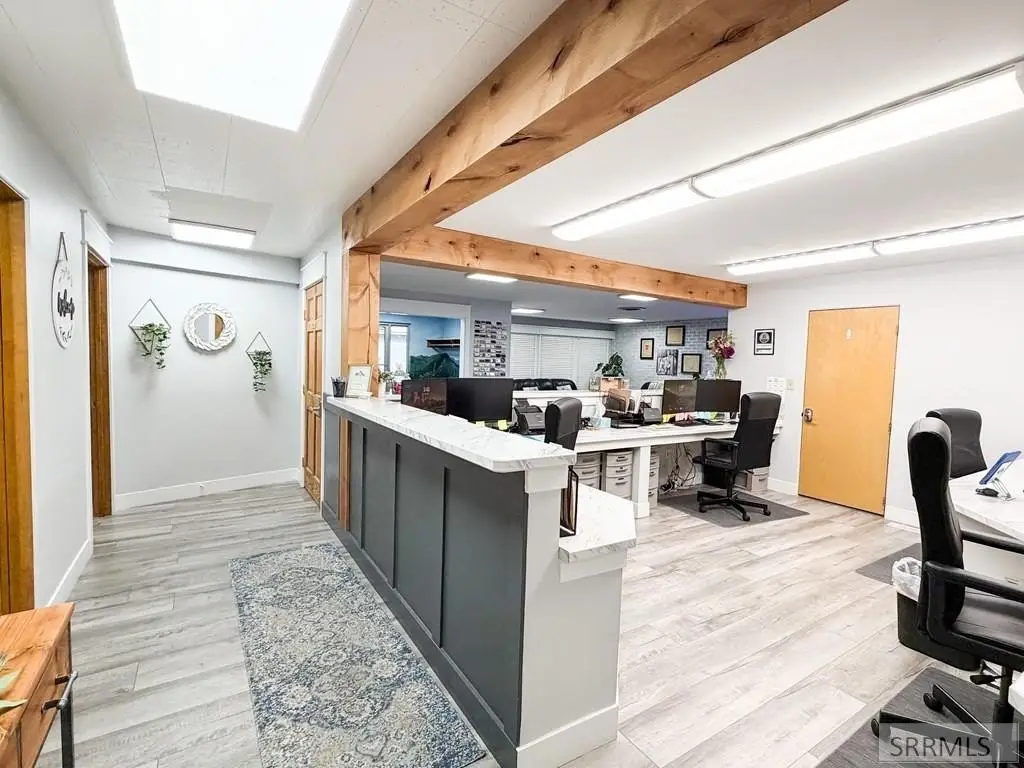
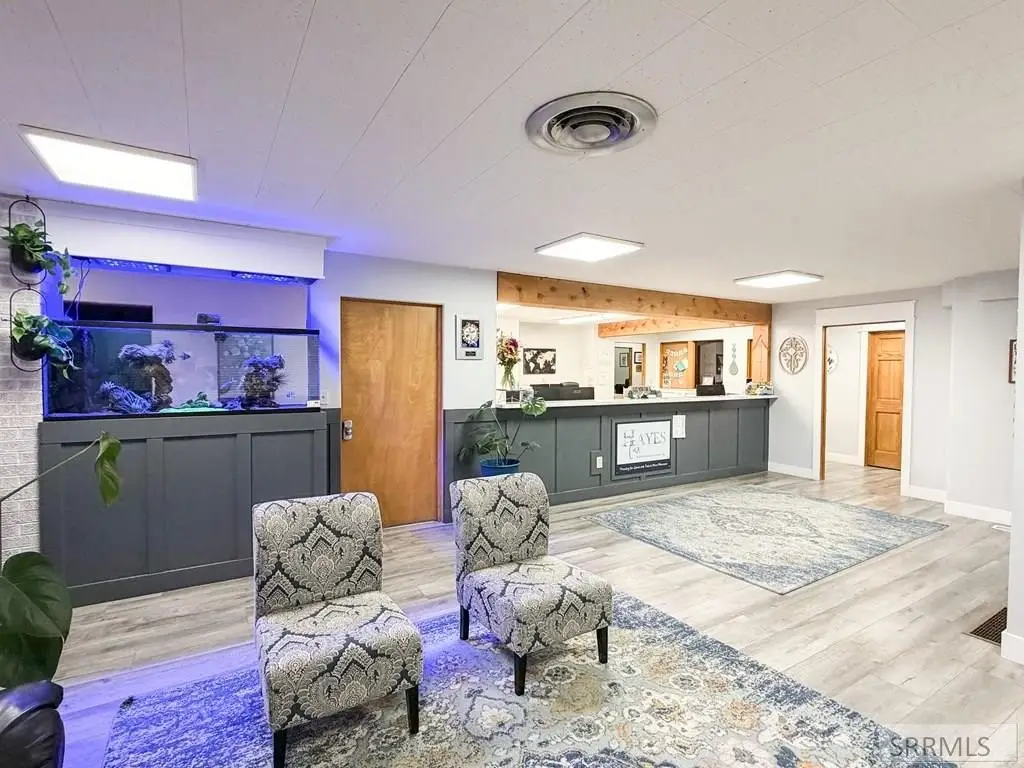
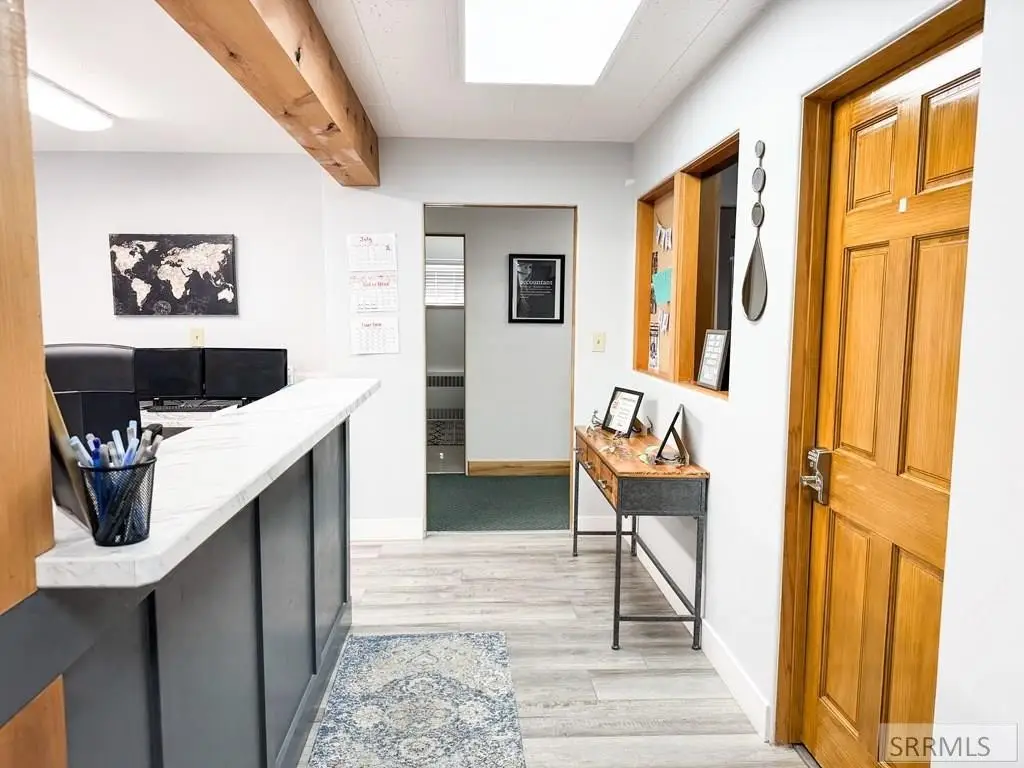
reception area
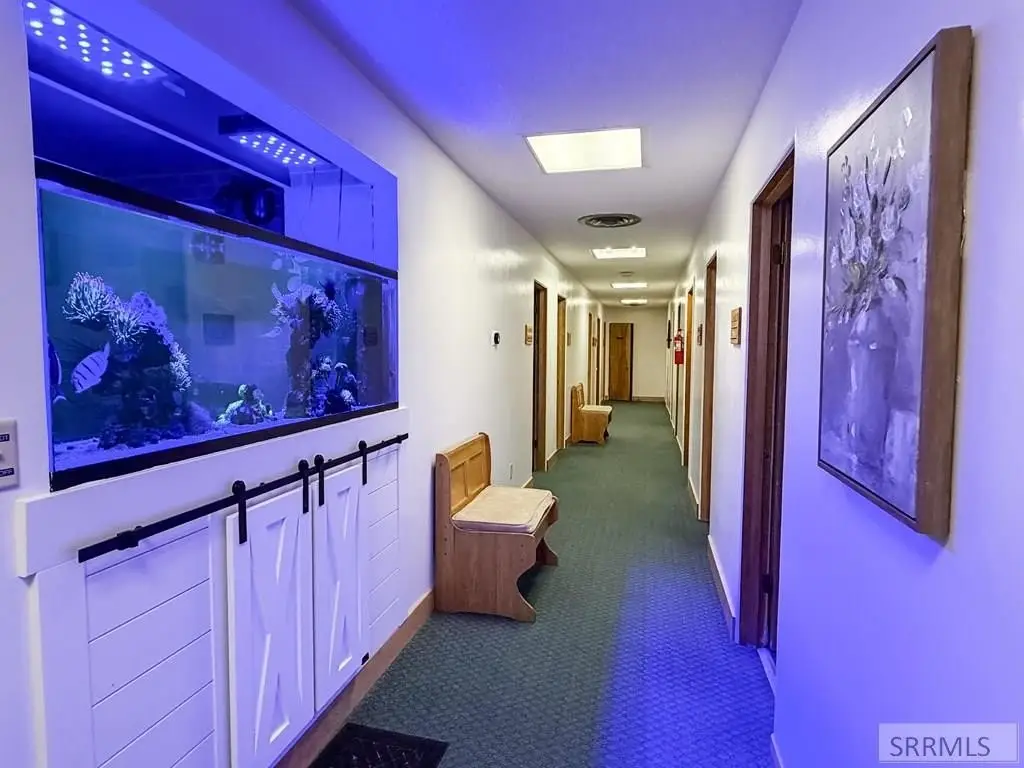
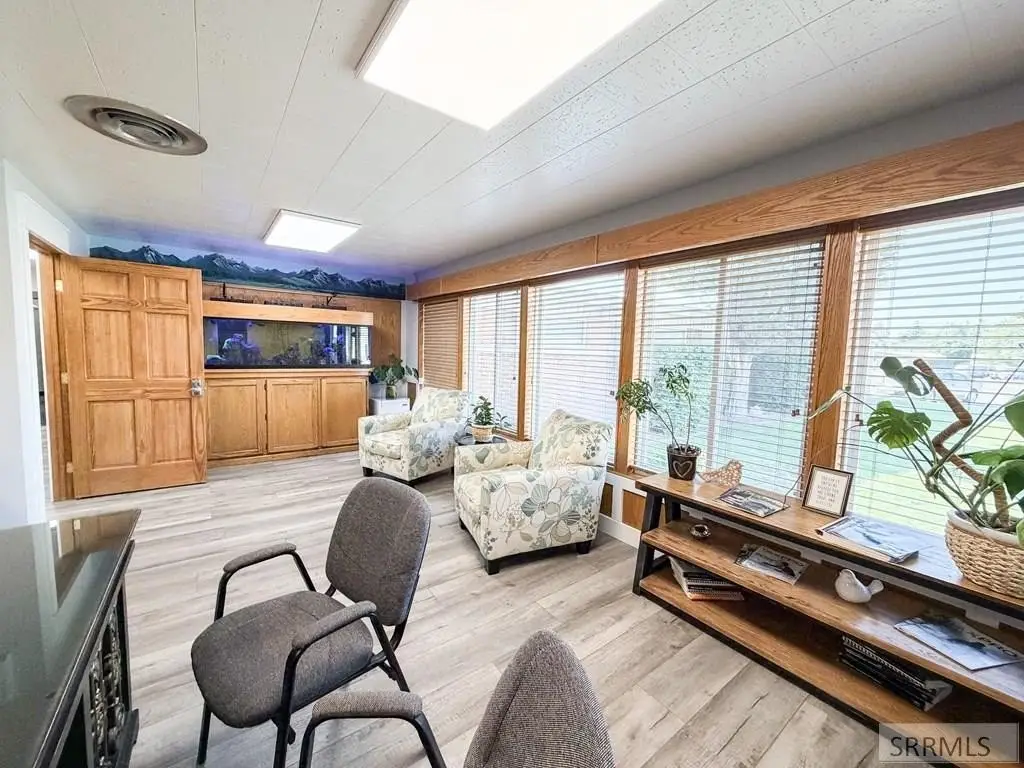
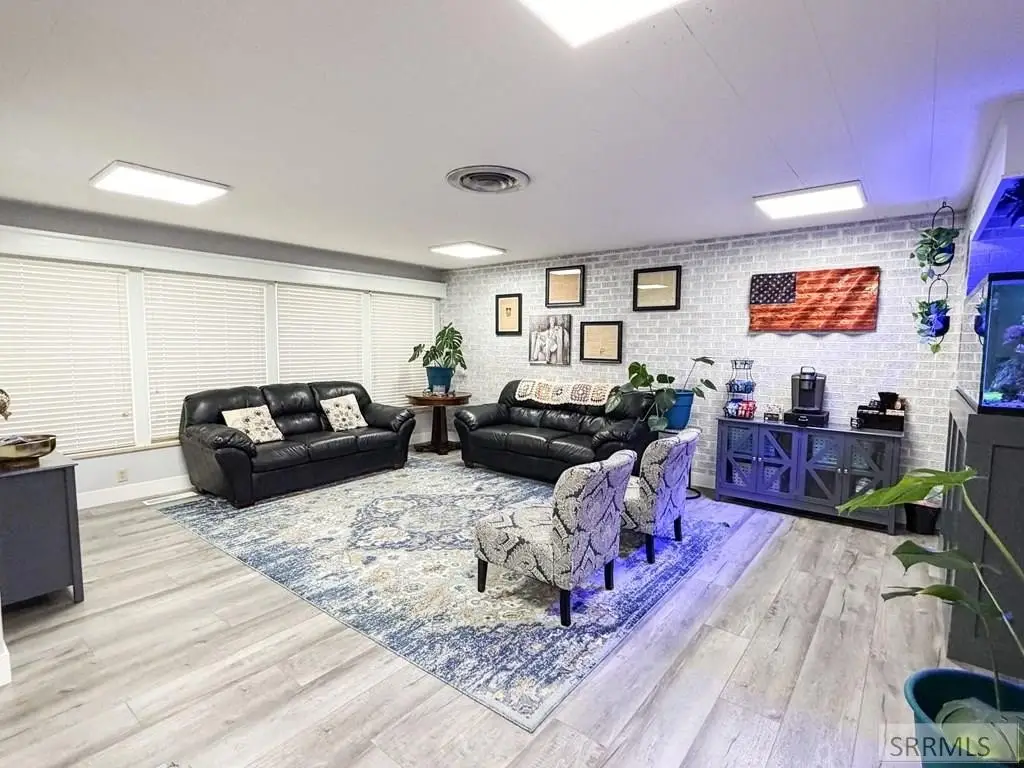
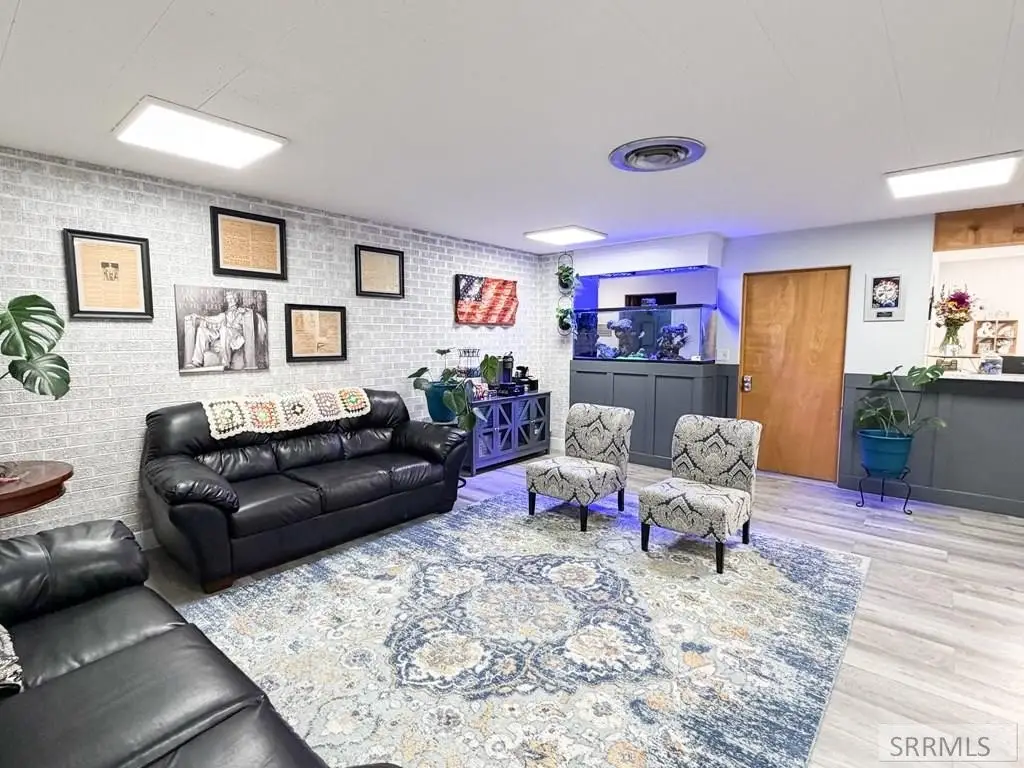
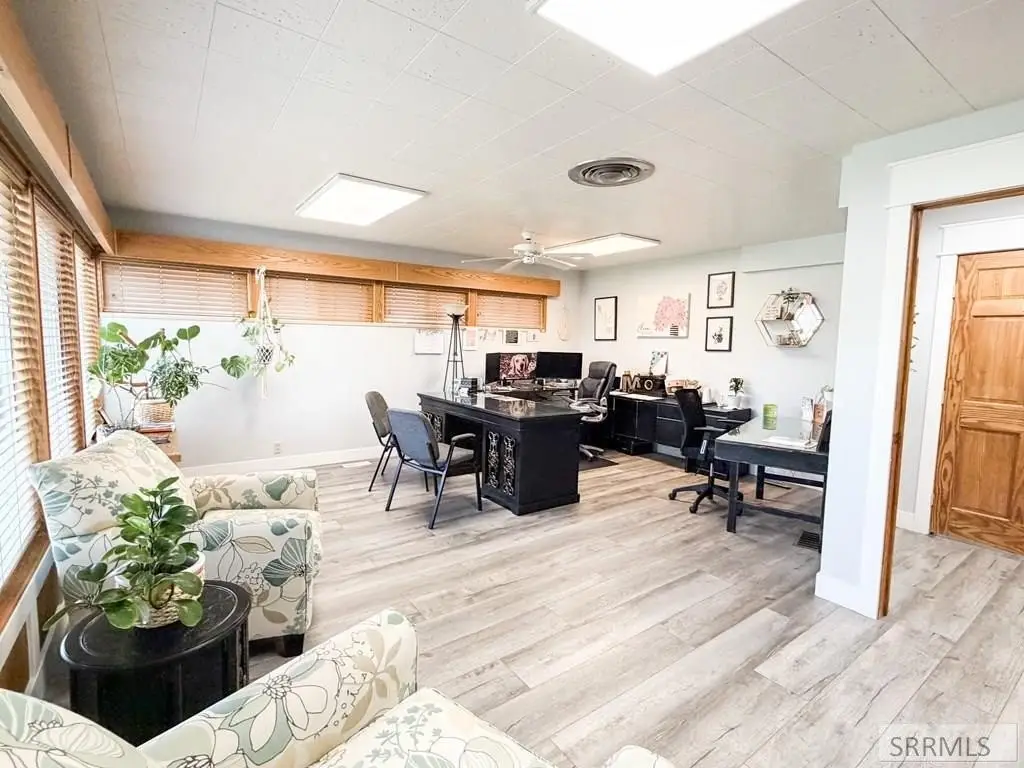
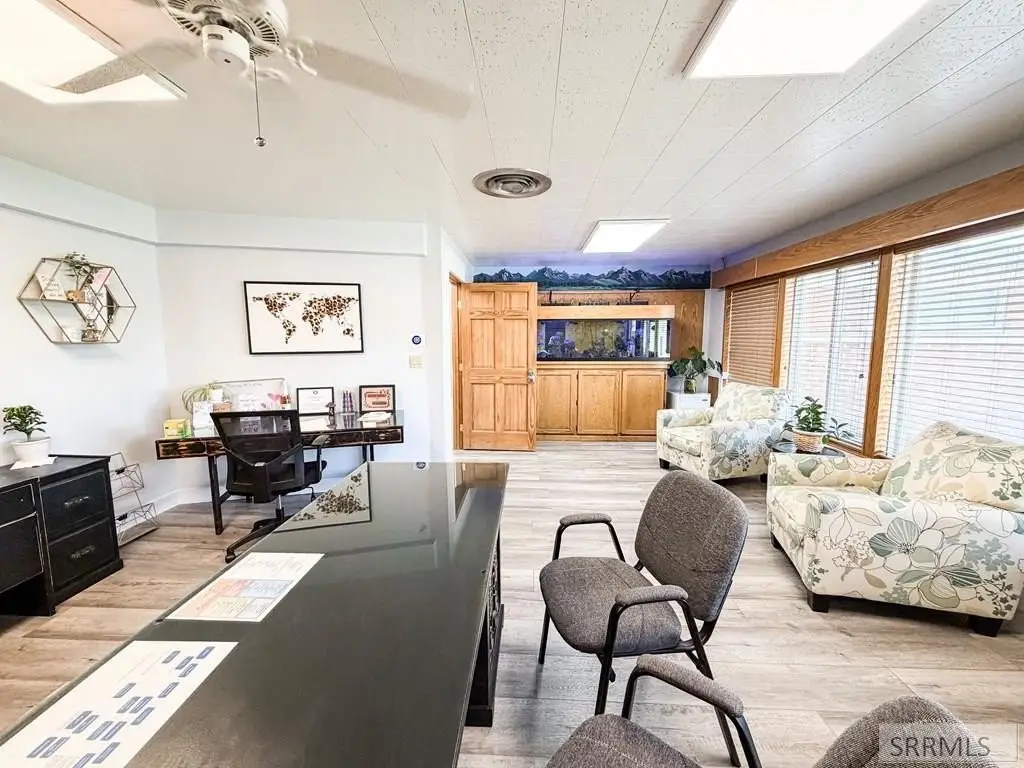
lobby with waiting area
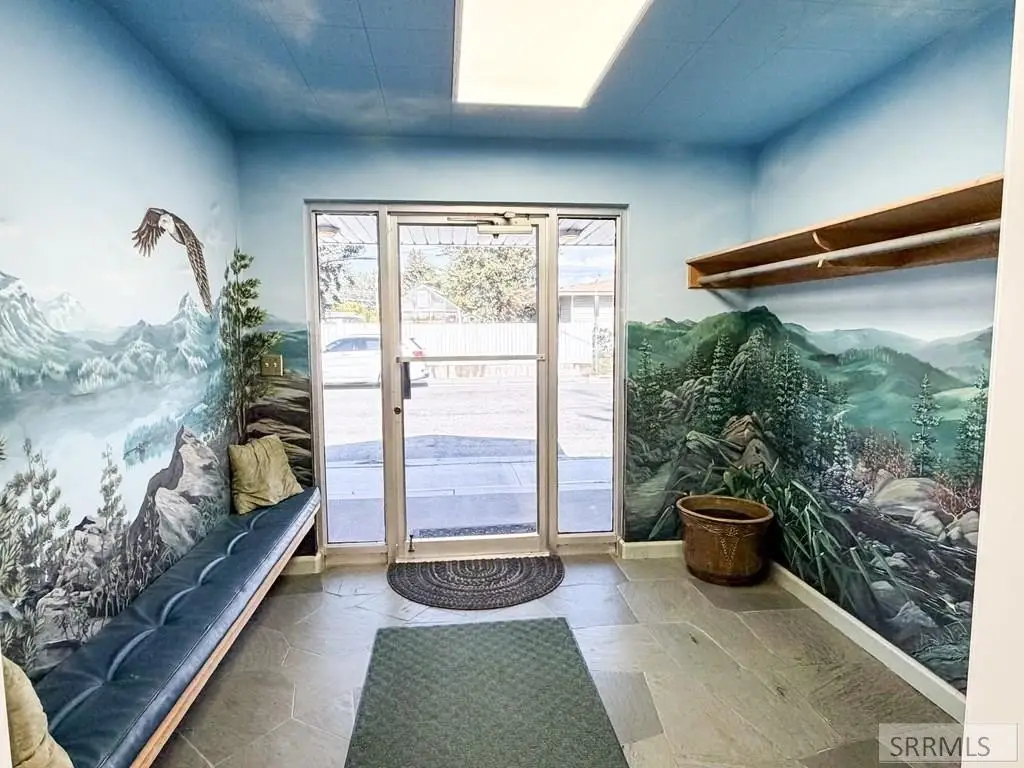
hand-painted foyer
fiber internet
forced-air natural gas heat
air conditioning
landscaped grounds
Building Details
Year built
1959
Building materials
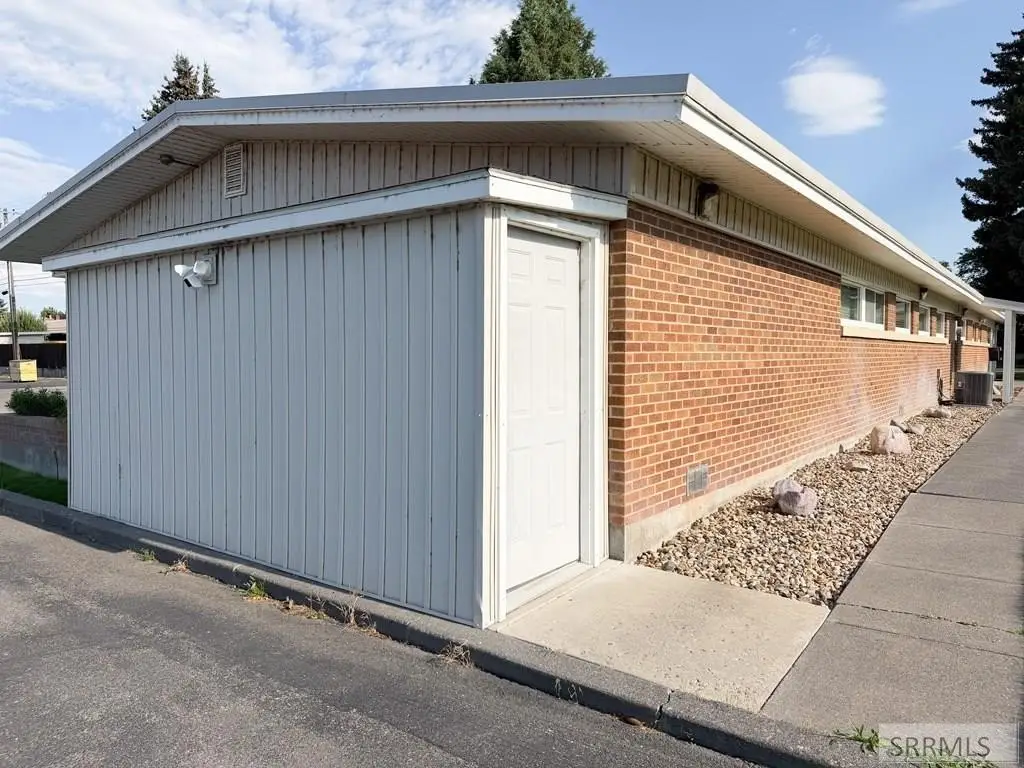
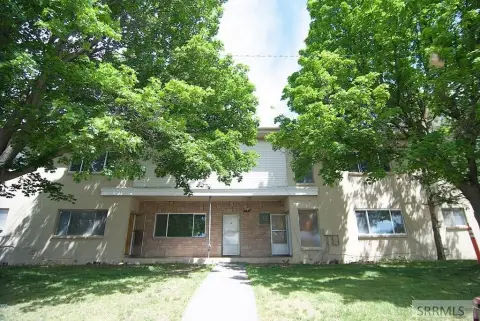
Brick
Listing Agency:
Keller Williams Realty East Idaho
Listed By:
Jody Holland
(208) 529-8888
Added: Sep 8
Changed: Oct 21
Last Checked: Oct 24 at 2:06AM
MLS# 2187864
Copyright © 2026 Snake River Regional MLS. All rights reserved. All information provided by the listing agent/broker is deemed reliable but is not guaranteed and should be independently verified.

Ask AI about this property
Review the available facts, identify missing information and prepare questions for the agent.
Investment Insights
Based on property information with market context.
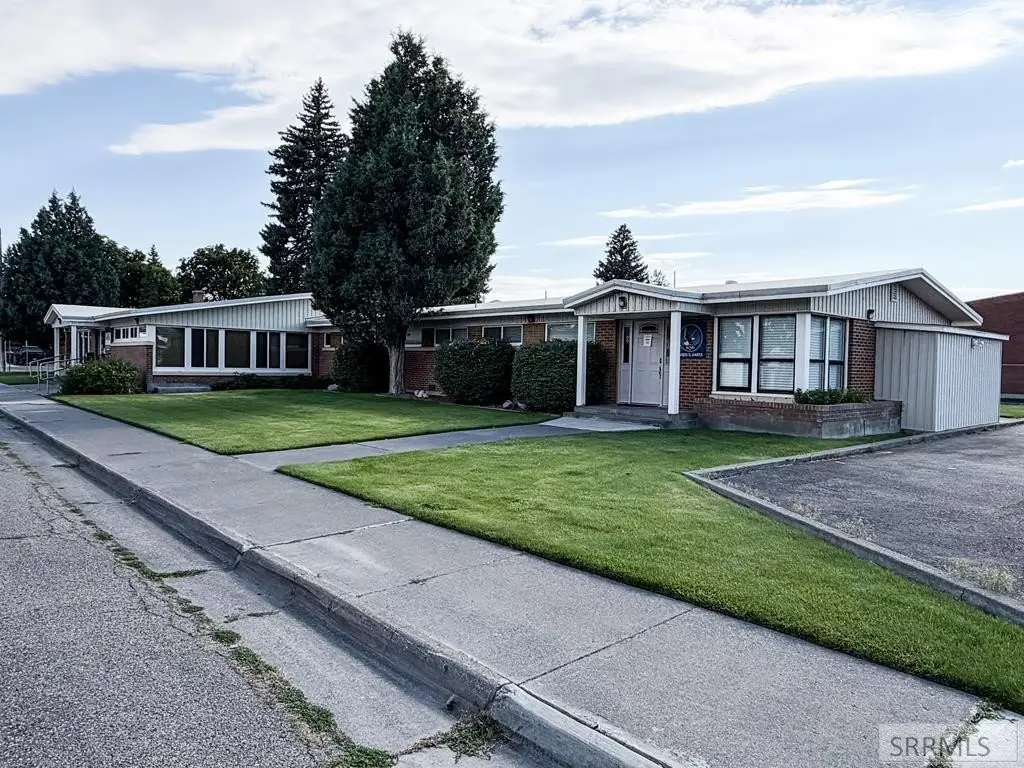
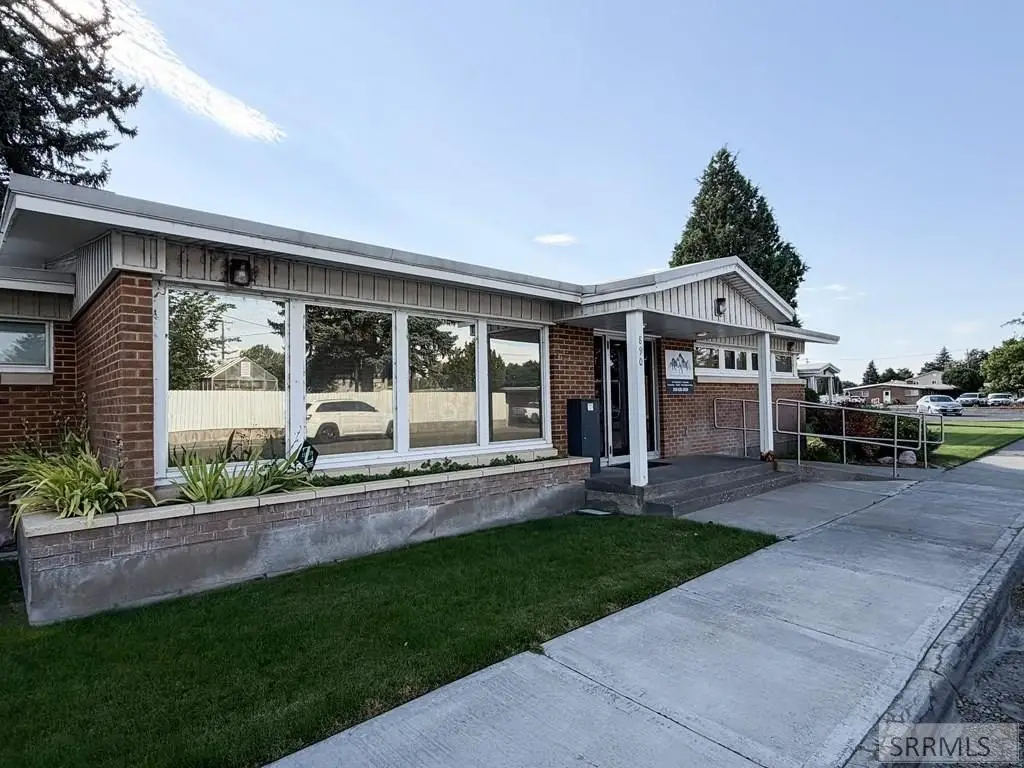
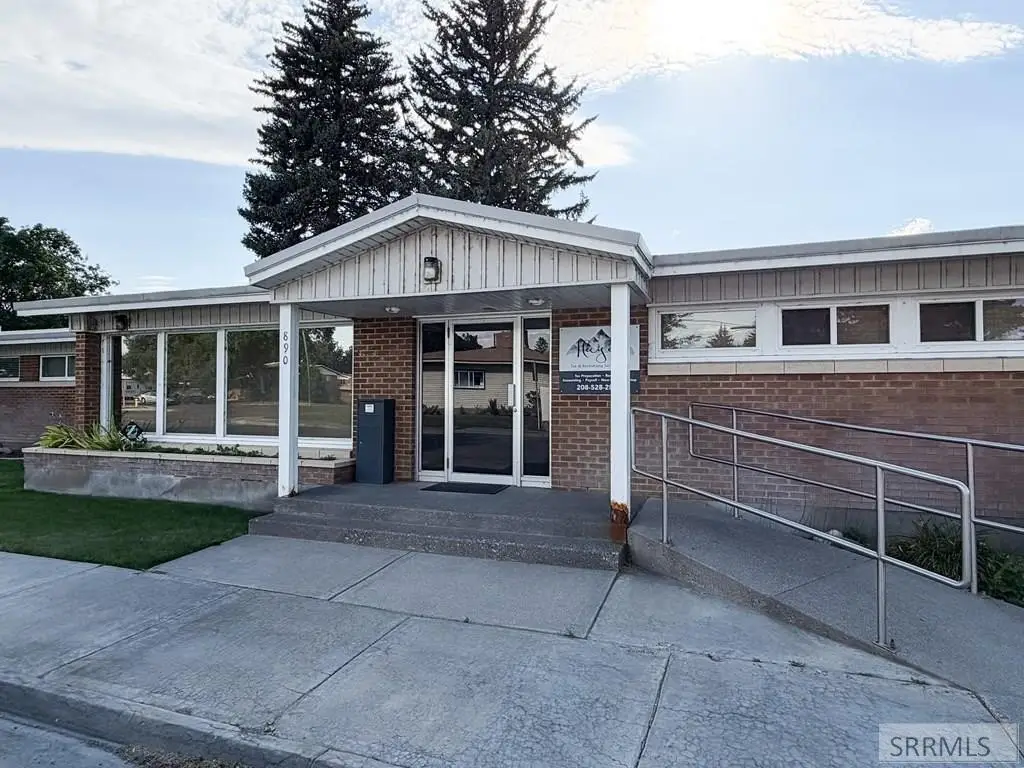
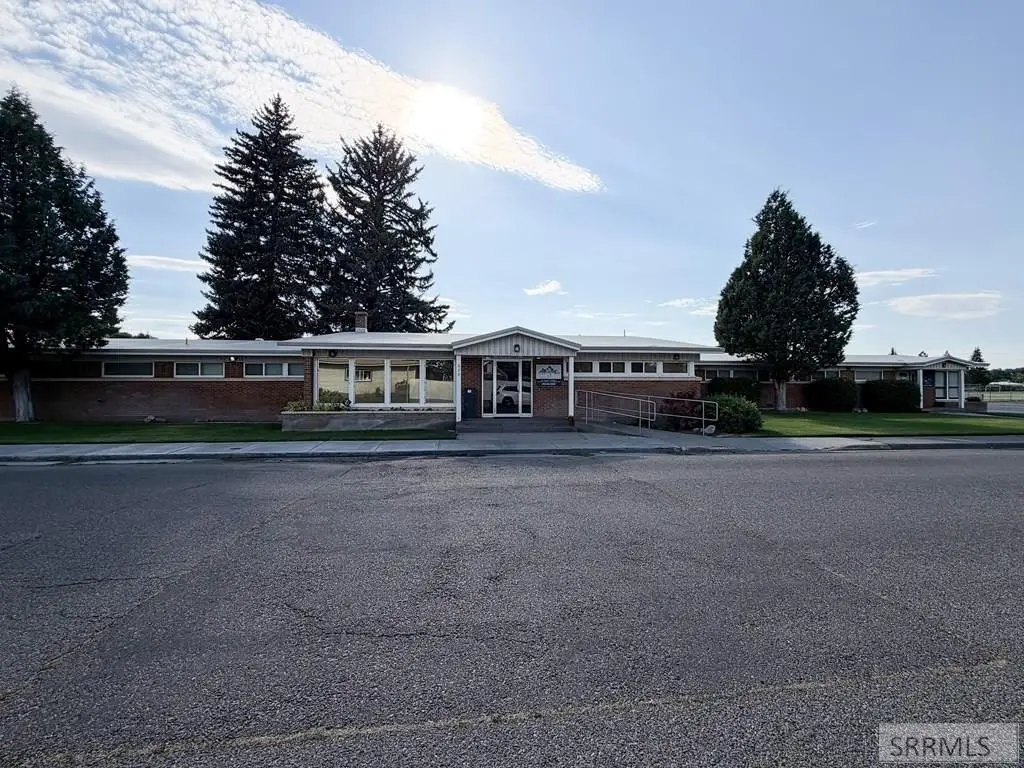
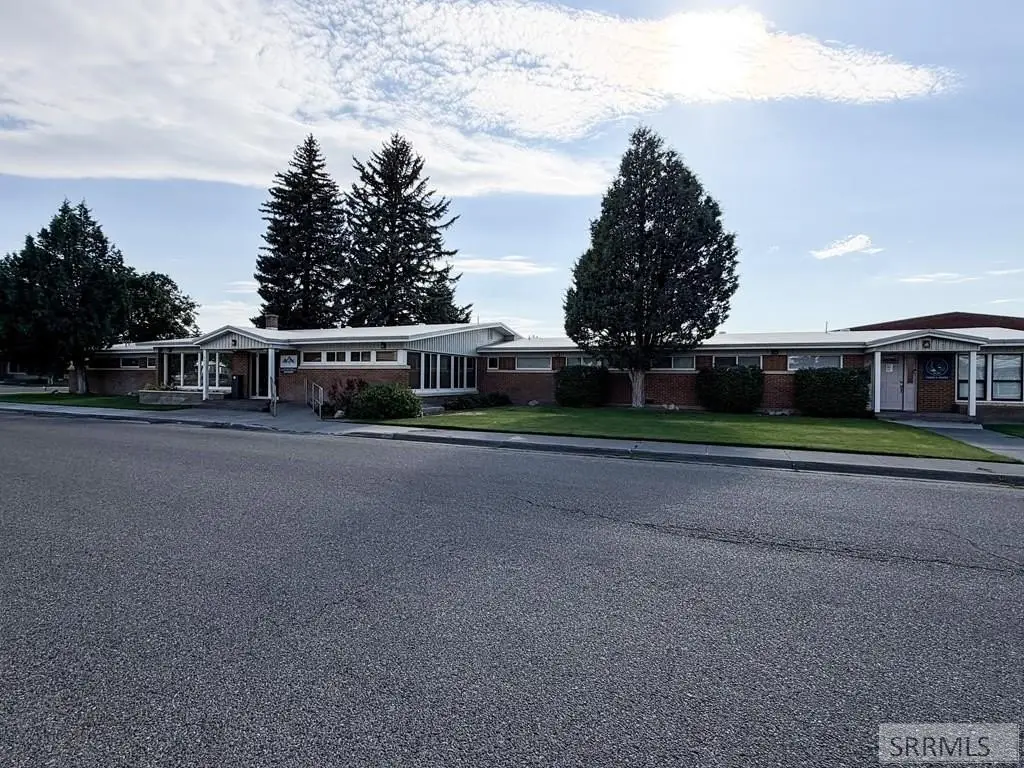
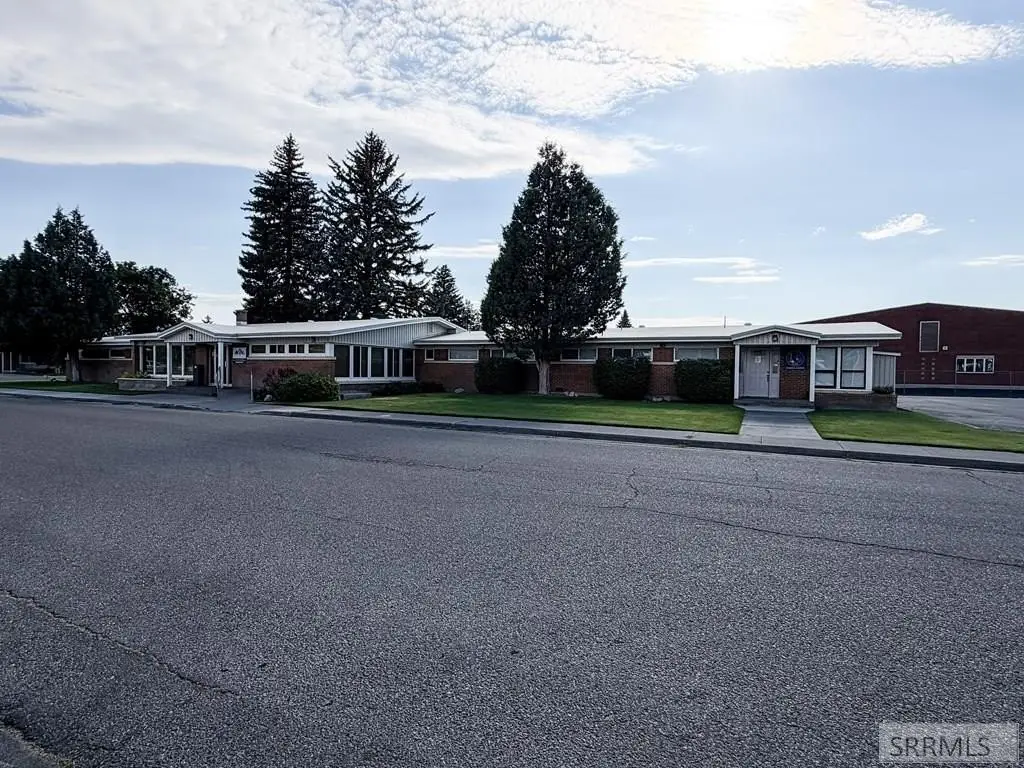
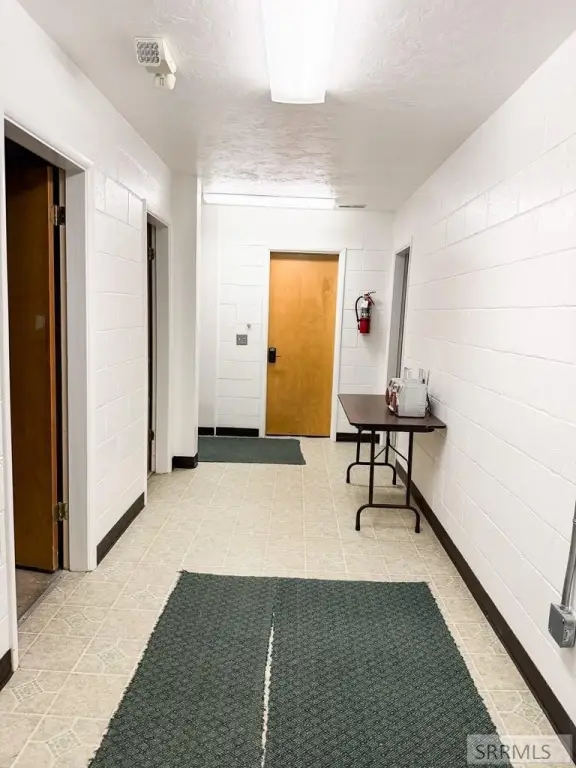
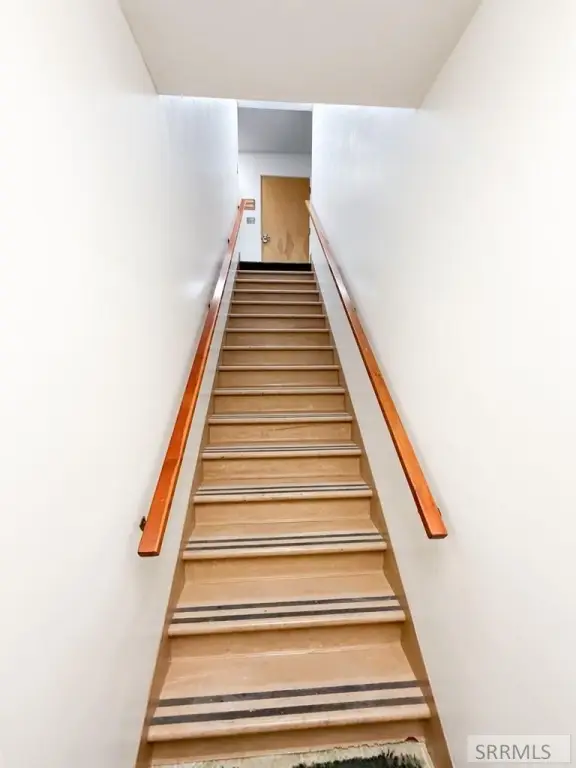
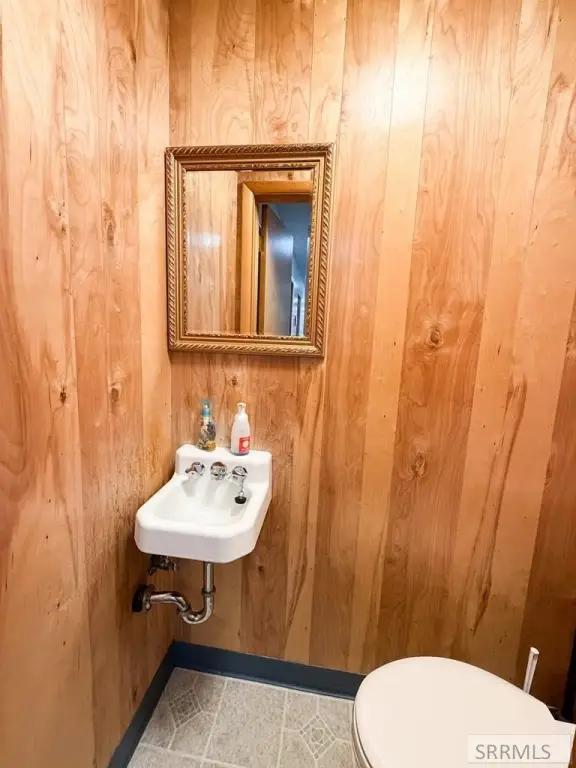
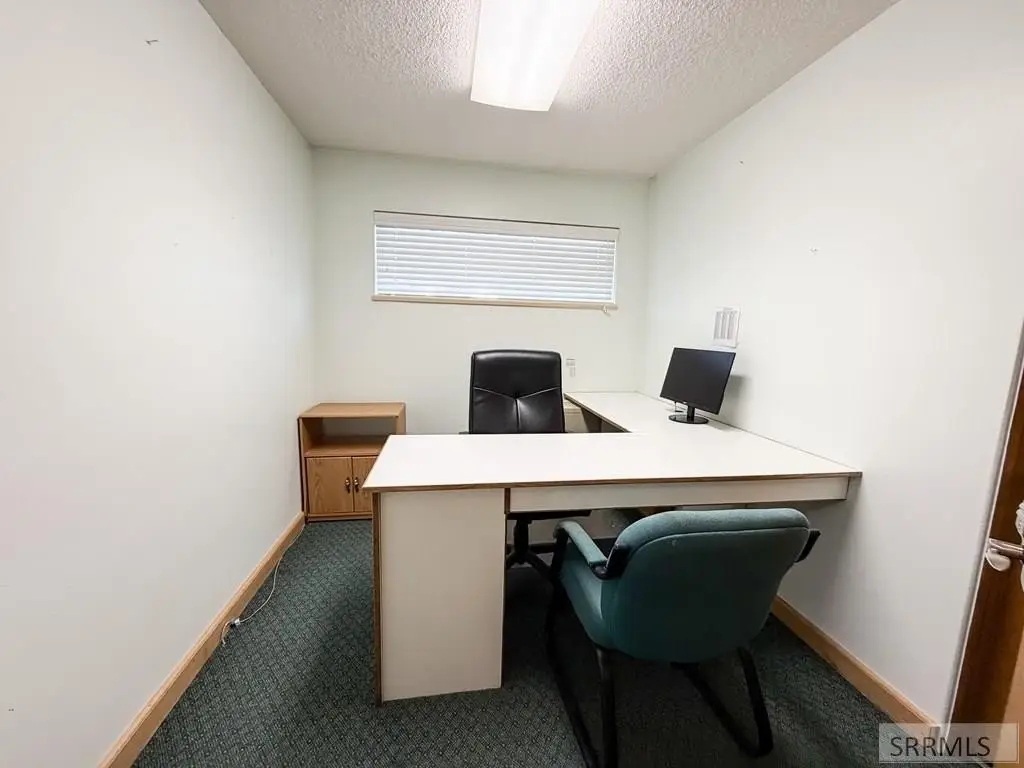
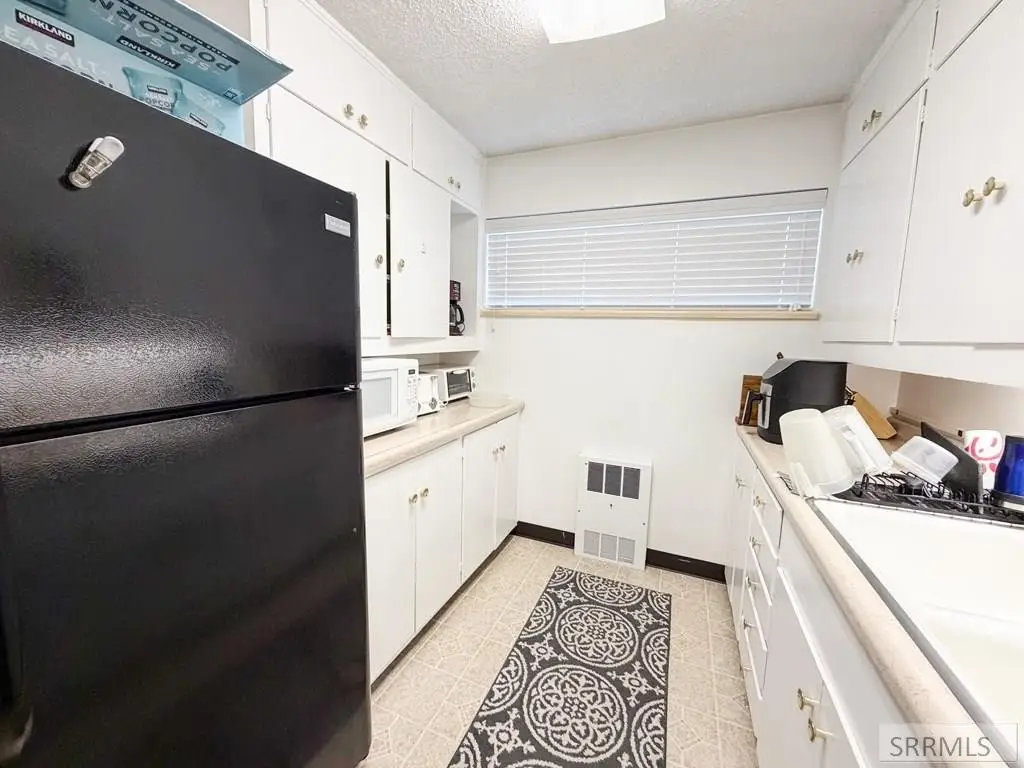
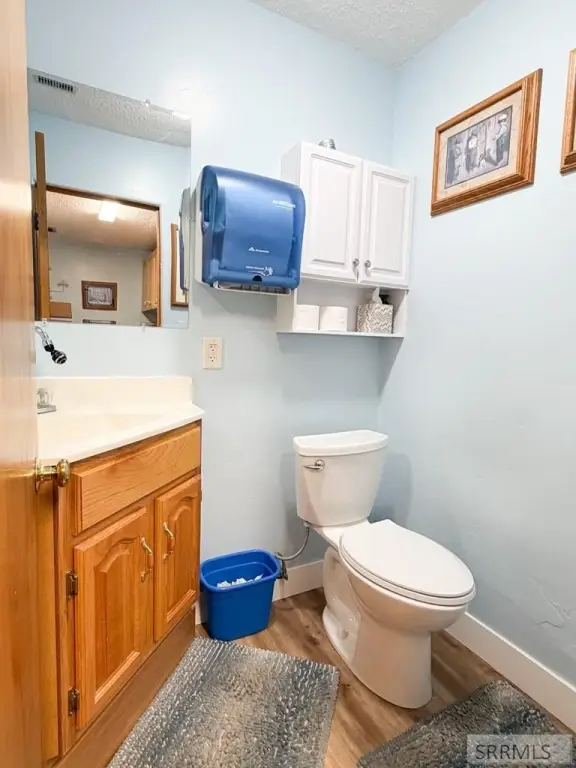
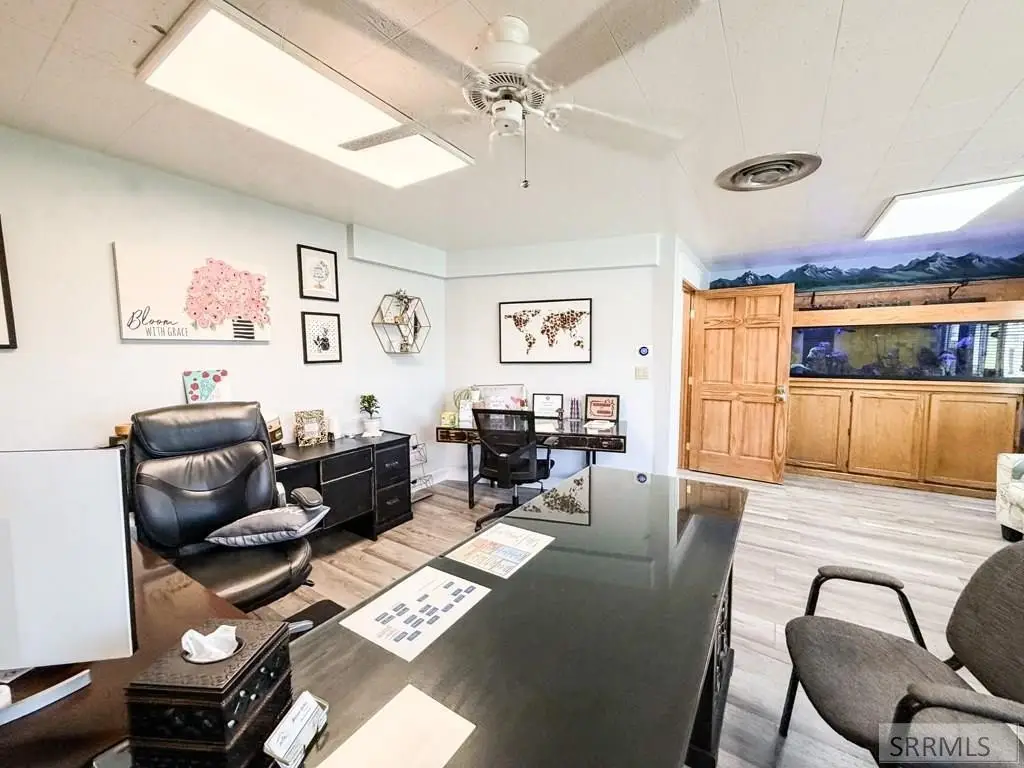
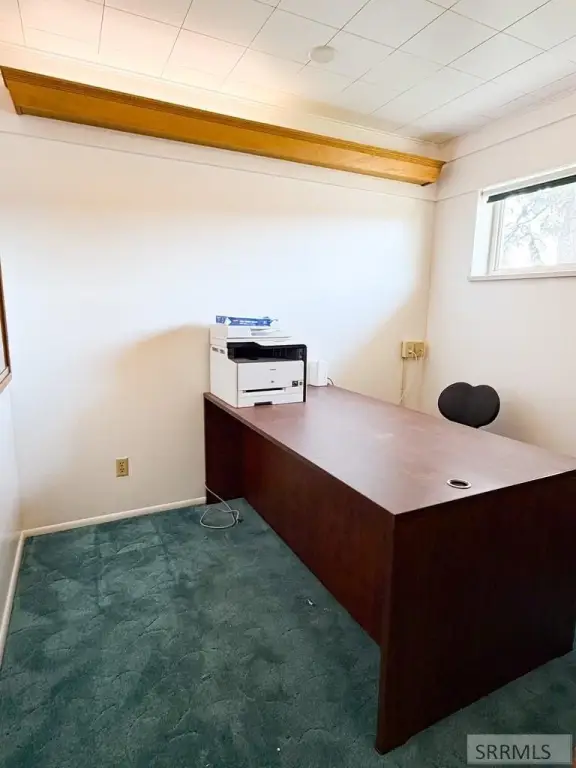
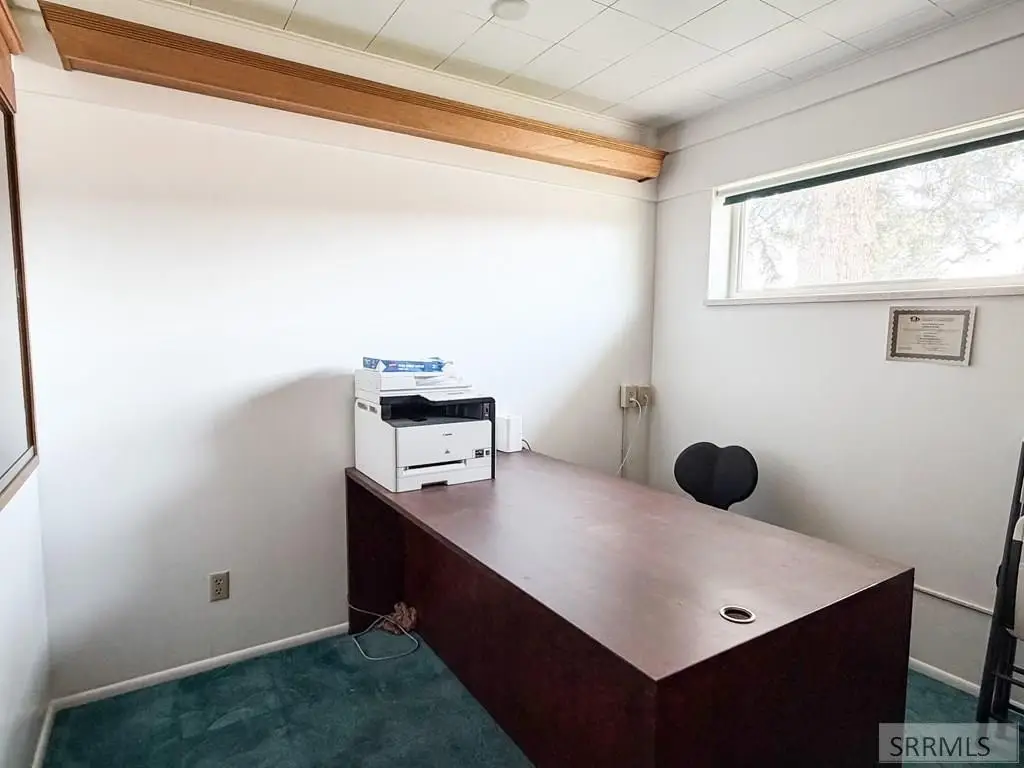
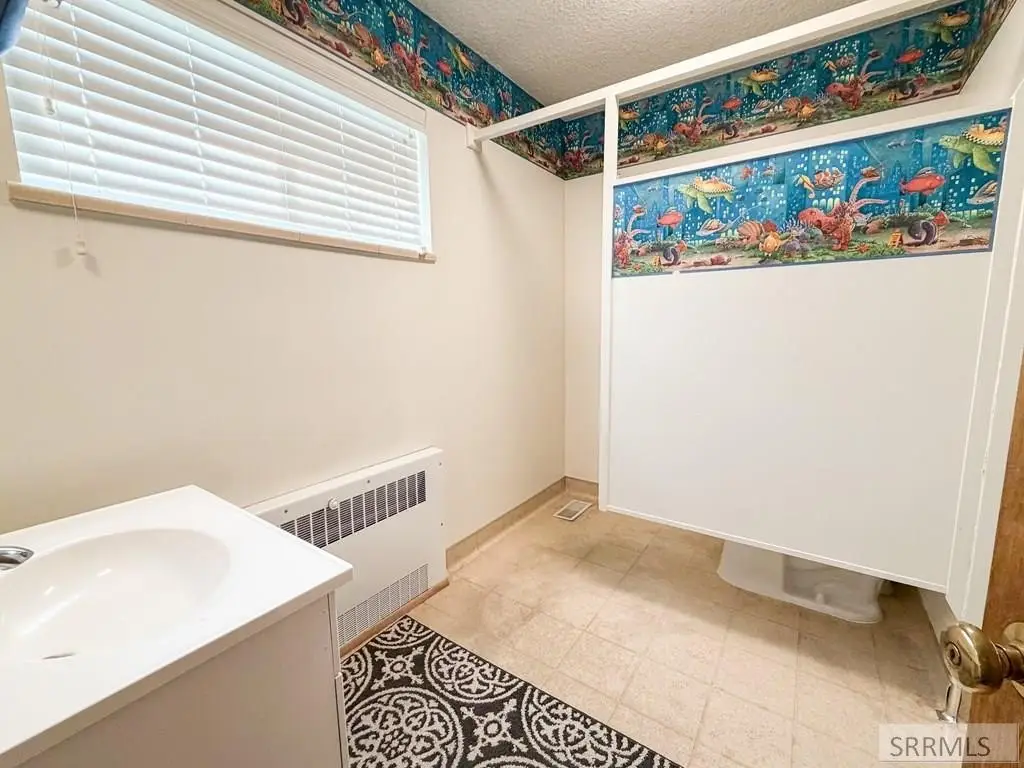
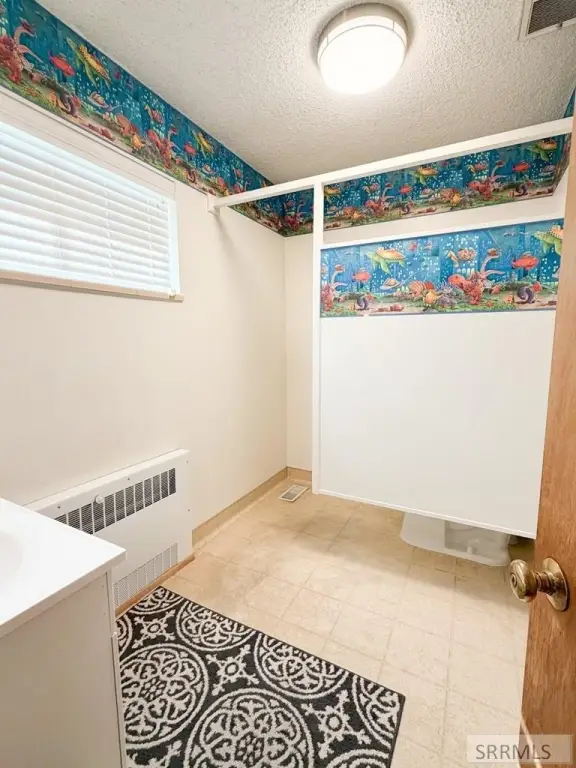
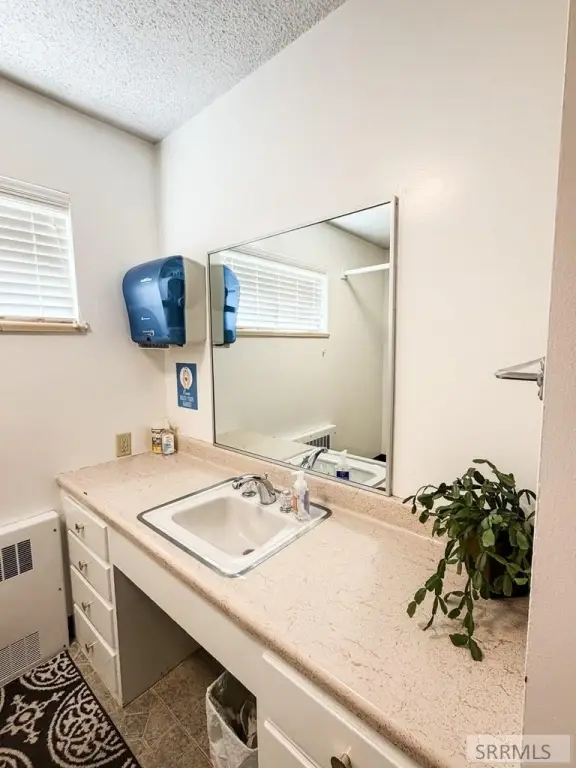
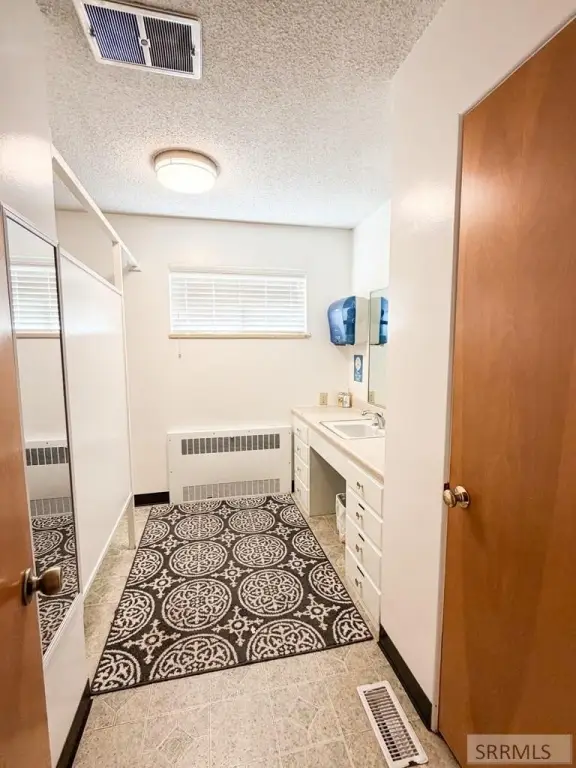
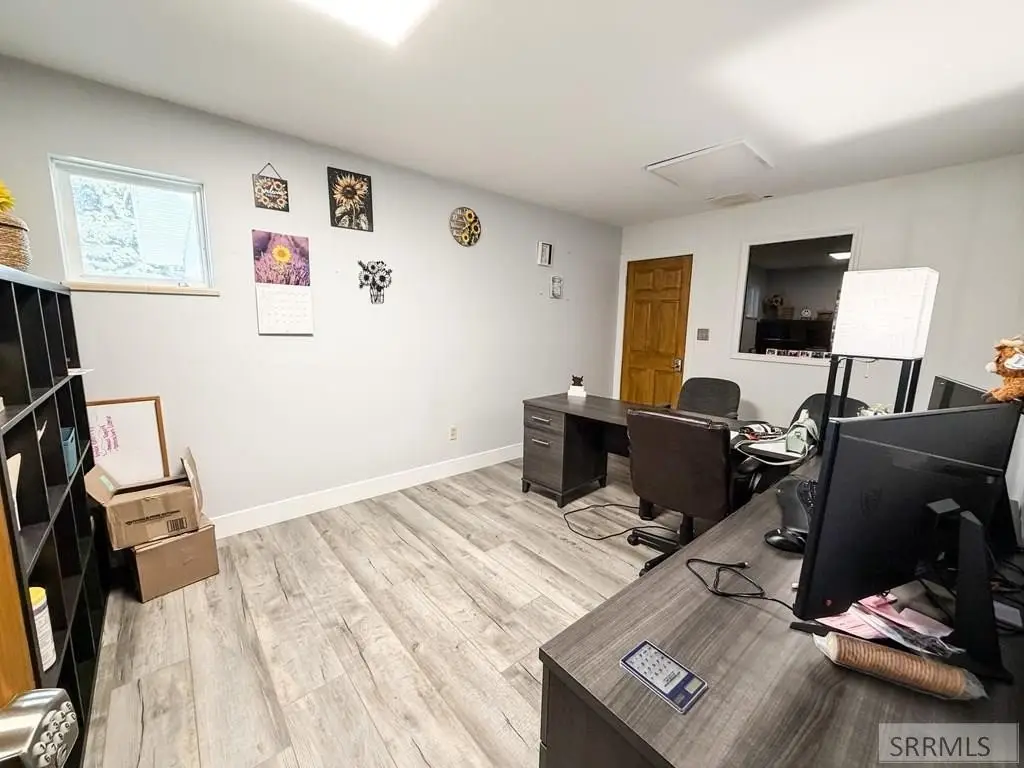
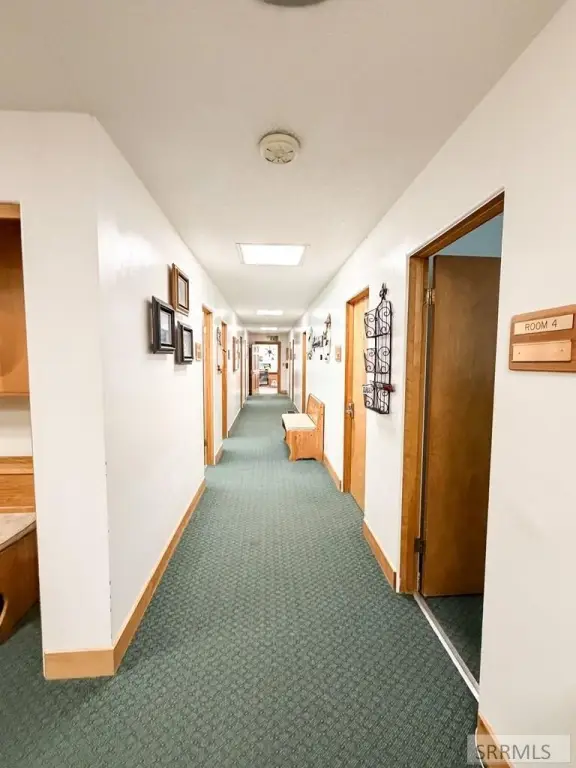
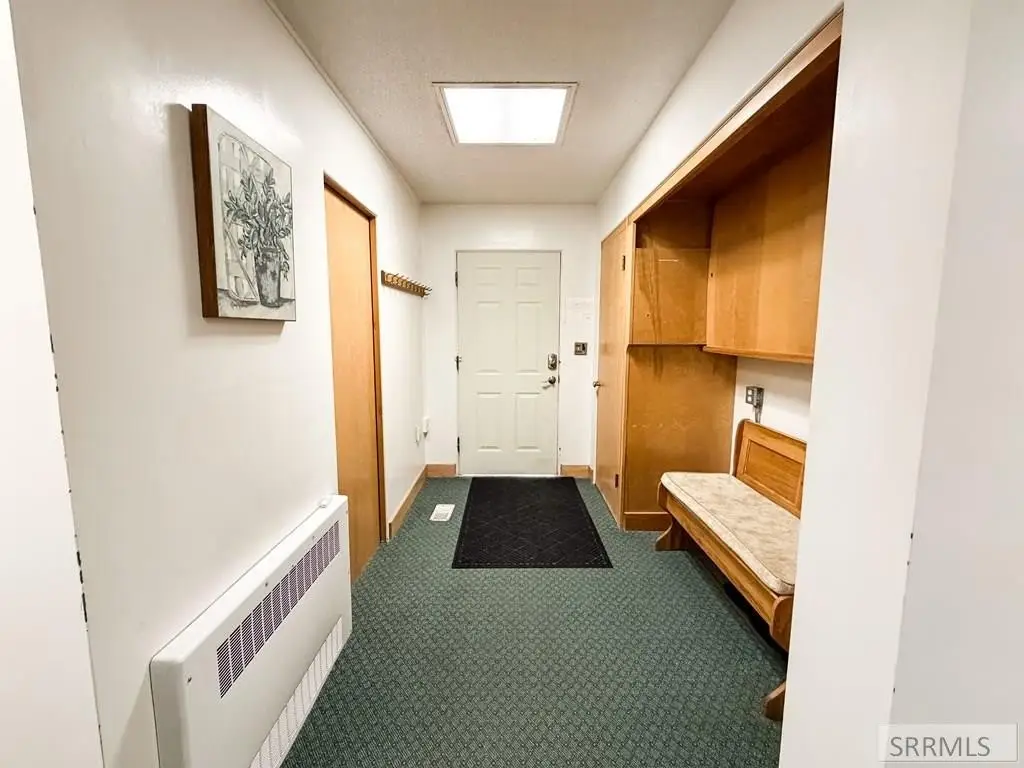
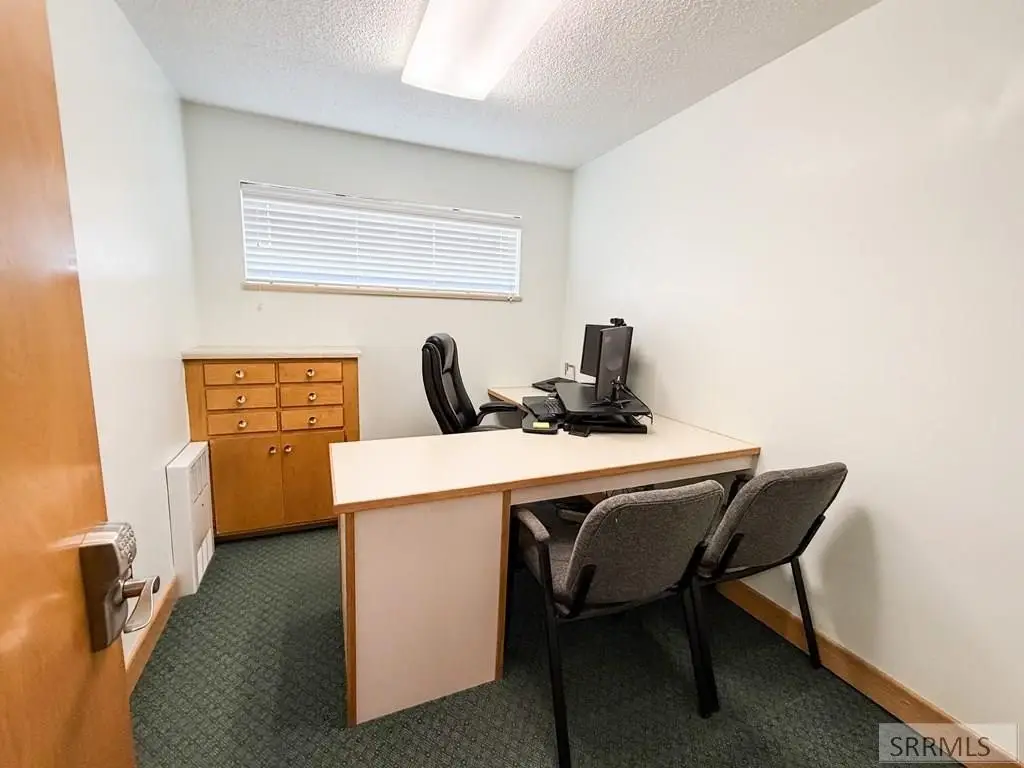
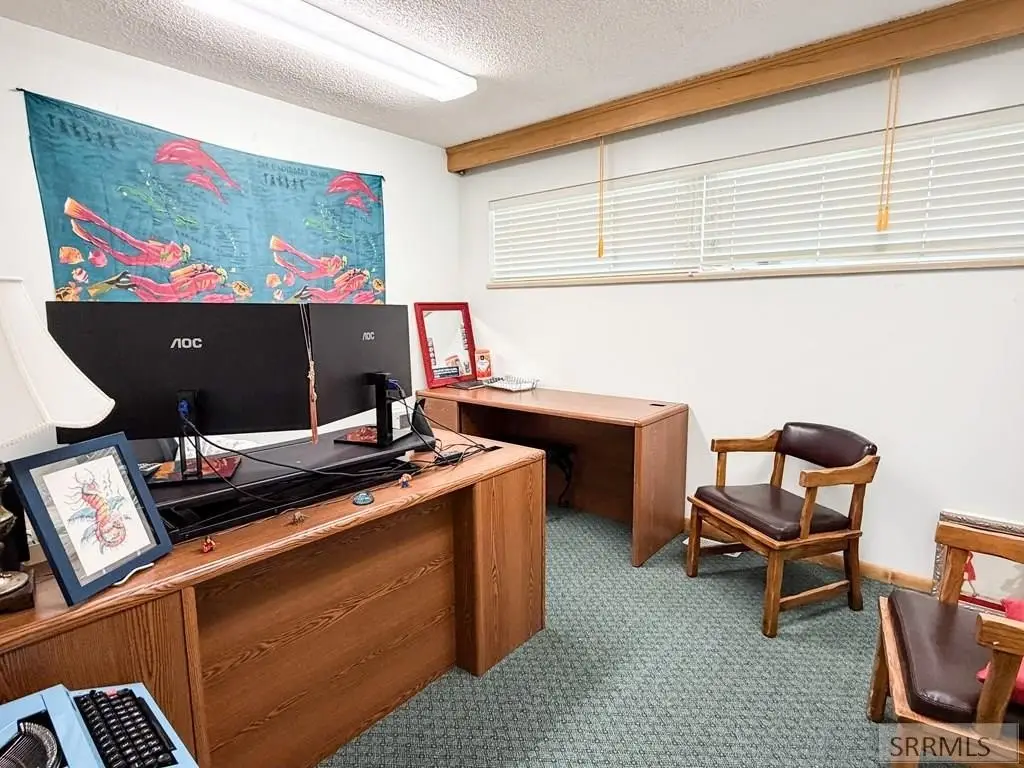
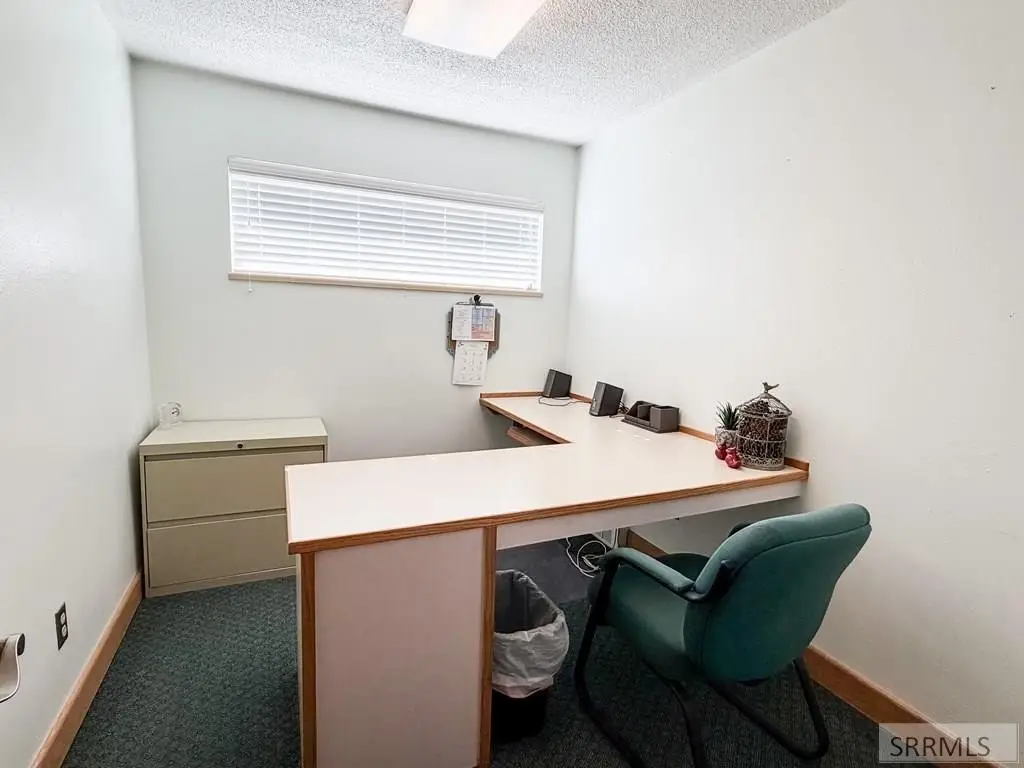
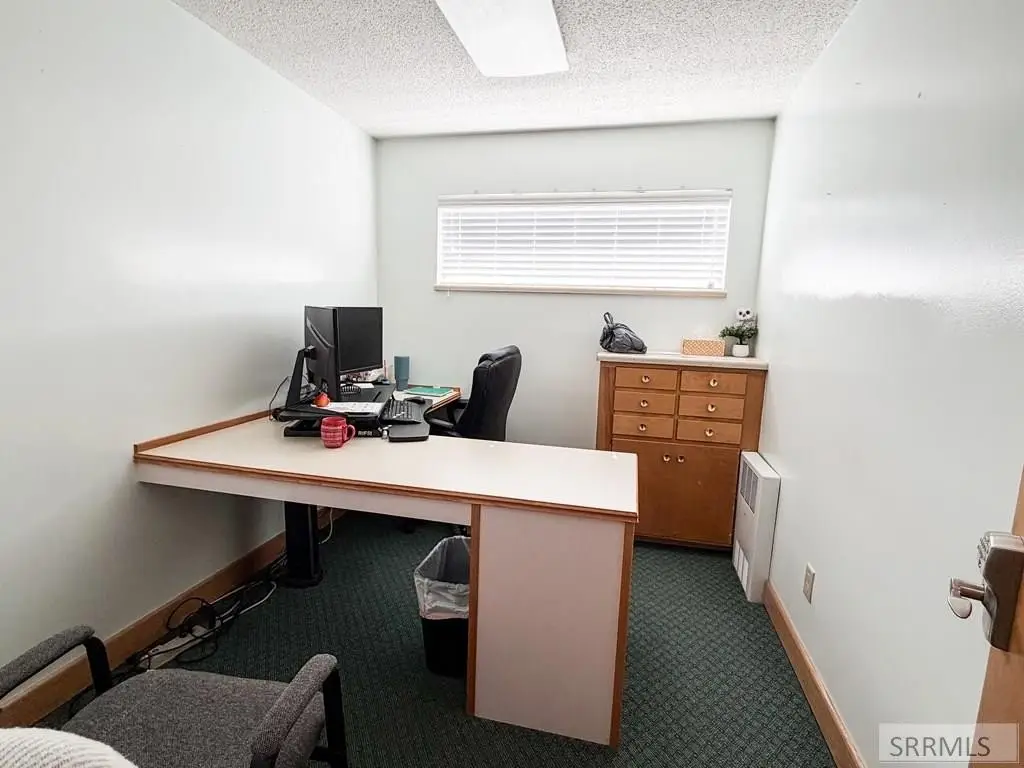
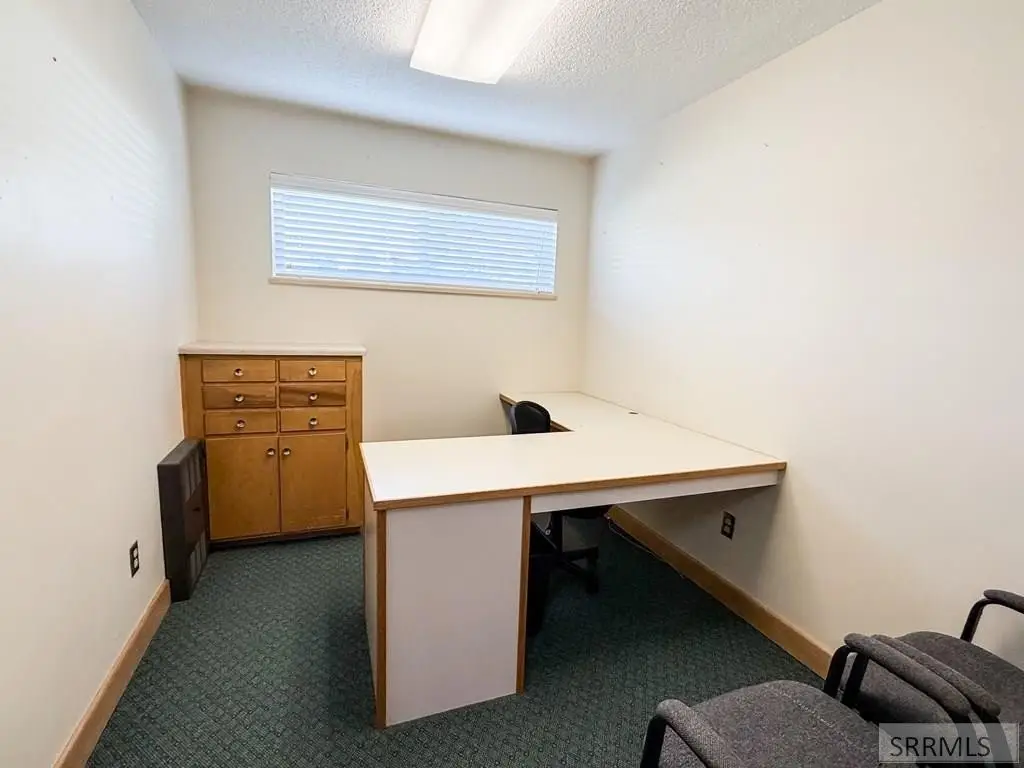
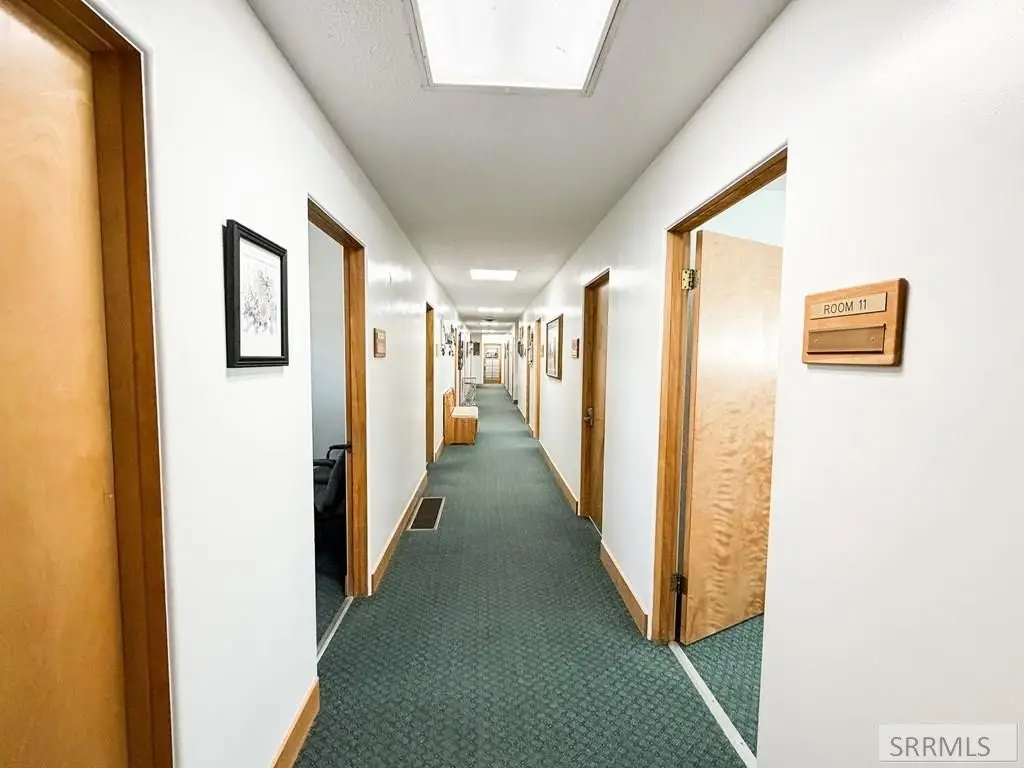
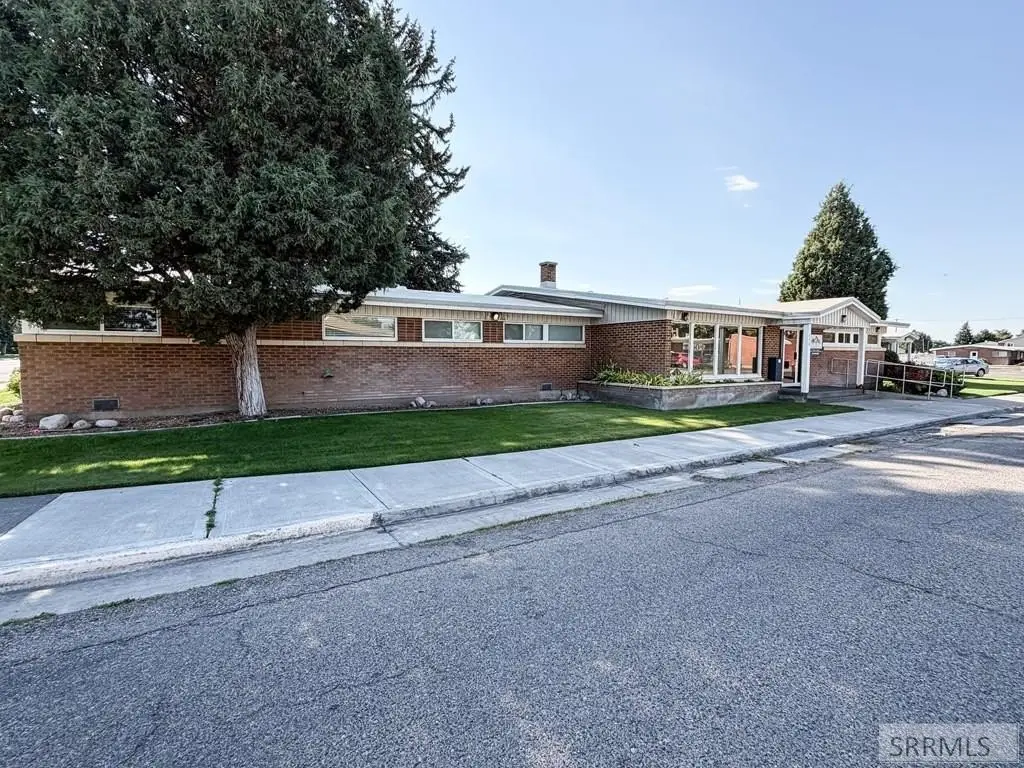
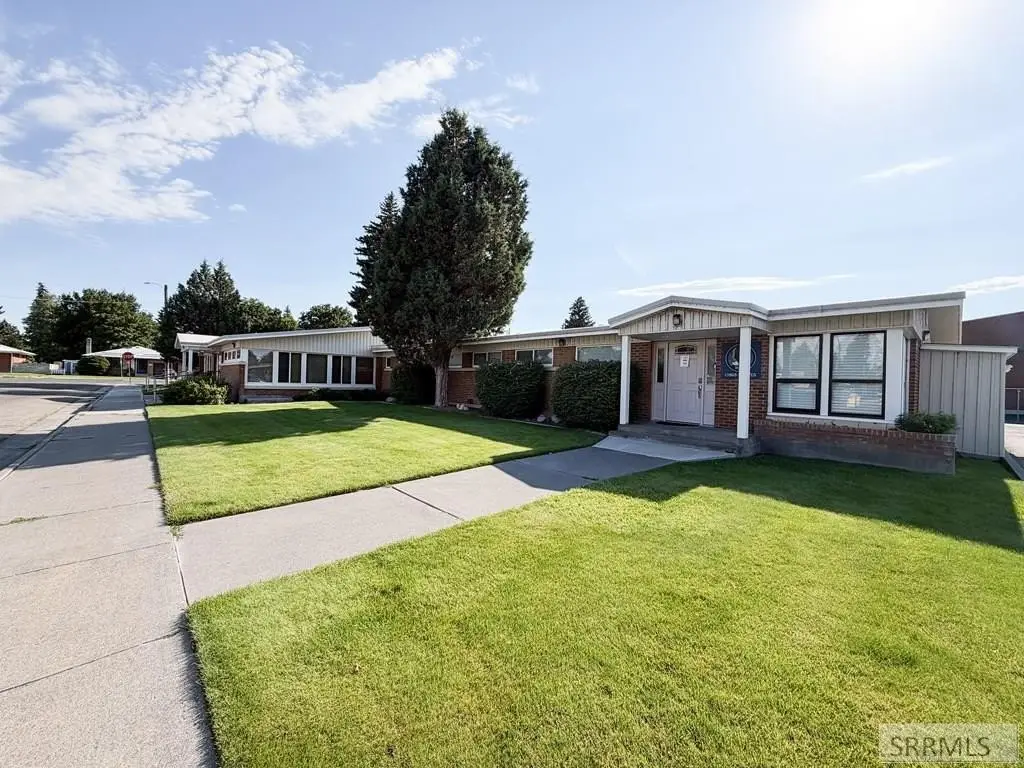
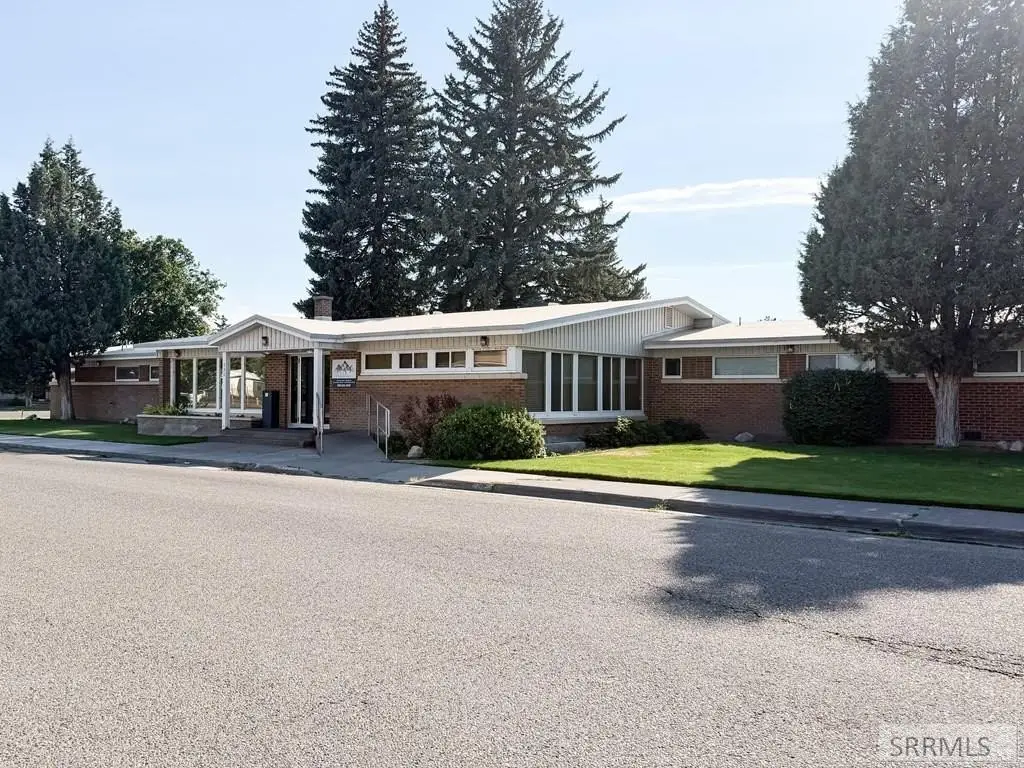
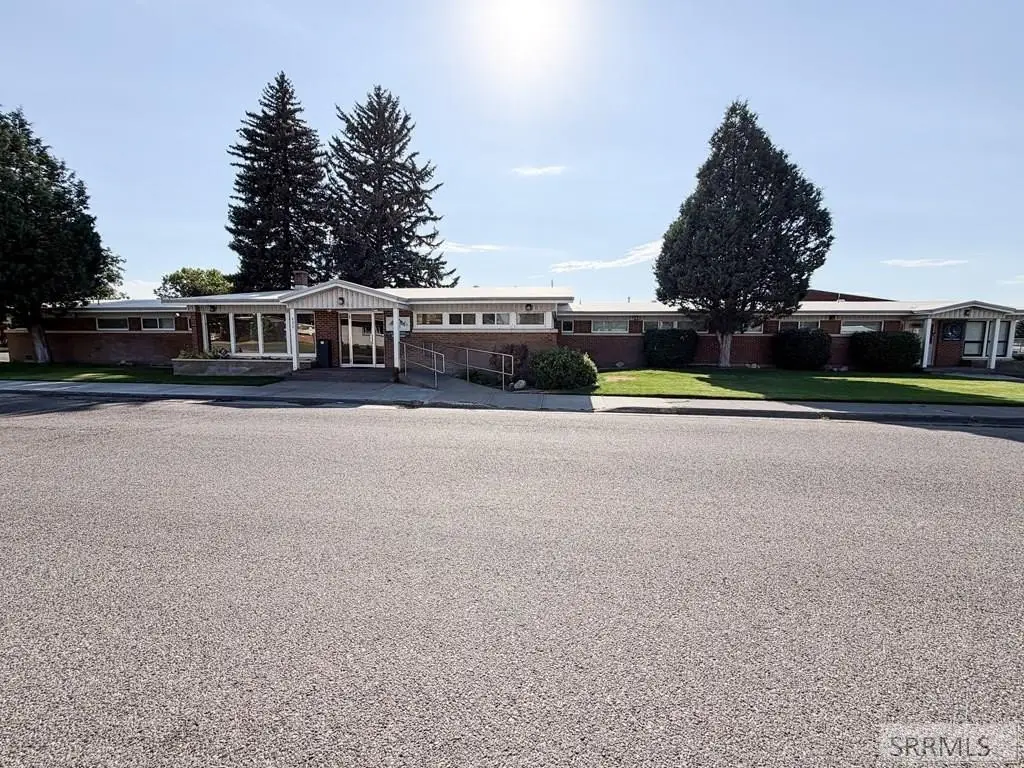
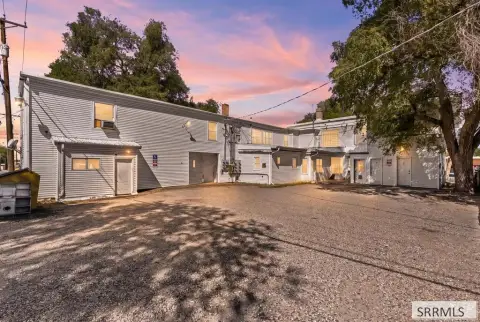
This 7,552-square-foot brick office building, constructed in 1959, contains 22 private offices and a conference room, along with a copy room, reception area, and lobby with a waiting area. The main level has four restrooms and two kitchens; another kitchen is located in the basement. Five separate entrances serve the building, and an accessible approach ramp is present. Heating is forced-air natural gas, with two air conditioning units. Fiber internet is available, and the roof was replaced in 2018.
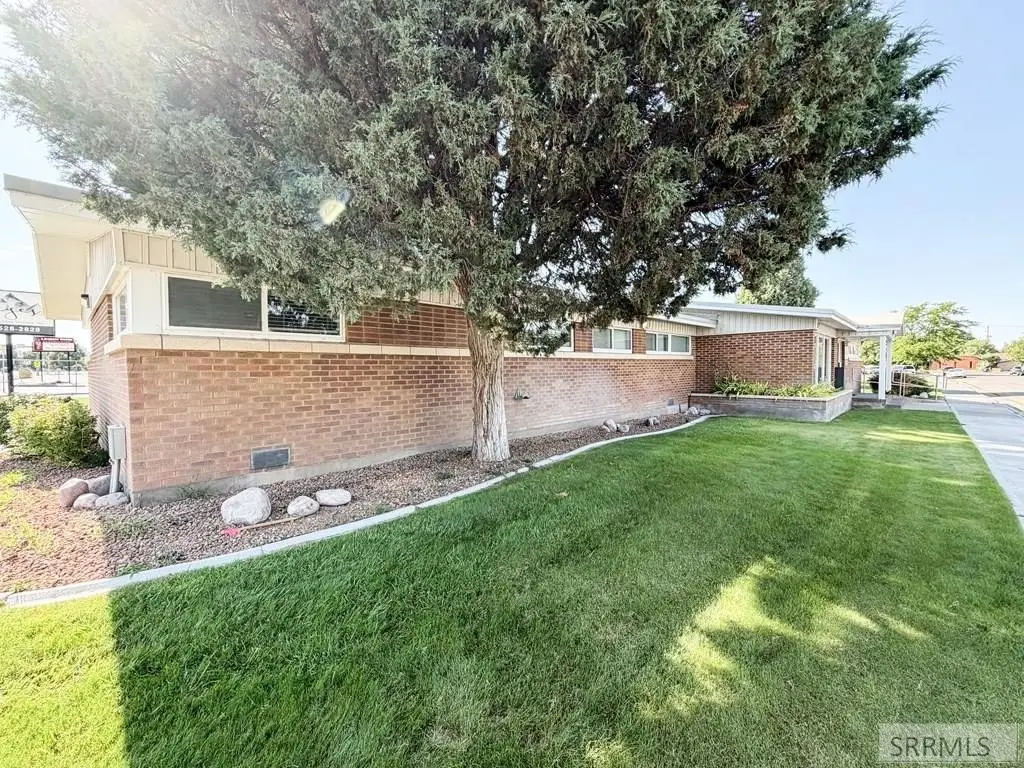
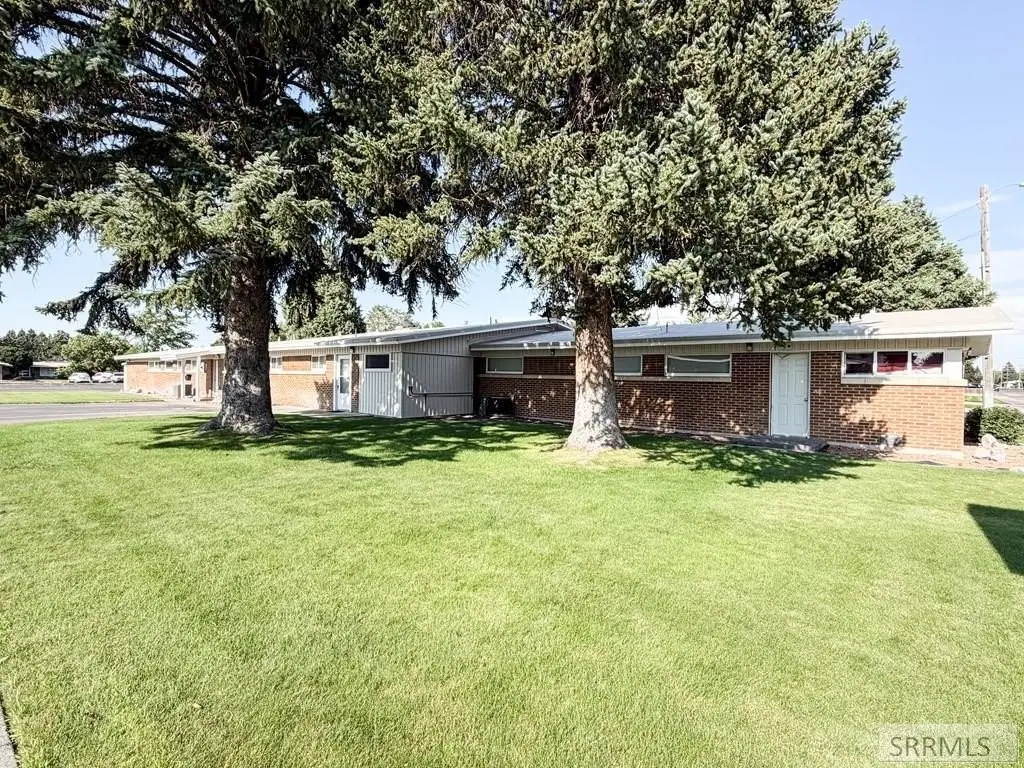
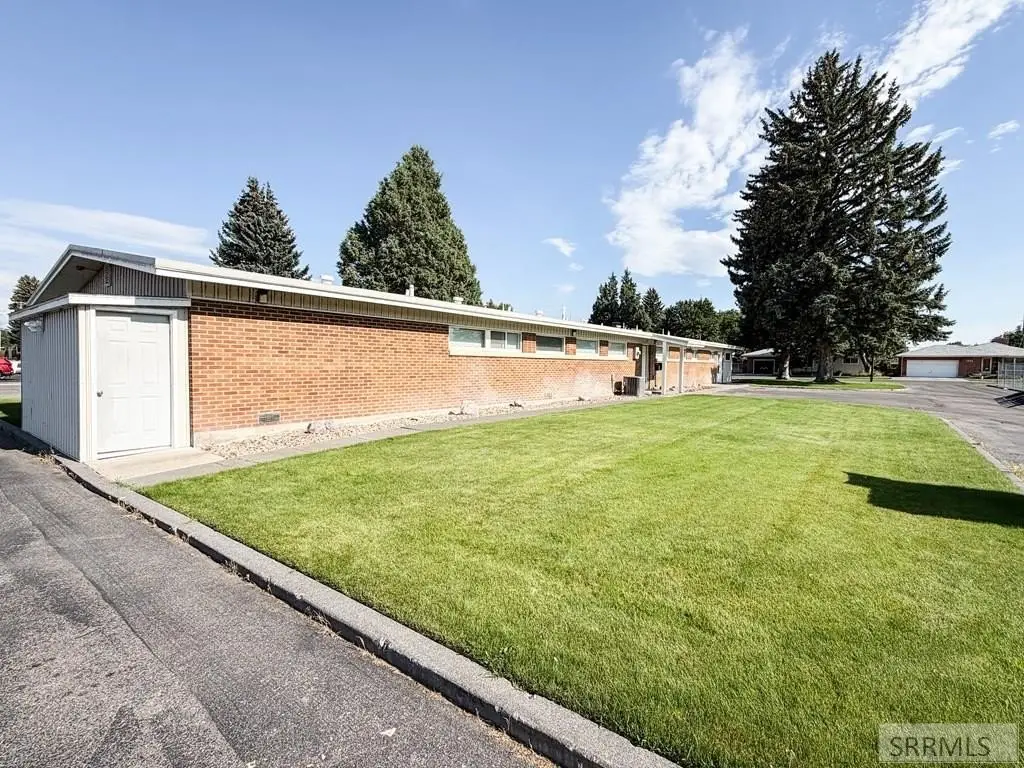
The property occupies 0.567 acres and is zoned R3A. The grounds are landscaped, with parking available on site as well as off street and on street. Public water and sewer serve the property. Any proposed use should be confirmed with the City of Idaho Falls.
The property occupies 0.567 acres and is zoned R3A. The grounds are landscaped, with parking available on site as well as off street and on street. Public water and sewer serve the property. Any proposed use should be confirmed with the City of Idaho Falls.
Key Highlights
- 22 private offices, conference room, copy room, reception area, and lobby with waiting area
- Five separate building entrances and an accessible approach ramp
- 7,552‑square‑foot brick building on 0.567 acres
Financial Insights
Estimated NOI and Cap Rate
NOI / Yr
$81,833
Cap Rate
6.82%
Suggested Prices Based on Cap Rates
Cap Rate 5%
$1,636,660
$1.6M
Cap Rate 7%
$1,169,043
$1.2M
Cap Rate 9%
$909,256
$909.3K
Market Conditions
NOI Build-Up for 7,552 SF
Gross rent
$126.9K $16.80/SF
− Vacancy
−$17.8K −$2.35/SF
EGI
$109.1K $14.45/SF
− OpEx
−$27.3K −$3.61/SF
NOI
$81.8K $10.84/SF
Area
Bonneville County, ID
Vacancy
14.00%
Lease Rate
$16.80 /SF/Yr
Expense Ratio
25.00%
Simulate Cap Rate and NOI
Suggested Prices Based on Cap Rates
Cap Rate 5%
$1,636,660
Cap Rate 7%
$1,169,043
Cap Rate 9%
$909,256
Alternative Uses
Best Use
Office B
$1.17M
$1.02M – $1.36M
NOI $81,833 @ 7.0% cap · market cap 6.82%
Second Best
—
—
no second resolved use
Theoretical Best
Office A
$1.67M
$1.46M – $1.95M
NOI $116,796 @ 7.0% cap · market cap 9.73%
Zoning and permitted uses should be independently verified with authorities.
How Realmo checks its estimates
Property Analytics
Unlock full access to Insights
Subscribe to Realmo Intelligence
Open Analytics
Current Use
Lease Details
Yes
Utilities to site
Location Intelligence
Trade Area within ½ mile
839
Businesses Nearby
Explore this area
Business Placement
Demographics for 83401, ID
47,114
Population
16,026
Households
2.9
Avg Household Size
31
Median Age
30%
College-Educated
90%
High-School Grad
197.3 sq mi
ZIP Area
239
Density / Sq Mi
$75,870
Median Household Income
$35,293
Median Earnings
$1,132
Median Rent
$307,700
Median Home Value
Check the figures for this property
Cap Rate, Value Estimation, Potential NOI and more
View Realmo Analytics
Market
Vacancy Rate% for Office in West region






Frequently Asked Questions
What type of property is this?
Office building - Private offices, shared meeting space, and multiple entry points support a range of workspace configurations.
Where is this office building located?
The property is located at 890 Oxford Drive Idaho Falls, ID.
What is the asking price?
The asking price for this property is $1,200,000.
What are key features of this property?
This property features: 22 private offices, conference room, copy room, reception area, and lobby with waiting area; Five separate building entrances and an accessible approach ramp; 7,552‑square‑foot brick building on 0.567 acres