Detached Coach House
For Sale
$1,300,000
4749 N Dover Street Chicago, Chicago, IL 60640
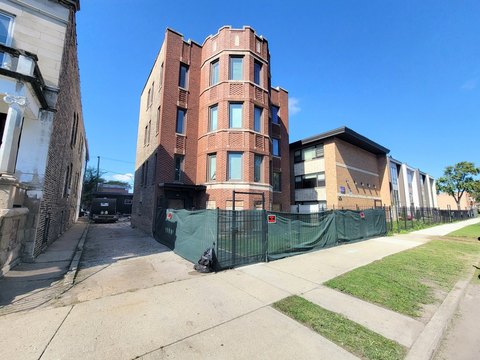
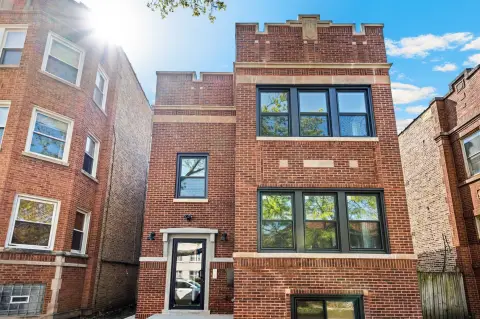
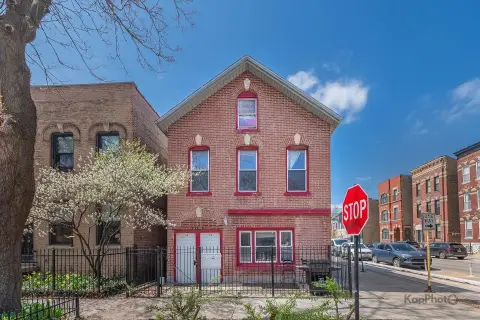
Brick two-flat with a finished walk-out garden unit and detached multi-level coach house, providing four income streams.
Property Size4,613 SF
Price / SF$281.81
Days on Market89
Property Features for 4749 N Dover Street Chicago
General Information
Standard status
Active
Size
4,613 SF
Property subtype
Two to Four Units
Additional Details
Business Included
Yes
Taxes and HOA fees
Annual Taxes
$16,416
Amenities
Finished,Exterior Entry,Walk-Up Access,Full,Walk-Out Access
5
10
4
Public
0.144
0.14
No
Building Details
Year Built
1912
Listed By:
Luigui Corral
(847) 558-6808
Source:
Remaxadream
Added: Jul 9
Changed: Sep 8
Last Checked: Oct 5 at 3:23PM
Displayed information is deemed reliable but is not guaranteed and should be independently verified. All listing content including descriptions, pricing, images are the copyrighted material of Luigui Corral
Investment Insights
Based on property information with market context.
This for-sale multi-unit property features a classic, solid brick 2-flat with three distinct living spaces, plus a fully finished walk-out garden unit, creating three income-producing units within the main building. The layout also includes multiple separate entrances or exits per unit, supporting privacy and safety.
A detached, multi-level solid brick coach house sits at the rear of the property. It offers an open living and dining area, a kitchen with granite countertops, two bedrooms and a full bathroom, and an additional basement level with dedicated private in-unit laundry. A private patio and mini garden are included with the coach house.
Within the finished walk-out lower level, the garden unit includes three bedrooms and a private bathroom, along with an open-concept kitchen and modern finishes. A designated shared laundry room serves the main building units and is accessible via the shared walk-out basement entrance or multiple interior entrances. The property also includes ample off-street parking, and a landscaped backyard with a swimming pool, expansive patio, pergola, and outdoor spaces for relaxing.
A detached, multi-level solid brick coach house sits at the rear of the property. It offers an open living and dining area, a kitchen with granite countertops, two bedrooms and a full bathroom, and an additional basement level with dedicated private in-unit laundry. A private patio and mini garden are included with the coach house.
Within the finished walk-out lower level, the garden unit includes three bedrooms and a private bathroom, along with an open-concept kitchen and modern finishes. A designated shared laundry room serves the main building units and is accessible via the shared walk-out basement entrance or multiple interior entrances. The property also includes ample off-street parking, and a landscaped backyard with a swimming pool, expansive patio, pergola, and outdoor spaces for relaxing.
Key Highlights
- 10‑bedroom, 5‑bath 4‑unit property with a finished walk‑out full basement and walk‑up access
- Classic solid brick 2‑flat plus a fully finished walk‑out garden unit in the main building
- Detached multi‑level solid brick coach house with 2 bedrooms, 1 full bath, and in‑unit laundry in the basement
Financial Insights
Estimated NOI and Cap Rate
NOI / Yr
$76,898
Cap Rate
5.92%
Suggested Prices Based on Cap Rates
Cap Rate 5%
$1,537,960
$1.5M
Cap Rate 7%
$1,098,543
$1.1M
Cap Rate 9%
$854,422
$854.4K
Market Conditions
NOI Build-Up for 4,613 SF
Gross rent
$116.2K $25.20/SF
− Vacancy
−$6.4K −$1.39/SF
EGI
$109.9K $23.81/SF
− OpEx
−$33.0K −$7.14/SF
NOI
$76.9K $16.67/SF
Area
Chicago, IL
Vacancy
5.50%
Lease Rate
$25.20 /SF/Yr
Expense Ratio
30.00%
Simulate Cap Rate and NOI
Suggested Prices Based on Cap Rates
Cap Rate 5%
$1,537,960
Cap Rate 7%
$1,098,543
Cap Rate 9%
$854,422
Alternative Uses
Best Use
Multifamily LT 5
$1.10M
$961.2K – $1.28M
NOI $76,898 @ 7.0% cap · market cap 5.92%
Second Best
Apartment 5plus
$1.01M
$883.9K – $1.18M
NOI $70,713 @ 7.0% cap · market cap 5.44%
Theoretical Best
Office A
$2.18M
$1.90M – $2.54M
NOI $152,251 @ 7.0% cap · market cap 11.71%
Zoning and permitted uses should be independently verified with authorities.
Property Analytics
Unlock full access to Insights
Subscribe to Realmo Intelligence
Open Analytics
Current Use
Lease Details
Turnkey business
Opportunity
Location Intelligence
Trade Area within ½ mile
4,434
Businesses Nearby
Explore this area
Business Placement
Demographics for 60640, IL
65,941
Population
40,850
Households
1.6
Avg Household Size
38
Median Age
63%
College-Educated
92%
High-School Grad
2.4 sq mi
ZIP Area
27,475
Density / Sq Mi
$71,030
Median Household Income
$59,264
Median Earnings
$1,374
Median Rent
$363,300
Median Home Value
Check the figures for this property
Cap Rate, Value Estimation, Potential NOI and more
View Realmo Analytics
Market
Vacancy Rate% for Multifamily in Midwest region

Questions? Ask Rey
Realmo’s AI knows this listing — price, zoning, demand, history. Ask anything.




Frequently Asked Questions
What type of property is this?
Quadplex - Brick two-flat with a finished walk-out garden unit and detached multi-level coach house, providing four income streams.
Where is this quadplex located?
The property is located at 4749 N Dover Street Chicago Chicago, IL.
What is the asking price?
The asking price for this property is $1,300,000.
What are key features of this property?
This property features: 10‑bedroom, 5‑bath 4‑unit property with a finished walk‑out full basement and walk‑up access; Classic solid brick 2‑flat plus a fully finished walk‑out garden unit in the main building; Detached multi‑level solid brick coach house with 2 bedrooms, 1 full bath, and in‑unit laundry in the basement