Automotive Service and Office
For Sale
$1,350,000
1615 E Texas Street Bossier City, Bossier City, LA 71111
Corner property with office space and multiple shop bays designed for automotive and service-oriented operations.
Property Size7,119 SF
Lot Size1.01 Acres
Days on Market100
Property Features for 1615 E Texas Street Bossier City
General Information
Standard status
Active
Size
7,119 SF
Total Parking Spaces
124
Lot size
1.01 Acres
Zoning
B-3
Additional Details
Office Units
3
Taxes and HOA fees
Annual Taxes
$2,004
Building Details
Building Size
7,119 SF
Year Built
1968
Stories
1
Listed By:
Kris Watts
(800) 683-5651
Source:
Jparhouston
Added: Jun 30
Changed: Oct 1
Last Checked: Oct 5 at 3:51PM
Displayed information is deemed reliable but is not guaranteed and should be independently verified. All listing content including descriptions, pricing, images are the copyrighted material of Kris Watts
Investment Insights
Based on property information with market context.
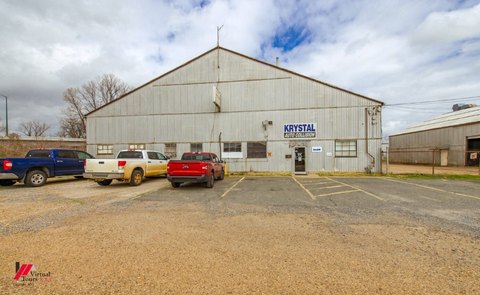
This for-sale automotive-oriented property includes an office building and two separate shop buildings on a combined 1.01-acre site comprised of two parcels. The office building features three private sales offices, a customer waiting area, a staff kitchen and restroom, two public restrooms, a back office with a pay window, and an owner’s office with a private entrance. Two shop buildings support flexible service and storage arrangements, with Shop 1 offering three bays including two front-facing bays with carports and a rear bay for storage or additional workspace. Shop 2 includes large roll-up doors and offers adaptable space for mechanical, industrial, or service use.
The site is positioned on a busy corner with high visibility and strong accessibility. The expansive lot can accommodate up to 124 vehicles, supporting dealership or fleet-style needs and providing room for operational flow. The property is described as having formerly operated as Humphrey Motors.
For buyers seeking an automotive dealership, service operation, or other light industrial use that benefits from multiple service bays plus dedicated office and customer areas, the existing layout provides a practical starting point. Furnishings are included in the sale, with some reserved items, allowing the next operator to tailor the workspace without starting from scratch.
The site is positioned on a busy corner with high visibility and strong accessibility. The expansive lot can accommodate up to 124 vehicles, supporting dealership or fleet-style needs and providing room for operational flow. The property is described as having formerly operated as Humphrey Motors.
For buyers seeking an automotive dealership, service operation, or other light industrial use that benefits from multiple service bays plus dedicated office and customer areas, the existing layout provides a practical starting point. Furnishings are included in the sale, with some reserved items, allowing the next operator to tailor the workspace without starting from scratch.
Key Highlights
- 1.01‑acre corner commercial property (two parcels) on E. Texas St with office and multiple shop buildings
- 1968 year built with office building featuring 3 private sales offices, customer waiting area, staff kitchen, and 2 public restrooms
- Office includes back office with pay window and owner’s office with private entrance
Financial Insights
Estimated NOI and Cap Rate
NOI / Yr
$46,064
Cap Rate
3.41%
Suggested Prices Based on Cap Rates
Cap Rate 5%
$921,280
$921.3K
Cap Rate 7%
$658,057
$658.1K
Cap Rate 9%
$511,822
$511.8K
Market Conditions
NOI Build-Up for 7,119 SF
Gross rent
$69.2K $9.72/SF
− Vacancy
−$3.4K −$0.48/SF
EGI
$65.8K $9.24/SF
− OpEx
−$19.7K −$2.77/SF
NOI
$46.1K $6.47/SF
Area
Bossier County, LA
Vacancy
4.90%
Lease Rate
$9.72 /SF/Yr
Expense Ratio
30.00%
Simulate Cap Rate and NOI
Suggested Prices Based on Cap Rates
Cap Rate 5%
$921,280
Cap Rate 7%
$658,057
Cap Rate 9%
$511,822
Alternative Uses
Best Use
Retail
$658.1K
$575.8K – $767.7K
NOI $46,064 @ 7.0% cap · market cap 3.41%
Second Best
Industrial
$597.1K
$522.5K – $696.7K
NOI $41,800 @ 7.0% cap · market cap 3.10%
Theoretical Best
Office A
$1.21M
$1.06M – $1.41M
NOI $84,829 @ 7.0% cap · market cap 6.28%
Zoning and permitted uses should be independently verified with authorities.
Property Analytics
Unlock full access to Insights
Subscribe to Realmo Intelligence
Open Analytics
Current Use
Lease Details
3
Office units
Location Intelligence
Trade Area within ½ mile
414
Businesses Nearby
Well-served
Demand for This Use
Explore this area
Business Placement
Demographics for 71111, LA
44,476
Population
19,563
Households
2.3
Avg Household Size
35
Median Age
31%
College-Educated
91%
High-School Grad
45.2 sq mi
ZIP Area
984
Density / Sq Mi
$66,465
Median Household Income
$43,483
Median Earnings
$1,065
Median Rent
$268,600
Median Home Value
Check the figures for this property
Cap Rate, Value Estimation, Potential NOI and more
View Realmo Analytics
Market
Vacancy Rate% for Retail in South region

Questions? Ask Rey
Realmo’s AI knows this listing — price, zoning, demand, history. Ask anything.






Similar Off Market Nearby
- Christophe's Action King — 421 Hamilton Rd, Bossier City, LA 71111
- Patriot Fleet Service — 405 Hamilton Rd, Bossier City, LA 71111
- SIMOTORSPORTS — 98 Benton Rd, Bossier City, LA 71111
- Rocky's tires & Wheels — 400 E Texas St, Bossier City, LA 71111
- El Primo Villareal Tire Shop — 1407 E Texas St, Bossier City, LA 71111
Frequently Asked Questions
What type of property is this?
Auto shop - Corner property with office space and multiple shop bays designed for automotive and service-oriented operations.
Where is this auto shop located?
The property is located at 1615 E Texas Street Bossier City Bossier City, LA.
What is the asking price?
The asking price for this property is $1,350,000.
What are key features of this property?
This property features: 1.01‑acre corner commercial property (two parcels) on E. Texas St with office and multiple shop buildings; 1968 year built with office building featuring 3 private sales offices, customer waiting area, staff kitchen, and 2 public restrooms; Office includes back office with pay window and owner’s office with private entrance