Secure Office
For Sale
$115,000
700 4th Street - Ste 300/310, Sioux City, IA 51101
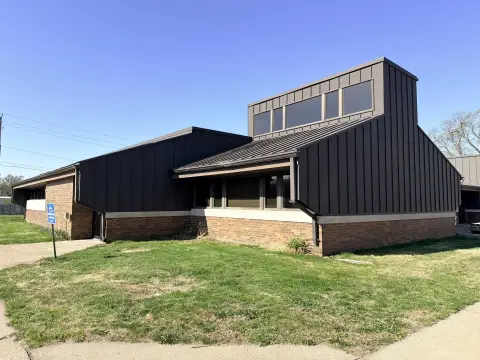
Office condo built in 2012 to meet federal security standards, with additional space available for lease and sale.
Property Size1,987 SF
Price / SF$33.06
Days on Market107
Property Features for 700 4th Street - Ste 300/310
General Information
Standard status
Active
Size
1,987 SF
Class
A
Property subtype
Office Condo | Units 300/310
Building Details
Building Size
1,987 SF
Year Built
1972
Listing Agency:
NAI United
Listed By:
Chris Bogenrief, SIOR, CCIM, MBA · License #11318
(712) 204-6261
Source:
Naiunited
Added: Jun 11
Changed: Sep 8
Last Checked: Sep 24 at 7:35AM
Displayed information is deemed reliable but is not guaranteed and should be independently verified. All listing content including descriptions, pricing, images are the copyrighted material of NAI United
Investment Insights
Based on property information with market context.
This office condominium was built to suit for federal security standards in 2012 and previously operated as an Office of the Comptroller of the Currency space. The offering includes 3,478 SF of condo space that is also available for lease, providing flexibility for buyers who need partial occupancy or for users seeking dedicated office space within a condo format. Operating expenses are estimated at $6.95 per square foot.
Located in the heart of Downtown Sioux City’s entertainment district, the property benefits from an urban office setting where tenants can reach surrounding retail and entertainment demand. The building also allows for strategic expansion within the condominium portfolio.
For an owner-user, the asset’s purpose-built security background can be valuable for organizations that require a more controlled office environment. For investors or multi-user operators, the ability to lease 3,478 SF and the option to combine with adjacent Units 300/310 (1,987 SF) at the same price per square foot can support a range of occupancy and capital strategies without forcing a single-use commitment.
Located in the heart of Downtown Sioux City’s entertainment district, the property benefits from an urban office setting where tenants can reach surrounding retail and entertainment demand. The building also allows for strategic expansion within the condominium portfolio.
For an owner-user, the asset’s purpose-built security background can be valuable for organizations that require a more controlled office environment. For investors or multi-user operators, the ability to lease 3,478 SF and the option to combine with adjacent Units 300/310 (1,987 SF) at the same price per square foot can support a range of occupancy and capital strategies without forcing a single-use commitment.
Key Highlights
- Office condominium in Downtown Sioux City’s entertainment district
- Former Office of the Comptroller of the Currency space built to suit meeting federal security standards in 2012
- Year built listed as 1972
Property Analytics
Unlock full access to Insights
Subscribe to Realmo Intelligence
Open Analytics
Current Use
Location Intelligence
Trade Area within ½ mile
102
Businesses Nearby
Explore this area
Business Placement
Demographics for 51101, IA
1,146
Population
723
Households
1.6
Avg Household Size
39
Median Age
11%
College-Educated
84%
High-School Grad
1.2 sq mi
ZIP Area
955
Density / Sq Mi
$18,103
Median Household Income
$25,661
Median Earnings
$676
Median Rent
Check the figures for this property
Cap Rate, Value Estimation, Potential NOI and more
View Realmo Analytics
Market
Vacancy Rate% for Office in Midwest region

Questions? Ask Rey
Realmo’s AI knows this listing — price, zoning, demand, history. Ask anything.





Frequently Asked Questions
What type of property is this?
Office units - Office condo built in 2012 to meet federal security standards, with additional space available for lease and sale.
Where is this office units located?
The property is located at 700 4th Street - Ste 300/310 Sioux City, IA.
What is the asking price?
The asking price for this property is $115,000.
What are key features of this property?
This property features: Office condominium in Downtown Sioux City’s entertainment district; Former Office of the Comptroller of the Currency space built to suit meeting federal security standards in 2012; Year built listed as 1972



