Renovated Multifamily
For Sale
$580,000
Pending
125 Clematis, Waterbury, CT 06708
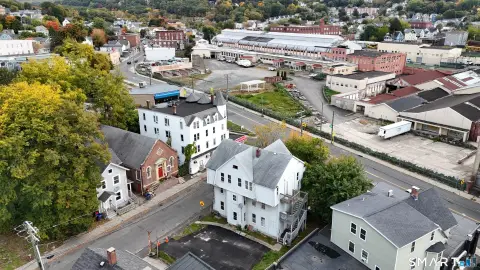
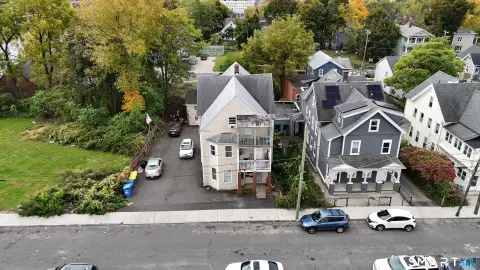
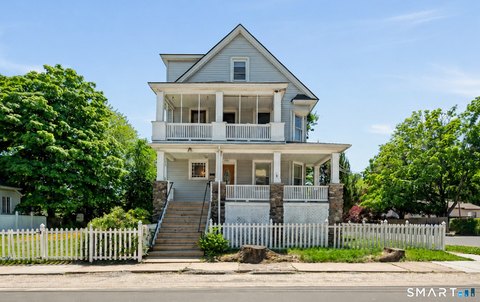
Updated multifamily property with central air, gas heat, private parking, and a backyard.
Property Size3,515 SF
Days on Market61
Property Features for 125 Clematis
General Information
Standard status
Pending
Size
3,515 SF
Property subtype
3 Family
Amenities
central air
gas heating
private parking
backyard
Building Details
Year Built
1890
Listing Agency:
Homecoin.com
(888) 400-2513
Listed By:
Jonathan Minerick · License #REB.0795104
(404) 388-9441
Source:
Lockandkeyre
Added: Aug 16
Changed: Oct 13
Last Checked: Oct 15 at 12:12AM
Displayed information is deemed reliable but is not guaranteed and should be independently verified. All listing content including descriptions, pricing, images are the copyrighted material of Homecoin.com
Investment Insights
Based on property information with market context.
Built in 1890, this multifamily property has undergone substantial updates, including upgraded siding and a newer roof. The building is equipped with central air and gas heating, while private parking adds everyday convenience. Outdoor space is provided by a backyard suitable for relaxing or entertaining.
The property is located at 125 Clematis Ave in Waterbury, Connecticut. Walk Score is 61, classified as Somewhat Walkable; Bike Score is 31, classified as Somewhat Bikeable; and Transit Score is 30, indicating Some Transit. The renovation work and existing mechanical improvements provide a practical foundation for continued residential use.
The property is located at 125 Clematis Ave in Waterbury, Connecticut. Walk Score is 61, classified as Somewhat Walkable; Bike Score is 31, classified as Somewhat Bikeable; and Transit Score is 30, indicating Some Transit. The renovation work and existing mechanical improvements provide a practical foundation for continued residential use.
Key Highlights
- Multifamily property built in 1890
- Renovated with upgraded siding and a newer roof
- Central air and gas heating
Financial Insights
Estimated NOI and Cap Rate
NOI / Yr
$35,675
Cap Rate
6.15%
Suggested Prices Based on Cap Rates
Cap Rate 5%
$713,500
$713.5K
Cap Rate 7%
$509,643
$509.6K
Cap Rate 9%
$396,389
$396.4K
Market Conditions
NOI Build-Up for 3,515 SF
Gross rent
$69.6K $19.80/SF
− Vacancy
−$4.7K −$1.35/SF
EGI
$64.9K $18.45/SF
− OpEx
−$29.2K −$8.30/SF
NOI
$35.7K $10.15/SF
Area
Waterbury, CT
Vacancy
6.80%
Lease Rate
$19.80 /SF/Yr
Expense Ratio
45.00%
Simulate Cap Rate and NOI
Suggested Prices Based on Cap Rates
Cap Rate 5%
$713,500
Cap Rate 7%
$509,643
Cap Rate 9%
$396,389
Alternative Uses
Best Use
Apartment 5plus
$509.6K
$445.9K – $594.6K
NOI $35,675 @ 7.0% cap · market cap 6.15%
Second Best
—
—
no second resolved use
Theoretical Best
Office A
$932.8K
$816.2K – $1.09M
NOI $65,295 @ 7.0% cap · market cap 11.26%
Zoning and permitted uses should be independently verified with authorities.
How Realmo checks its estimates
Property Analytics
Unlock full access to Insights
Subscribe to Realmo Intelligence
Open Analytics
Current Use
Location Intelligence
Trade Area within ½ mile
461
Businesses Nearby
Explore this area
Business Placement
Demographics for 06708, CT
30,345
Population
13,061
Households
2.3
Avg Household Size
38
Median Age
22%
College-Educated
84%
High-School Grad
9.4 sq mi
ZIP Area
3,228
Density / Sq Mi
$63,705
Median Household Income
$40,515
Median Earnings
$1,275
Median Rent
$196,700
Median Home Value
Check the figures for this property
Cap Rate, Value Estimation, Potential NOI and more
View Realmo Analytics
Market
Vacancy Rate% for Multifamily in Northeast region

Questions? Ask Rey
Realmo’s AI knows this listing — price, zoning, demand, history. Ask anything.





Frequently Asked Questions
What type of property is this?
Multifamily property - Updated multifamily property with central air, gas heat, private parking, and a backyard.
Where is this multifamily property located?
The property is located at 125 Clematis Waterbury, CT.
What is the asking price?
The asking price for this property is $580,000.
What are key features of this property?
This property features: Multifamily property built in 1890; Renovated with upgraded siding and a newer roof; Central air and gas heating


