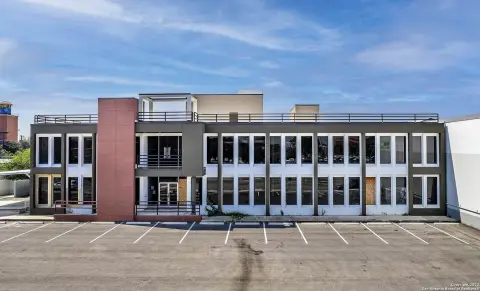
La Quinta Inn San
For Sale
Contact for pricing
12822 N Interstate 35, San Antonio, TX 78233
Recently renovated 137-room hotel with upside potential.
Property Size61,279 SF
Price / SF$110.97
Days on Market594
Property Features for 12822 N Interstate 35
General Information
Standard status
Active
Size
61,279 SF
Property subtype
Hospitality
Occupancy
57%
Investment Type
Stabilized
Net Operating Income
$641,000
Building Details
Year Built
1986
Year Renovated
2022
Listing Agency:
Seth Equities
Listed By:
Rorik Seth · License #TX 9015432
(281) 968-5019
Source:
Crexi
Added: Feb 20, 2025
Changed: Oct 2
Last Checked: Oct 5 at 7:26PM
Displayed information is deemed reliable but is not guaranteed and should be independently verified. All listing content including descriptions, pricing, images are the copyrighted material of Seth Equities
Investment Insights
Based on property information with market context.
The La Quinta Inn by Wyndham San Antonio I-35N at Toepperwein is a hospitality property located in San Antonio. The property features 137 guest rooms. Recent renovations totaling over $1.4 million included updates to guest rooms, public spaces, and mechanical systems. The property is positioned along Interstate 35 North, providing visibility and accessibility. It is near corporate offices, healthcare facilities, educational institutions, and leisure attractions such as the San Antonio River Walk and the Alamo. As part of the Wyndham portfolio, this La Quinta Inn benefits from a reservation system and brand recognition. The property has potential for operational efficiencies and revenue management strategies to drive NOI growth. The property size is 61279 square feet.
Key Highlights
- Recently renovated with over $1.4 million in capital improvements, enhancing guest experience.
- Located in the thriving San Antonio market along Interstate 35 North, offering excellent visibility and accessibility.
- Affiliated with La Quinta Inn by Wyndham, providing brand recognition and a robust reservation system.
Financial Insights
Estimated NOI and Cap Rate
NOI / Yr
$338,113
Cap Rate
4.97%
Suggested Prices Based on Cap Rates
Cap Rate 5%
$6,762,260
$6.8M
Cap Rate 7%
$4,830,186
$4.8M
Cap Rate 9%
$3,756,811
$3.8M
Market Conditions
NOI Build-Up for 61,279 SF
Gross rent
$808.9K $13.20/SF
− Vacancy
−$97.1K −$1.58/SF
EGI
$711.8K $11.62/SF
− OpEx
−$373.7K −$6.10/SF
NOI
$338.1K $5.52/SF
Area
San Antonio, TX
Vacancy
12.00%
Lease Rate
$13.20 /SF/Yr
Expense Ratio
52.50%
Simulate Cap Rate and NOI
Suggested Prices Based on Cap Rates
Cap Rate 5%
$6,762,260
Cap Rate 7%
$4,830,186
Cap Rate 9%
$3,756,811
Alternative Uses
Best Use
Hotel Hospitality
$4.83M
$4.23M – $5.64M
NOI $338,113 @ 7.0% cap · market cap 4.97%
Second Best
—
—
no second resolved use
Theoretical Best
Office A
$15.63M
$13.68M – $18.24M
NOI $1,094,186 @ 7.0% cap · market cap 16.09%
Zoning and permitted uses should be independently verified with authorities.
Property Analytics
Unlock full access to Insights
Subscribe to Realmo Intelligence
Open Analytics
Current Use
Location Intelligence
Trade Area within ½ mile
757
Businesses Nearby
Explore this area
Business Placement
Demographics for 78233, TX
49,442
Population
19,396
Households
2.5
Avg Household Size
36
Median Age
27%
College-Educated
91%
High-School Grad
13.7 sq mi
ZIP Area
3,609
Density / Sq Mi
$73,729
Median Household Income
$41,817
Median Earnings
$1,456
Median Rent
$203,300
Median Home Value
Check the figures for this property
Cap Rate, Value Estimation, Potential NOI and more
View Realmo Analytics

Questions? Ask Rey
Realmo’s AI knows this listing — price, zoning, demand, history. Ask anything.



Frequently Asked Questions
What type of property is this?
Hotel - Recently renovated 137-room hotel with upside potential.
Where is this hotel located?
The property is located at 12822 N Interstate 35 San Antonio, TX.
What is the asking price?
The asking price for this property is $6,800,000.
What are key features of this property?
This property features: Recently renovated with **over $1.4 million in capital improvements**, enhancing guest experience.; Located in the thriving San Antonio market along Interstate 35 North, offering excellent visibility and accessibility.; Affiliated with La Quinta Inn by Wyndham, providing brand recognition and a robust reservation system.



