Four-Plex Near Utah
For Sale
$1,550,000
35 Hillside Avenue, Salt Lake City, UT 84103
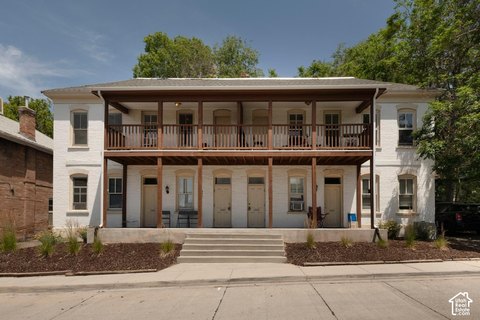
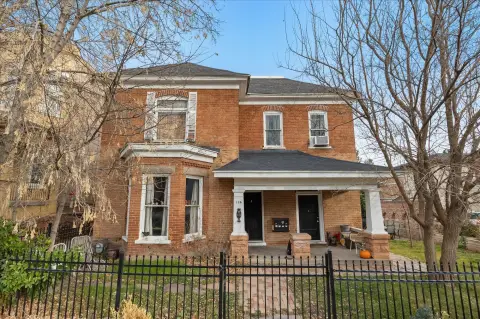
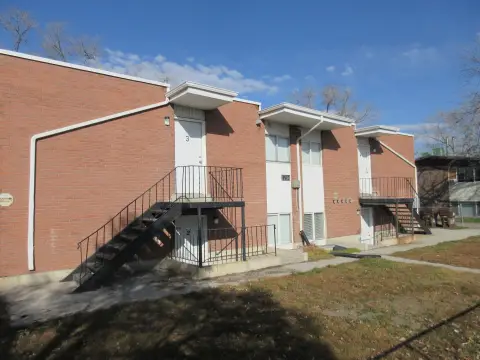
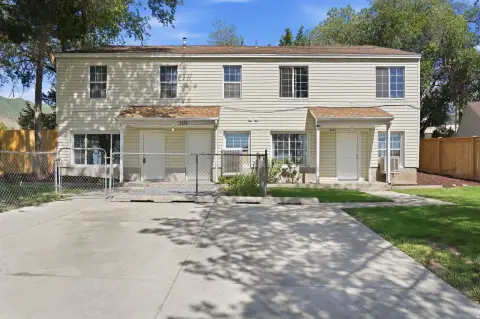
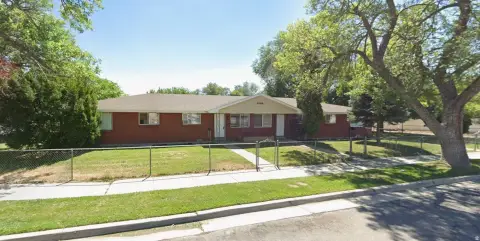
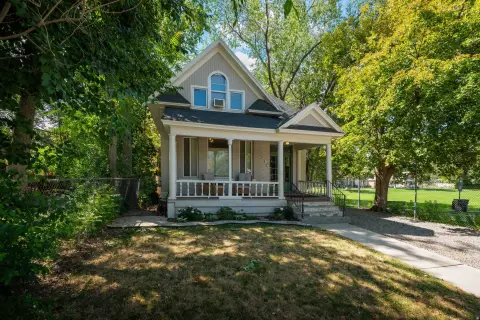
Well-maintained four-plex with spacious units and recent upgrades.
Property Size6,160 SF
Price / SF$251.62
Days on Market252
Property Features for 35 Hillside Avenue
General Information
Standard status
Active
Size
6,160 SF
Property subtype
Multifamily
Building Details
Building Size
6,160 SF
Year Built
1961
Listing Agency:
InterNet Properties
Listed By:
Christian Priskos, CCIM
(801) 573-8500
Source:
Iproperties
Added: Jan 27
Changed: Oct 4
Last Checked: Oct 5 at 4:05PM
Displayed information is deemed reliable but is not guaranteed and should be independently verified. All listing content including descriptions, pricing, images are the copyrighted material of InterNet Properties
Investment Insights
Based on property information with market context.
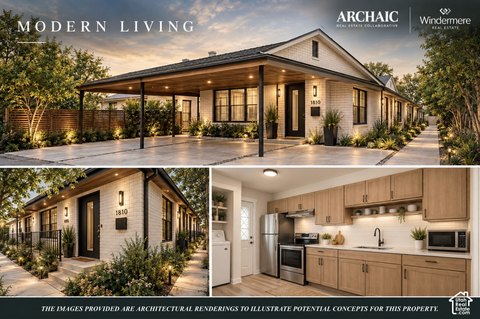
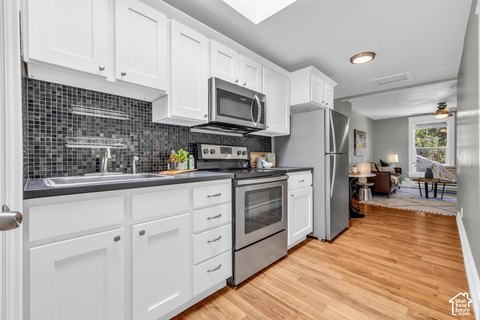
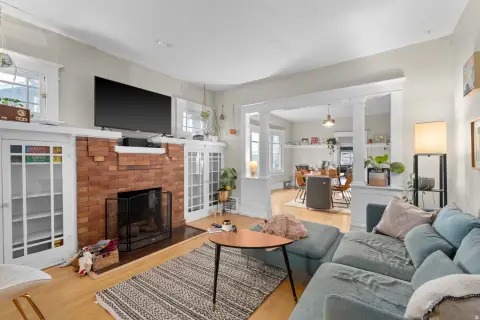
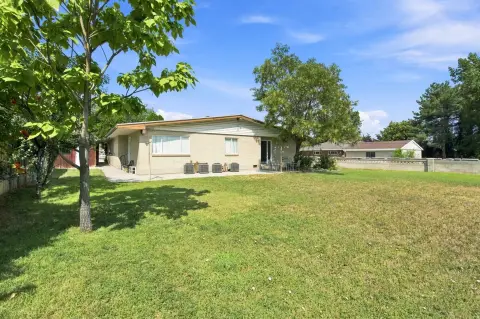
The property at 35 Hillside Avenue is a four-plex containing two 2-bedroom, 1-bathroom units and two 1-bedroom, 1-bathroom units. The units are unusually large and feature natural light, private outdoor common areas, covered private parking or storage, and in-unit laundry. Located near the Utah Capitol building, the property benefits from a large number of potential renters in the area. One of the four units has been upgraded, resulting in a 66% increase in monthly rent, demonstrating the potential for significant monthly increases with similar improvements. The roof, HVAC, and windows have been recently replaced. The unfinished basement offers added rental income potential by adding a 5th unit. The property size is 6160 square feet.
Key Highlights
- Significant rental income upside by adding a 5th unit in the basement.
- One unit upgrade resulted in a 66% rent increase, demonstrating potential for similar improvements in other units.
- Recently replaced roof, HVAC, and windows minimize near‑term maintenance costs.
Financial Insights
Estimated NOI and Cap Rate
NOI / Yr
$82,149
Cap Rate
5.30%
Suggested Prices Based on Cap Rates
Cap Rate 5%
$1,642,980
$1.6M
Cap Rate 7%
$1,173,557
$1.2M
Cap Rate 9%
$912,767
$912.8K
Market Conditions
NOI Build-Up for 6,160 SF
Gross rent
$124.2K $20.16/SF
− Vacancy
−$6.8K −$1.11/SF
EGI
$117.4K $19.05/SF
− OpEx
−$35.2K −$5.72/SF
NOI
$82.1K $13.34/SF
Area
Salt Lake City, UT
Vacancy
5.50%
Lease Rate
$20.16 /SF/Yr
Expense Ratio
30.00%
Simulate Cap Rate and NOI
Suggested Prices Based on Cap Rates
Cap Rate 5%
$1,642,980
Cap Rate 7%
$1,173,557
Cap Rate 9%
$912,767
Alternative Uses
Best Use
Multifamily LT 5
$1.17M
$1.03M – $1.37M
NOI $82,149 @ 7.0% cap · market cap 5.30%
Second Best
Apartment 5plus
$1.09M
$953.9K – $1.27M
NOI $76,313 @ 7.0% cap · market cap 4.92%
Theoretical Best
Office A
$1.66M
$1.45M – $1.94M
NOI $116,171 @ 7.0% cap · market cap 7.49%
Zoning and permitted uses should be independently verified with authorities.
Property Analytics
Unlock full access to Insights
Subscribe to Realmo Intelligence
Open Analytics
Current Use
Location Intelligence
Trade Area within ½ mile
3,311
Businesses Nearby
Explore this area
Business Placement
Demographics for 84103, UT
22,788
Population
13,528
Households
1.7
Avg Household Size
36
Median Age
66%
College-Educated
98%
High-School Grad
20.5 sq mi
ZIP Area
1,112
Density / Sq Mi
$81,386
Median Household Income
$54,787
Median Earnings
$1,374
Median Rent
$710,700
Median Home Value
Check the figures for this property
Cap Rate, Value Estimation, Potential NOI and more
View Realmo Analytics
Market
Vacancy Rate% for Multifamily in West region

Questions? Ask Rey
Realmo’s AI knows this listing — price, zoning, demand, history. Ask anything.


Frequently Asked Questions
What type of property is this?
Quadplex - Well-maintained four-plex with spacious units and recent upgrades.
Where is this quadplex located?
The property is located at 35 Hillside Avenue Salt Lake City, UT.
What is the asking price?
The asking price for this property is $1,550,000.
What are key features of this property?
This property features: Significant rental income upside by adding a 5th unit in the basement.; One unit upgrade resulted in a 66% rent increase, demonstrating potential for similar improvements in other units.; Recently replaced roof, HVAC, and windows minimize near‑term maintenance costs.



